www.atmos-meas-tech.net/5/991/2012/ doi:10.5194/amt-5-991-2012
© Author(s) 2012. CC Attribution 3.0 License.
Measurement
Techniques
Inter-comparison of two high-accuracy fast-response spectroscopic
sensors of carbon dioxide: a case study
B. A. Flowers, H. H. Powers, M. K. Dubey, and N. G. McDowell
Earth and Environmental Science Division, Los Alamos National Laboratory, Los Alamos, NM 87545, USA
Correspondence to:M. K. Dubey ([email protected])
Received: 6 September 2011 – Published in Atmos. Meas. Tech. Discuss.: 15 September 2011 Revised: 29 March 2012 – Accepted: 30 March 2012 – Published: 8 May 2012
Abstract. Tunable diode laser absorption (TDL) and cav-ity ring-down spectroscopic (CRDS) sensors for atmospheric carbon dioxide were co-deployed during summer and fall of 2010 in field and laboratory conditions at Los Alamos Na-tional Laboratory. Both sensors were characterized for ac-curacy and precision for ambient carbon dioxide measure-ments at ground level and compared using both laboratory and ambient field data. After post-processing that included water vapor correction and calibration to WMO reference standards, overall mean [12C16O2] = 392.05±8.92 ppm and
[12C16O2] = 392.22±9.05 ppm were observed between 29
July and 16 August 2010. The mean difference between the CRDS and TDL data for 12CO
2 was 0.04±1.80 ppm
(±1σ in 60 s) for ambient field data, demonstrating the sensors meet the WMO/IAEA compatibility stan-dard. The observations show over the 19-day period the [CO2]
′
CRDS/[CO2]TDLratio exhibits a Gaussian distribution
centered atx0= 1.003±3.38×10⁻⁵ (±1σ), indicating the
ratio is dominated by random noise as opposed to a bias in the output of either sensor. The CRDS sensor is capable of measuring [12C16O2] to a precision of 23 ppb in 1 min and
decreases to 6.5 ppb in 58 min. At one and 58-min, the TDL exhibits precisions of 29 ppb and 53 ppb. The CRDS is com-pact, fast, and stable; the TDL is larger and requires frequent calibrations to maintain its precision. The sensors also ex-hibit consistent hourly averaged diurnal values underscoring the interplay of biological, anthropogenic, and transport pro-cesses regulating CO2at the site.
1 Introduction
Sensors based on optical spectroscopy are important tools for rapid, accurate in situ measurements of greenhouse gases for biosphere-atmosphere flux estimates and source attribution applications. Sensors using mid-IR and IR laser sources or high finesse optical cavities are the state of the art for con-tinuously sensing greenhouse gases with high precision and temporal resolution (Brown, 2003; Chen et al., 2010; Karlon et al., 2010). Numerous laser-based sensors are undergoing rapid development to study greenhouse gases, thus it is im-portant to conduct instrument inter-comparisons to establish their compatibility under field conditions. The World Meteo-rological Organization/International Atomic Energy Agency recommends laboratory inter-comparison compatibility of ±0.1 ppm for total CO2 and further recommends that CO2
mixing ratios be reported for dry gases (WMO, 2009). We inter-compare a commercially available cavity ring-down absorption analyzer (CRDS) with a commercially available tunable diode laser absorption (TDL) system for monitoring carbon dioxide [12C16O2]. Both the CRDS and
TDL sensors are used throughout the climate and ecosystem research and environmental sensing communities and it is important to directly compare the results of laser-based op-tical absorption sensors operating via related principles but different techniques to ensure data sets from either sensor are in agreement with reference standards and each other.
The purpose of this paper is to compare [12C16O2]
(CO2in air, dried to−45◦C dew point). In the field, we
com-pared the ambient carbon dioxide data sets obtained from the sensors obtained during a nineteen-day period in late sum-mer 2010. For ambient measurements, the CRDS analyzer and TDL sensors were set up at the same field site and run on a common inlet and controlled by their respective sam-pling protocols.
2 Methods
The carbon dioxide sensors used in this study are a cavity ring-down analyzer (Picarro 1301-m, Picarro, Inc. CA, USA) (Crosson, 2008) and a TDL absorption sensor (TGA100, Campbell Scientific, Logan, UT). The CRDS sensor mea-sures 12C16O2, 12C1H4, and 1H162 O while the TDL
sen-sor measures isotopologues of CO2: 12C16O2, 13C16O2, 18O12C16O by direct absorption near 2309 cm−1 (Bowling
et al., 2003). For direct comparison, only the12C16O2
sig-nals from either instrument are used in this work and are referred to as CO2 hereafter. Both the CRDS and TDL
instruments have been described previously (e.g., Crosson, 2008; Bowling, et al., 2003) and the TDL sensor used in this study has been described in (Powers et al., 2010). The CRDS sensor uses a near-IR diode laser (scanned be-tween 1603 and 1641 nm to cover CO2and CH4bands) that
does not require liquid nitrogen cooling. Nominal condi-tions are controlled inside the CRDS optical cavity; mea-sured over the 19 day study to be (P= 139.899±0.068 Torr, T= 45.000±0.002◦C), leading to stable spectroscopic fea-tures largely devoid of pressure broadening effects. Simi-larly, the CRDS sensor does not require frequent in situ ab-sorption response calibrations, which are essential for the TDL sensor. The CRDS sensor is designed to operate with-out in situ calibration on ambient air, particulate matter is filtered from the sampled gas stream but no drying is per-formed. Water vapor can interfere with the accuracy of CO2
and CH4 measured with the CRDS due to its operation in
the near-IR. Additionally, the WMO recommends GHG gas measurements be reported for dry mixing ratios. Therefore the effects of water vapor on the CRDS performance are of special concern. The response of the CRDS sensor to wa-ter vapor has been documented (Rella, 2010; Chen et al., 2010) and the procedures recommended by the manufacturer in their 2010 white paper (Rella, 2010) have been used here to produce dry mixing ratios of carbon dioxide used for the inter-comparison. Water vapor affects the accuracy of the water, methane, and carbon dioxide concentrations reported by CRDS sensor and the post-processing corrections for wa-ter vapor inwa-terference in all three channels are given below.
H2Oactual = 0.772×
H2OCRDS+0.02525×H2O2CRDS
(1)
CO2,dry =
CO2,CRDS
1+(−0.012×H2OCRDS)+ −2.67×10⁻⁴×H2O2CRDS
(2)
CH4,dry=
CH4,CRDS
1+(−0.00982×H2OCRDS)+ −2.393×10⁻⁴×H2O2CRDS
(3)
The suitability of the above equations for water vapor correc-tions to the H2O, CH4, and CO2data produced by the CRDS
sensor are vetted by both (Chen et al., 2010; Rella, 2010). The TDL sensor uses a liquid nitrogen cooled tunable lead-salt diode laser that measures 12CO2 absorption near
2308.225 cm−1. Pressure and temperature in the TDL optical
cavity were maintained at 15.0 Torr and 30◦C respectively.
The TDL sensor is calibrated frequently, the operational cy-cle is ambient air is sampled for 60 s, then a high concentra-tion reference gas for 30 s, then a low concentraconcentra-tion reference gas for 30 s. The first 15 s of each measurement in the cycle are not used in the data analysis to account for flushing of the TDL optical cell. The high and low reference gases were tertiary calibration standards cross referenced with WMO-traceable standards from NOAA-ESRL using the TDL. The TDL routinely operates using these tertiary standards to con-serve the WMO standards over time. The WMO reference gases were sourced from and calibrated by the NOAA Green-house Gases Group at the Global Monitoring Division. The uncertainties in the WMO reference concentrations are the standard deviations reported by the above laboratory. The TDL was calibrated using a linear regression between the ref-erence gases bracketing the CO2concentration of any
sam-ples run. The TDL responses to the high and low reference gases are held constant in the linear regression to determine sampled [CO2]. Particulate matter is filtered from the TDL
sample stream and is dried with a Nafion drying system so that the humidity of the sampled gas stream is approximately the same humidity as the reference gases. The TDL sensor operates in the mid-IR and the fundamental CO2vibrational
features used for detection are well separated from those of water.
protocol, the sample stream was switched to both a high or low reference calibration gas for 30 s, then measured ambient [CO2] for 1 min. The first 15 s of data at each stage of this
cycle is ignored to account for flushing and sample equili-bration in the TDL optical cavity (Powers et al., 2010), min-imizing the difference of cavity volumes and sampling rates on the inter-comparison statistics.
3 Results and discussion
3.1 Laboratory inter-comparison and instrumental precision
For the laboratory inter-comparison, the CRDS sensor was plumbed into the manifold that controls the previ-ously described automated sampling and calibration pro-tocol for the TDL sensor. Automated cycling between high, low, and unknown gases was performed for 16 h and output for the CRDS and TDL sensors were aver-aged to 1 min time constants. For the TDL, the enforced high and low reference concentrations were 557.6±0.1 ppm for [CO2]high and 354.6±0.1 ppm for [CO2]low were
used and the measured response to the unknown sam-ple was measured [CO2]unknown= 407.835±0.091 ppm, a
percent relative standard deviation (% RSD) = 0.02 % for [CO2]unknown. The response for the CRDS sensor
was [CO2]high= 547.707±0.743 ppm, [CO2]low= 352.829
±0.076 ppm, and [CO2]unknown= 405.923±0.121 ppm,
re-spectively (CRDS % RSD = 0.1 %, 0.02 %, and 0.03 % respectively for the high, low, and unknown sam-ples). The CRDS sensor responded to “zero-air” (am-bient air passed through a soda-lime CO2 scrubber)
[CO2]0=−0.02±0.03 ppm over several hours of operation
prior to beginning the inter-comparison experiments. The TDL sensor is not recommended to be operated in absence of CO2. The high and low TDL responses are programed to
the values of the CO2 tanks prescribed by the NOAA
lab-oratory, so we enforced a (0,0) point in the calibration plot and enforced the fit through the origin of the calibration plot. Prior to this, the linear regression exhibited a slope of 0.985 and an offset of 1.43. This offset is not statistically differ-ent from zero. The [CO2] values for the laboratory
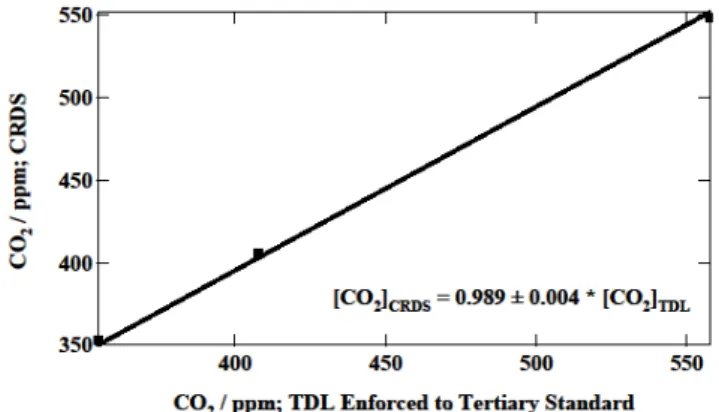
cali-bration are plotted in Fig. 1 and the slope of the linear re-gression between the CRDS and TDL response to the ref-erence and unknown tanks is the CRDS calibration factor, fCRDS= 0.989±0.004 (r2= 0.999 for the regression
analy-sis). This inter-comparison calibrates the CRDS response to the WMO reference standards. The (±1σ) standard de-viations for each concentration are used as error bars, but are too small to see in the plot. The calibration factor is based on reference standards known to a higher precision (sub ppm compared with a few ppm) and wider concentra-tion range than previously used by our group for the CRDS sensor. We use thefCRDScalibration factor determined from
Fig. 1. Laboratory calibration plot of CRDS sensor with TDL ter-tiary standards showing linear response of the CRDS to reference
gases between 375 and 560 ppm CO2.
high precision tertiary standards to correct ambient concen-trations: ×[CO2]CRDS= [CO2]
′
CRDS. Post-calibrated CRDS
data is used for inter-comparison with the TDL for both the laboratory and ambient data sets. The WMO/IAEA metric for compatibility between two instruments is that they agree to±0.1 ppm for total CO2.
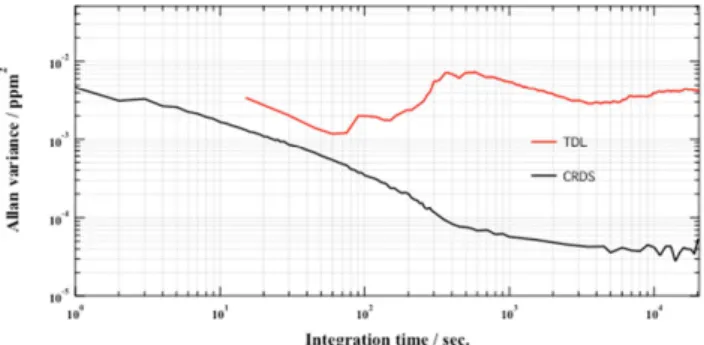
We use the laboratory inter-comparison study to estab-lish the precision and stability as a function of signal in-tegration time for the CRDS and TDL measurement meth-ods using the Allan variance technique (Werle et al., 1993). When the overall noise is dominated by random noise, in-creasing signal integration time decreases the variance (σ2) until a time at which instrumental noise begins to dominate and the variance begins to increase. The maximum precision of each sensor is defined at the integration time where the signal variance is minimized. The transition between ran-dom and instrumental noise can be sharp (quick) or shallow (long), demonstrated in Bowling et al. (2003) and Tuzson et al. (2010). We perform this analysis to compare the per-formance of the CRDS and TDL measuring a reference gas. We note the TDL is calibrated for 30 s each at high and low standards and measures the sample gas for 60 s. In contrast, the CRDS is not constantly re-calibrated and data is reported every∼0.75 s. This is apparent in the time scales of the Al-lan variance plot, where the CRDS data begins at 1 s (black trace) and at 15 s for the TDL (red trace). Using 16 h of data at [CO2] = 405.923±0.121 ppm (from the unknown sample
Fig. 2.Allan variance plot for CRDS sensor (black trace) and TDL (red trace) for 16 h of data shown as a log-log plot of signal variance vs. signal integration time. The minimum variance is observed at 58-min signal integration time for the CRDS sensor and at 60 s for the TDL sensor.
plots for the TDL but a slower transition from the so-called white noise to drift noise regions of the Allan variance plot (Werle et al., 1993). The local variance minimum at 2 s in the CRDS trace is repeatable noise in the variance data, and we do not interpret this as a variance minimum at which instrumental precision should be prescribed (Werle, 2010). This behavior is similarly exhibited by the quantum cascade laser absorption spectrometer (QCLAS) methane sensors de-scribed by (Tuzson et al., 2010). The CRDS sensor exhibits stability at considerably longer integration times than does the TDL sensor, the minimum detection limit (6.5 ppb) is ob-served at 3500 s (58 min) signal integration time, opposed to 30 s (23 ppb) for the TDL, which corresponds to two cali-bration cycles in its measurement protocol. The CRDS de-tection limit at 58 min is in close agreement with the proto-type CRDS sensor from the manufacturer (A. D. Van Pelt, personal communication, 2011), and is here independently verified.
3.2 Continuous ambient carbon dioxide monitoring
We characterize the agreement between the two sensors for quantitative CO2 measurement for ambient field air
by comparing their temporal relationships; the linear re-gression between their temporal signals, and the calcu-lated ratio and difference for their response to ambient CO2 for the 19 day observation period. The 1-min
tem-poral response of both sensors to ambient CO2 near Los
Alamos, NM is shown in Fig. 3. The [CO2]
′
CRDS
mix-ing ratio is shown on top, [CO2]TDL is shown on the
bottom of the plot. The ambient [CO2] signal varies
between 378 and 440 ppm. The diurnal variation is ∼60 ppm day−1 at ground level. Linear regression analy-sis between [CO2]
′
CRDS and [CO2]TDL is shown in Fig. 4.
The linear regression analysis of the 1-min averaged signal between the sensors yields [CO2]
′
CRDS= 1.00±1.7×10
−3
[CO2]TDL+ (2.41±0.66) with R2= 0.96 for the ambient
data. Assuming a zero offset (i.e., perfect agreement)
between the CRDS and TDL sensors, the linear regression between the CRDS and TDL ambient data sets results in [CO2]
′
CRDS= 1.00±3.8×10
−5 [CO
2]TDL. The mean
ra-tio calculated [CO2]
′
CRDS/[CO2]TDL for the sampling
pe-riod is 1.000±0.005. Also shown in Fig. 4 is a his-togram of the ratio [CO2]
′
CRDS/[CO2]TDL for the 1-min
data. The peak of the gaussian fit to the histogram data is centered at x0= 1.003±3.28×10⁻⁵. We note the
im-portance of synchronizing the time axis for proper inter-comparison between the two sensors. For example, on 16 August 2010 there was some drifting (both forward and backward) between the clocks on CRDS and TDL analyz-ers. The data had to be separated into periods that exhib-ited linear time relationships between the time stamps of ei-ther sensor, analyzed for correlation separately by match-ing peak features in the subset time series, and subse-quently concatenated together. Originally the correlation analysis for 16 August showed [CO2]CRDS= 0.979±0.008
[CO2]TDL+ (13.10±2.95), a y-intercept that is statistically
different from zero (and indeed may be interpreted as a 13 ppm offset in [CO2]CRDS). The data on 16 August
was separated into AM and PM periods and time synchro-nized separately. This data was merged and re-analyzed to [CO2]CRDS= 1.003±0.007 [CO2]TDL+ (3.67±2.6), which
we interpret as a zero-intercept with respect to a quantitative [CO2] offset between the two sensors.
The final trace in Fig. 3 is the self-corrected ambient water ([H2O]dry) measured during the ambient observations. The
maximum volume percent observed throughout the measure-ment period was 2.7 % and the minimum was 0.66 %. The mean self-corrected ([H2O]dry) observed was 1.58±0.34 %
by volume. We observed no correlation between the 1-min difference between the CRDS-TDL sensors (1CO2)
vs. ([H2O]dry). The water vapor correction reported by
Rella (2010) is observed robust in this case study. The dif-ference between the post-calibrated CRDS and TDL sig-nals is the key statistic for the inter-comparison analysis de-scribed here. The mean difference between [CO2]
′
CRDSand
[CO2]TDLis 0.04 ppm±1.80 ppm (±1σ) for the 1-min time
averaged data (plotted as the third trace in Fig. 3). The mean difference is less than the±0.100 ppm metric set forth by the WMO/IAEA, hence we have demonstrated that on average the ambient air CO2 results from the CRDS and TDL
sen-sors are compatible when the sensen-sors are calibrated to high precision standards and the CRDS signal is corrected for wa-ter vapor inwa-terference.
3.3 Diurnal cycle of carbon dioxide
The laboratory calibration and 1-min time resolution agree-ment between the data sets are robust factors underlying longer time averaged data to describe the diurnal pattern of the [CO2] atmospheric background signal. The hourly
aver-aged diurnal pattern of CO2 is an important statistic to
440 420 400 380
[CO
2
]; CRDS
7/29/10 7/31/10 8/2/10 8/4/10 8/6/10 8/8/10 8/10/10 8/12/10 8/14/10
MST Local Time, Los Alamos, NM
440 420 400 380
-20 0 20
Δ
[CO
2
]
2.5 2.0 1.5 1.0
Fig. 3.Temporal profile of [12C16O2] mixing ratio measured near Los Alamos, NM with CRDS and TDL sensors. The CRDS signal has
been cross-calibrated, as described in the text. The1[CO2] trace shows the temporal profile of the [CO2]
′
CRDS−[CO2]TDLdifference.
Fig. 4.Linear regression analysis of12C16O2measured with commercial CRDS and TDL analyzers after cross calibration using 1-min time
resolution. The linear regression analysis between the CRDS and TDL response is [CO2]′CRDS= 1.000±3.30×10⁻⁵[CO2]TDL; r2= 0.96.
The histogram plot of the ratio between the CRDS and TDL measurements and the gaussian fit of the [CO2]
′
CRDS/[CO2]TDLratio is centered
on an x0value of 1.003.
and effects transport (including anthropogenic CO2) in the
regional CO2 background. Raw data was averaged to 1-h
time constants for each hour of the day (0–23 h) for the 19-day ambient observation study to create hourly averaged di-urnal CO2profiles. Table 1 shows the median diurnal [CO2]
for each hour (60 min averaged) of the day between 29 July and 16 August 2010 from the CRDS (top trace) and TDL (bottom trace) sensor. Nightly increases (00:00–06:00 and 20:00–23:00 LT – local time) in [CO2] (both in magnitude
and variability) are due to respiration and daily (07:00– 19:00 LT) uptake of [CO2] by photosynthesis is evident in
data sets from both sensors. Ambient temperature is included in the third column. The fourth column in Table 1 shows the difference between the diurnal median [CO2] for each
hour. The mean difference between the CRDS and TDL di-urnal median 1-h values is much smaller (1.80±1.50) ppm than either of their variabilities (difference between 75th and
25th percentiles), 4.85±2.40 ppm and 5.17±2.56 ppm for CRDS and TDL respectively. The correlation factor (r2) between the [CO2] data sets is 0.91, a correlation factor
of 1.0 represents a perfectly correlated relationship. Anti-correlation between median diurnal ambient temperature and median diurnal [CO2] for both sensors is shown in Fig. 5.
While the mechanisms controlling this interplay of respira-tion, photosynthesis, and dynamics are not the subject of our paper, it is clear that both sensors provide very consistent information.
The CRDS system in this study provides robust perfor-mance for12C16O2,12C1H4, and1H162 O monitoring and is
readily deployable to field sites and mobile platforms includ-ing aircraft. There is no isotopic speciation data available from this particular CRDS sensor, however it does measure CH4and a new version of the sensor includes CO
Fig. 5.Hourly diurnal median [CO2] between 29 July and 16
Au-gust 2010 near Los Alamos NM. The scaled CRDS [12C16O2]
′
CRDS
trace is plotted on top, the [12C16O2]TDLtrace is plotted in the
mid-dle and hourly diurnal median ambient air temperature is plotted on the bottom trace.
δ13C andδ18O ratios in CO2 at stationary sites. The TDL
is capable of measuring 99.91 % of the naturally occurring gaseous CO2isotopes and monitoring theδ13C andδ18O
ra-tios in CO2as tracers of air mass history and soil-atmosphere
exchange (Pataki et al., 2006; Shim et al., 2011; Powers et al., 2010). However, it is large and requires liquid N2
cool-ing and regular calibration makcool-ing it less ideal for mobile applications.
4 Conclusions
We report the results of a field and laboratory inter-comparison experiment between two commercially available spectroscopic carbon dioxide (12C16O2) sensors. Prior
to the field inter-comparison, the CRDS sensor was cal-ibrated to two WMO reference standards for CO2 in a
3-point calibration curve (m= 0.989, r2= 0.999). Over a nineteen-day period, after post calibration, the agreement between the two sensors was quite good (slope = 1.000, zero intercept enforced or [CO2]
′
CRDS= 1.00±1.7×10
−3
[CO2]TDL+ (2.41±0.66)) for 1 min measurements of
Table 1. Hourly diurnal median [CO2]
′
CRDS, [CO2]TDL, ambient
temperature (◦C), and the absolute value of1[CO2] (CRDS–TDL)
measured between 29 July and 16 August 2010 near Los Alamos, NM.
Hour [CO2]
′
CRDS [CO2]TDL Temp. 1[CO2]
(◦C)
0 398.20 399.41 19.6 1.21
1 399.50 400.98 18.3 1.30
2 400.15 401.18 18.0 1.02
3 401.28 402.30 17.7 1.02
4 402.54 401.53 17.3 1.01
5 401.77 403.41 17.0 1.64
6 404.10 398.86 16.3 5.23
7 399.10 393.67 17.0 5.41
8 393.37 390.47 17.7 2.90
9 391.07 388.55 19.0 2.52
10 388.97 386.19 21.0 2.78
11 386.35 384.21 22.3 2.14
12 384.35 382.59 23.7 1.75
13 382.67 382.89 25.0 0.22
14 382.66 381.94 25.3 0.72
15 381.97 381.75 25.7 0.22
16 382.13 381.96 26.0 0.17
17 382.28 383.62 25.7 1.34
18 383.23 386.25 25.7 3.02
19 391.12 389.83 23.5 3.71
20 391.23 393.85 22.3 2.62
21 394.66 394.06 21.0 0.60
22 394.34 393.83 21.0 0.51
23 394.13 394.04 20.0 0.09
mean 391.55±7.52 391.92±7.66 1.80±1.50
ambient carbon dioxide. Both sensors were observed to behave linearly over a range of ambient [CO2] (380–
450 ppm) and in laboratory (354–557 ppm). The robust agreement between these sensors underscores their fast, quantitative [CO2] capability for atmosphere-biosphere
exchange and ambient carbon dioxide (ground, mobile, and flight) measurements. The compatibility of the two data sets was judged as the the mean difference between [CO2]
′
CRDS
and [CO2]TDL and was 0.04±1.8 ppm (±1σ) for dry gas
[CO2] ambient measurement, hence we demonstrate that
the CRDS and TDL instruments are in agreement with the WMO/IAEA compatibility recommendation of±0.100 ppm for dry [12C16O
2]. A gaussian fit to the histogram of the
[CO2]
′
CRDS/[CO2]TDL ratio over the 19 day observation
was centered at 1.003±3.38×10⁻⁵(±1σ). The precisions
for the sensors were determined from statistical analysis from 16 h of data taken from a single CO2 source. The
of 29 ppb and the CRDS shows a comparable precision of 23 ppb. We observed the minimum variance of the CRDS CO2 response after 58 min of signal integration. At 58 min
time constants, we observed TDL precision of 53 ppb and 6.5 ppb for the CRDS sensor.
Operational in situ calibration of the CRDS system is needed infrequently (especially for ground based sensing), but periodic calibration with high precision standards should be performed to ensure linearity of its response under ambi-ent [CO2] conditions. Both sensors provide valuable data for
carbon dioxide monitoring and their additional data streams put the CO2 data stream in different contexts, i.e., H2O,
CO2, and CH4 from the CRDS and 12C16O2 13C16O2 and 18O12C16O from the TDL. Inter-comparison for isotopic
spe-ciation sensors (e.g.,13C16O2and18O12C16O) should be
in-vestigated for appropriate sensors to judge their compatibil-ity according to WMO/IAEA standards. Our study will be especially valuable for analysis of experiments where mul-tiple high precision fast response instruments are measuring greenhouse gases and differences may need to be interpreted and diagnosed (Wofsy, 2011).
Acknowledgements. B. A. F. and M. K. D. acknowledge the US Department of Energy ASR program and LANL’s Laboratory Directed Research and Development program (LDRD). H. P. and N. M. acknowledge Clif Meyer, LANL’s LDRD program and the Institute for Geophysical and Planetary Physics (IGPP) Programs.
Edited by: M. von Hobe
References
Bowling, K., Sargent, S. D., Tanner, B. D., and Ehleringer, J. R.: Tunable diode laser absorption spectroscopy for stable
iso-tope studies of ecosystem-atmosphere CO2exchange, Agr.
For-est Meteorol., 118, 1–19, 2003.
Brown, S. S.: Absorption Spectroscopy in High-Finesse Cavi-ties for Atmospheric Studies, Chem. Rev., 103, 5219–5238, doi:10.1021/cr020645c, 2003.
Chen, H., Winderlich, J., Gerbig, C., Hoefer, A., Rella, C. W., Crosson, E. R., Van Pelt, A. D., Steinbach, J., Kolle, O., Beck, V., Daube, B. C., Gottlieb, E. W., Chow, V. Y., Santoni, G. W., and Wofsy, S. C.: High-accuracy continuous airborne measurements
of greenhouse gases (CO2and CH4) using the cavity ring-down
spectroscopy (CRDS) technique, Atmos. Meas. Tech., 3, 375– 386, doi:10.5194/amt-3-375-2010, 2010.
Crosson, E. R.: A cavity ring-down analyzer for measuring atmo-spheric levels of methane, carbon dioxide, and water vapor, Appl. Phys. B, 92, 403–408, 2008.
Karlon, A., Sweeney, C., Tans, P., and Newberger, T.: AirCore: An Innovative Atmospheric Sampling System, J. Atmos. Ocean. Tech., 27, 1839–1852, 2010.
Pataki, D. E., Bowling, D. R., Ehleringer, J. R., and
Zob-itz, J. M.: High resolution atmospheric monitoring of
ur-ban carbon dioxide sources, Geophys. Res. Lett., 33, L03813, doi:10.1029/2005GL024822, 2006.
Powers, H. H., Hunt, J. E., Hanson, D. T., and McDowell, N. G.: A dynamic soil chamber system coupled with a tunable diode laser for online measurements ofδ13C,δ18O, and efflux rate of
soil-respired CO2, Rapid Commun. Mass Spectrom., 24, 243–253,
2010.
Rella, C.: Accurate Greenhouse Gas Measurements in
Hu-mid Gas Streams Using the Picarro G1301 Carbon Diox-ide/Methane/Water Vapor Gas Analyzer, Sunnyvale, CA, 2010. Shim, J., Powers, H. H., Meyer, C., Pockman, W., and
McDow-ell, N.: The role of inter-annual, seasonal, and synoptic cli-mate on the carbon isotope ratio of ecosystem respiration at a semi-arid woodland, Global Change Biol., 17, 2584–2600, doi:10.1111/j.1365-2486.2011.02454.x, 2011.
Tuzson, B., Hiller, R. V., Zeyer, K., Eugster, W., Neftel, A., Am-mann, C., and Emmenegger, L.: Field intercomparison of two
optical analyzers for CH4eddy covariance flux measurements,
Atmos. Meas. Tech., 3, 1519–1531, doi:10.5194/amt-3-1519-2010, 2010.
Werle, P.: Time domain characterization of micrometeorological data based on a two sample variance, Agr. Forest Meteorol., 150, 832–840, 2010.
Werle, P., M¨ucke, R., and Slemr, F.: The Limits of Signal Averaging in Atmospheric Trace-Gas Monitoring by Tunable Diodle-Laser Absorption Spectroscopy (TDLAS), Appl. Phys. B, 57, 131–139, 1993.
WMO: 15th WMO/IAEA Meeting of Experts on Carbon Diox-ide, Other Greenhouse Gases and Related Tracers Measurements Techniques, Jena, Germany, 2009.
![Fig. 3. Temporal profile of [ 12 C 16 O 2 ] mixing ratio measured near Los Alamos, NM with CRDS and TDL sensors](https://thumb-eu.123doks.com/thumbv2/123dok_br/18168541.329675/5.892.188.701.101.338/temporal-profile-mixing-ratio-measured-alamos-crds-sensors.webp)
![Fig. 5. Hourly diurnal median [CO 2 ] between 29 July and 16 Au- Au-gust 2010 near Los Alamos NM](https://thumb-eu.123doks.com/thumbv2/123dok_br/18168541.329675/6.892.73.425.95.558/fig-hourly-diurnal-median-july-gust-near-alamos.webp)
