a Traditional Chinese Medicine,
Scrophularia
ningpoensis
Hemsl. (Scrophulariaceae)
Chuan Chen1,2, Pan Li1, Rui-Hong Wang1, Barbara A. Schaal3*, Cheng-Xin Fu1*
1The Key Laboratory of Conservation Biology for Endangered Wildlife of the Ministry of Education, College of Life Sciences, Zhejiang University, Hangzhou, China, 2Hangzhou Botanical Garden, Hangzhou, China,3Department of Biology, Washington University, St. Louis, Missouri, United States of America
Abstract
Background:Domestic cultivation of medicinal plants is an important strategy for protecting these species from over harvesting. Some species of medicinal plants have been brought into cultivation for more than hundreds years. Concerns about severe loss of genetic diversity and sustainable cultivation can potentially limit future use of these valuable plants. Genetic studies with comprehensive sampling of multiple medicinal species by molecular markers will allow for assessment and management of these species. Here we examine the population genetic consequences of cultivation and domestication inScrophularia ningpoensisHemsl. We used chloroplast DNA and genomic AFLP markers to clarify not only the effects of domestication on genetic diversity, but also determine the geographic origins of cultivars and their genetic divergence from native populations. These results will allow both better management of cultivated populations, but also provide insights for crop improvement.
Results:Twenty-one cpDNA haplotypes ofS. ningpoensiswere identified. Wild populations contain all haplotypes, whereas only three haplotypes were found in cultivated populations with wild populations having twice the haplotype diversity of cultivated populations. Genetic differentiation between cultivated populations and wild populations was significant. Genomic AFLP markers revealed similar genetic diversity patterns. Furthermore, Structure analysis grouped all wild populations into two gene pools; two of which shared the same gene pool with cultivatedS. ningpoensis. The result of Neighbor-Joining analysis was consistent with the structure analysis. In principal coordinate analysis, three cultivated populations from Zhejiang Province grouped together and were separated from other cultivated populations.
Conclusions:These results suggest that cultivatedS. ningpoensishas experienced dramatic loss of genetic diversity under anthropogenic influence. We postulate that strong artificial selection for medicinal quality has resulted in genetic differentiation between cultivated and wild populations. Furthermore, it appears that wild populations in Jiangxi-Hunan area were involved in the origin of cultivatedS. ningpoensis.
Citation:Chen C, Li P, Wang R-H, Schaal BA, Fu C-X (2014) The Population Genetics of Cultivation: Domestication of a Traditional Chinese Medicine,Scrophularia ningpoensisHemsl. (Scrophulariaceae). PLoS ONE 9(8): e105064. doi:10.1371/journal.pone.0105064
Editor:Xiao-Yong Chen, East China Normal University, China
ReceivedFebruary 13, 2014;AcceptedJuly 18, 2014;PublishedAugust 26, 2014
Copyright:ß2014 Chen et al. This is an open-access article distributed under the terms of the Creative Commons Attribution License, which permits unrestricted use, distribution, and reproduction in any medium, provided the original author and source are credited.
Funding:This research was supported by the Key Breeding Project of Zhejiang Province (2012C12912), the National Natural Science Foundation of China (31070205), and Science and Technology Development Project of Hangzhou West Lake Scenic Area Management Committee (2012002). The funders had no role in study design, data collection and analysis, decision to publish, or preparation of the manuscript.
Competing Interests:The authors have declared that no competing interests exist.
* Email: schaal@biology.wustl.edu (BAS); cxfu@zju.edu.cn (CXF)
Introduction
Plant domestication is one of the great milestones in human history. The process of domestication represents a continuum of increasing codependence between plants and people [1]. Crop species have been derived from their wild progenitors as a result of artificial selection for desirable traits by early farmers. In the light of crop domestication, a number of agencies now are recom-mending that wild medicinal plants be brought into cultivation systems [2,3]. Currently, more than 80% of the world’s population in developing countries depends primarily on herbal medicine for basic healthcare needs [4,5]. Given the demand for a reliable and uniform supply of medicinal plants and the accelerating depletion of forest resources, cultivation of medicinal plants species would be
an important strategy and a viable alternative to harvesting of natural populations [6,7].
At present some medicinal plants are grown in home farms, and some are cultivated as field crops. But the number of medicinal plants species currently in high intensity cultivation for commercial production are varied world-wide. In India, 20 species are currently under cultivation, in Hungary 40 and in Germany 100 [6,8,9,10]. China, with its history of thousands years of medicinal plant use cultivates only about 250 species [11,12]. Considering the harvest pressure on wild populations and the increasing demands, the most popular medicinal plants are cultivated under the supervision of Chinese government on large scale reaching almost 1 million acres [13].
species such asArtemisia judaica[14],Scutellaria baicalensis[15], Corydalis yanhusuo [16], Coptis chinensis [17], Magnolia officinalis subsp. biloba [18], Fritillaria cirrhosa[19]. However, all these studies only used single molecular marker or local sampling which just revealed genetic diversity patterns in limited populations. Since genetic diversity underlies the plasticity of secondary metabolism and hence the production of medicinal compounds [20], understanding the population genetics across the range of wild populations is essential for utilizing native resources for improvement of cultivated species. A study with comprehensive sampling of both cultivated and wild populations of medicinal species, using both chloroplast and nuclear DNA markers, can clarify not only changes in genetic diversity, but also provide information on domestication including the geographic origins, ancestor populations and the impact of domestication on population genetics.
Plant secondary metabolites are responsible for phytochemical diversity and therapeutic efficacy of medicinal species. The production of secondary compounds is influenced by both environmental and genetic factors [20,21]. Thus geographically distinct populations even of the same species may have vastly different medical qualities [22]. Modern methods of phytochem-ical methods are used to discriminate geographphytochem-ically dispersed cultivars within a medicinal species [23,24,25,26,27]. Yet little is known about the genetic differences among the wild populations of a medicinal species and whether cultivated populations with high pharmaceutical quality have already significantly diverged from wild populations. Additionally, understanding genetic changes associated with cultivation not only helps control the quality of medicinal herbs, but also provides practical information essential for formulating appropriate conservation and cultivation manage-ment strategies [28,29].
Scrophularia ningpoensisHemsl. is a perennial herb native to Southeastern China. Wild populations are distributed in forests along streams, thickets, and tall grasses below alt. 1700 m and reproduce from seed [30]. Roots of this medicinal herb have a long history of widespread use in China to treat inflammation, laryngitis, tonsillitis, abscesses and constipation [31,32,33]. The first recorded use in ancient Chinese literature is from ca. 100 BC [34]. Harpagoside, angroside C, acteoside and cinnamic acid are the main bioactive components [35,36,37,38,39]. According to the Chinese Pharmacopoeia, only the root ofS. ningpoensisis listed as the Radix Scrophulariae [40]. Our recent field investigations indicated that wild populations of this herb have suffered rapid declines, and the species is extirpated in many locations due to over exploitation and deterioration of habitats. An analysis of the population genetics of wildS. ningpoensispopulations is important and urgent for appropriate utilization, conservation and preser-vation of the wild resources.
Today,S. ningpoensisis cultivated for its roots on a large scale in several regions of Central and Southeastern China. This species can trace its cultivation history back to Song dynasty (1000 years ago) beginning in backyard gardens [41]. In spite of this long written history, the geographic origin of cultivation has not been recorded. Formal cultivation programs were initiated in China only since the 1950’s [42]. Unlike wild populations, cultivatedS. ningpoensisis propagated vegetatively from rhizome. During the cultivation, large rhizomes are often selected for propagation; flowers are removed before opening so that resources are allocated to vegetative growth, in particular the rhizomes [43,44]. Our previous study used HPLC revealed that among cultivated S. ningpoensis, accessions from Zhejiang Province produced higher concentrations of three main bioactive compounds, suggesting that the best quality of cultivatedS. ningpoensisis from Zhejiang [45].
These results are consistent with the general perspective thatS. ningpoensisfrom Zhejiang has the best quality for medical use [46]. Besides the phytochemical differences, the unresolved question of whether cultivated S. ningpoensis from Zhejiang is genetically differentiated for others is also important and indispensable to sustainable cultivation ofS. ninpoensis.
Here we used two chloroplast DNA fragments and AFLP markers to study the population genetics and phylogeography of wild and cultivatedS. ningpoensiswith the aims of: (1) evaluating the genetic erosion of cultivated populations and the change in the pattern of genetic diversity under artificial selection; (2) unraveling the geographical origins and ancestral populations of cultivatedS. ningpoensis; (3) clarifying the genetic divergence between culti-vated populations from Zhejiang Province and the rest of cultivated S. ningpoensis; and (4) determining which wild populations are valuable and can be introduced for improvement of cultivation.
Materials and Methods
Ethics Statement
Management Bureau of Mt. Jinggang National Nature Reserve issued the permit for Jinggang Mountain (JGW); Management Bureau of Mt. Tianmu National Nature Reserve issued the permit for Tianmu Mountain (TNW, TM1W, TM2W); Management Bureau of Mt. Dapan National Nature Reserve issued the permit for Dapan Mountain (TWW). No specific permissions were required for other locations which are neither privately owned nor protected and the field study did not involve endangered or protected species.
Sampling and DNA extraction
Field studies were conducted throughout distribution range of Scrophularia ningpoensis. Specific locations (GPS coordinates) of our field work are indicated in Table 1. A total of 364 individuals representing 13 cultivated and 14 wild populations were sampled with nine to twenty-two individuals collected randomly for each population (Table 1, Figure 1). Leaf material was dried in silica gel and stored at 4uC. Voucher specimens are deposited in the Herbarium of Zhejiang University (HZU), China. Total genomic DNA was extracted using a modified (CTAB) method [47,48].
Chloroplast (cp) DNA sequences analysis
After preliminary screening for variation in the intergenic spacer (IGS) regions of chloroplast DNA, two regions:trnL–trnF [49] andpsbA–trnH [50] were chosen for analysis because they contained sufficient levels of informative polymorphic sites. PCR amplification was performed in an ABI 9700 thermocycler (Applied Biosystems). Cycling conditions were 95uC for 2 min followed by 35 cycles of 94uC (45 s), 57uC (45 s), 72uC (1 min), and concluding extension at 72uC (10 min). The reaction mixture (25mL) contained 2.5 mm/L MgCl2, 0.5mm/L dNTP, 2.5ml
106buffer, 2.5mm/L primer, 1 U Taq DNA polymerase (Takara
Bio Inc.) and 20 ng DNA template. PCR products were identified on 1.5% agarose gels in a 0.56TBE buffer, stained with ethidium bromide (0.5mg/ml), visualized with ultraviolet light and
photo-graphed. DNA Marker DL2000 (TakaraBio Inc.) was used. The PCR products with a single band were cleaned by a GENE-CLEAN II Kit (BIO 101, Inc. Carlsbad, USA) for direct sequencing. Samples were sequenced in forward and reverse directions using the dideoxy chain termination method with fluorescent labeling with Big Dye Terminator (version 1.1). Sequences were determined with an ABI 377XL DNA sequencer and edited using Sequencher version 4.0 (Gene Codes Corp., Ann Domestication ofScrophularia ningpoensis
Arbor, MI, USA). Sequences of the two IGS regions were combined and aligned by Clustal W version 1.8 [51].
Sequences from all individuals were characterized for their cpDNA haplotypes. Chloroplast DNA haplotype diversity (h) and nucleotide diversity (p) [52] were calculated for each population
(hS,pS) and overall (hT,pT) using DNASP 5.10 [53]. A haplotype
network rooted by Scrophularia buergeriana that contains all linkages with.95% probability of being most parsimonious was drawn by TCS version 1.21 [54]. In this analysis, indels and one inversion were treated as single mutation events. Phylogenetic
relationships among cpDNA haplotypes of S. nignpoensis were assessed by Bayesian inference (BI), maximum likelihood (ML), and maximum parsimony (MP) methods with S.buergeriana,S. spicataandS. dentateas the outgroup. For Bayesian inference, the substitution model was determined by MrModeltest 2.2 [55] and the best-fit model (F81+I+G) was selected by Akaike information criterion (AIC). Then Bayesian analysis was performed by MrBayes 3.1.2 [56]. Two independent runs of four Markov chains each starting with a random tree were processed in ten threads simultaneously for 50 million generations, sampling trees Table 1.Details of sample locations and sample sizes (N) ofScrophularia ningpoensis.
Population code Locality Altitude (m)
Lat. (6N) Long.
(6E) N CpDNA N AFLP Vouchers
CULTIVATED
GZC Guangze, Fujian Province 234 117u209, 27u329 15 15 LP0805GZ
JFC Jinfo Mountain, Chongqin Province
1282 107u129, 29u009 14 13 FU0810321
SCC Guangyuan, Sichuan
Province
594 105u479, 32u279 14 19 GW20070705
XJC Xianju, Zhejiang Province 63 120u449, 28u519 10 10 CC20060601
*RCC/PAC Pan’an, Zhejiang Province 356 120u249, 28u549 15 4 CC20060602
*YCC/PAC Pan’an, Zhejiang Province 357 120u339, 29u059 11 4 CC20060603
*SHC/PAC Pan’an, Zhejiang Province 537 120u399, 29u089 10 4 CC20060604
*DPC/PAC Pan’an, Zhejiang Province 581 120u329, 28u599 14 4 CC20060605
YLC Yangling, Shanxi Province 459 108u049, 34u159 15 10 LP20080811
ZPC Zhenping, Shanxi Province 1013 109u339, 31u459 15 10 LP20090610
KKC Suiyan, Guizhou Province 1572 107u099, 28u139 10 8 WY20090618
LOC Long Mountain, Hunan
Province
843 109u439, 29u369 15 10 ST20090601
NSC Enshi, Hubei Province 1606 110u129, 30u449 13 10 ZZ20080721
WILD
HNW Pingjiang, Hunan Province 1428 113u499, 28u389 15 15 SS20070821
JGW Jinggang Mountain,
Jiangxi Province
975 114u079, 26u359 15 15 CC0708J029
JHW Jiuhua Mountain, Anhui Province
1246 117u499, 30u289 22 22 CC20080507
JMW Junma, Henan Province 673 111u259, 33u289 13 13 SS20070703
LAW Tiantang zhai, Anhui
Province
492 115u479, 31u119 15 14 LP0906508
LSW Lenshui, Jiangxi Province 80 117u119, 28u159 15 15 SS20070701
MTW Matou, Jiangxi Province 101 115u539, 29u279 15 15 SS20070702
PTW Putuo, Zhejiang Province 17 122u239, 30u009 9 9 CC20080527
THW Tiantai Mountain, Zhejiang Province
960 121u059, 29u149 15 14 LP0910919
TNW Tianmu Mountain,
Zhejiang Province
1477 119u259, 30u209 15 14 LP0906TMS
TTW Tiantong, Ningbo,
Zhejiang
348 121u479, 29u489 10 10 CC20071001
TM1W Tianmu Mountain,
Zhejiang Province
315 119u269, 30u199 10 10 CC20061001
TM2W Tianmu Mountain,
Zhejiang Province
266 119u299, 30u199 15 10 CC20070706
TWW Dapan Mountain, Zhejiang University
469 120u239, 28u549 9 9 CC20060901
*In AFLP analysis, four populations RCC, YCC, SHC and DPC are combined as one population coded PAC, and in Figure 1C these four populations are also indicated as PAC.
at every 1000 generation. The first 12500 sampled trees (25%) were discarded as burn-in samples. Maximum likelihood [57] tree and ML bootstrap searches were conducted using RAxML V.7.2.8 [58] on the CIPRES [59]. Final tree was evaluated and optimized under GAMMAGAMMA Model. ML bootstrap values were estimated from 1000 bootstrap replicates. Maximum parsimony analyses were conducted using PAUP* version 4.0b10 [60]. Support values for the relationships were calculated by performing bootstrap analyses of 1000 heuristic search replicates using the TBR branching swapping algorithm with 100 random additions per replicate. The geographical distribution of haplotypes was plotted on a map of China using Mapinfo (Pitney Bowes, Inc.). To test for significant difference in haplotype frequencies between wild and cultivated populations, total diversity (hT),
within-population diversity (hS), U test (Nst/Gst) and population
differentiation (GST) were calculated in HAPLONST [61].
Hierarchical structure of genetic variation was estimated by an analysis of molecular variance (AMOVA) on three levels: among groups (cultivated and wild groups); among-population within groups; and within-population. All AMOVAs were performed with ARLEQUIN [62]. Sequence variation was tested for deviations from neutrality by Tajima’s D statistic [63], and by Fu and Li’sD* andF*statistics [64] using DNASP 5.10 [65].
AFLP analysis
AFLP method followed the protocol established by Vos [66] with minor modifications. First, selective primer pairs were pre-screened for three individuals. Second, thirty-six primer combi-nations which had produced well-separated fragments in the pre-screen were used on eight individuals from different populations to
determine polymorphisms. Six primer pairs which yielded polymorphic, clear and reproducible fragments were selected for the final AFLP analysis:EcoRI-AAC (FAM)/MseI-CTC, EcoRI-ACA (FAM)/MseI-CTG, EcoRI-ACC (HEX)/MseI-CAC, EcoRI-ACC (HEX)/MseI-CTA, EcoRI-AGG (TAMAR)/MseI-CAG andEcoRI-AGG (TAMAR)/MseI-CTC. FAM, HEX and TAMAR are three differential fluorescence labels for multiplexed electrophoresis.
The protocols are as follows: (i) in the digestion step, 2.5 ul (0.25–0.3 ug) of genomic DNA was restricted in 2.5 ul of a reaction mixture that contained 0.2ml Eco R I (15 U/mL), 0.15 ul
Mse I (10 U/mL), 0.5ml 106Buffer and 1.65ml ddH2O. The
mixture was kept at 37uC for 3 hours, then 65uC for 10 minutes; (ii) the ligation reaction included 5.0ml digested genomic DNA, 1.0ml 106T4 DNA ligase buffer, 1.0ml Eco R I-adapters (5mM), 1.0ml Mse I adapters (50mM), 0.1ml T4 DNA ligase (3 U/mL) and 1.9ml ddH2O. The ligation reaction was 16uC for 12 h and
the product was diluted with 90ml of ddH2O; (iii) pre-selective
amplifications were carried out in 12.5ml reactions: 2.5ml diluted
ligation product, 1.25ml 106PCR buffer, 1ml MgCl2(25 mmol/
L), 2ml dNTPs (2.5 mmol/L), 0.5ml Eco R I - A primer (5 umol/ L), 0.5ml Mse I - C primer (5 umol/L), 0.05ml Taq DNA Polymerase (5 U/mL), 4.7ml ddH2O. PCR conditions for
pre-selective amplification were 72uC for 2 min; 94uC for 20 sec, 56uC for 30 sec, 72uC for 2 min, for 20 cycles, 60uC for 30 sec. The product of the pre-selective PCR was diluted with 150ml ddH2O;
(iv) selective amplification reactions included 3ml diluted
pre-selective amplification products, 1.25ml 106PCR buffer, 1.25ml MgCl2 (25 mmol/L), 2ml dNTPs (2.5 mmol/L), 0.8ml Eco R I
primer (0.5 U/mL), 0.5ml M primer (5 U/mL), 0.5ml BSA
Figure 1. Analyses of 21 chloroplast (cp) DNA haplotypes ofScrophularia ningpoensis.(A) The maximum likelihood tree of 21 chloroplast (cp) DNA haplotypes ofS. ningpoensis,S. buergeriana,S. spicataandS. dentatawere used as the outgroup. Statistical supports (Bayesian posterior probability $80/maximum likelihood bootstrap value$50/maximum parsimony bootstrap value$50) are indicated on the branches. (B) 95% plausible network of the 21 cpDNA haplotypes ofS. ningpoensis(A–E11). The size of circles corresponds to the frequency of each haplotype. Each solid line represents one mutational step that interconnects two haplotypes for which parsimony is supported at the 95% level. The small open circles indicate inferred intermediate haplotypes not detected in this investigation. (C) A geographic distribution of 21 cpDNA haplotypes (A–E11) detected inScrophularia ningpoensis. The populations correspond to those detailed in Table 1. Squares represent cultivated populations and circles represent wild populations.
doi:10.1371/journal.pone.0105064.g001
Domestication ofScrophularia ningpoensis
(20 mg/mL), 0.1ml Taq DNA Polymerase (5 U/mL), 3.6ml
ddH2O. PCR conductions were 94uC for 2 min; 13 cycles of
94uC for 30 sec, 65uC–56uC (20.7uC/cycles) for 1 min, 72uC for 1.5 min; 23 cycles of 94uC for 30 sec, 56uC for 1 min, 72uC for 1.5 min; 72uC for 8 min. The product of the selective amplifica-tion was analyzed on ABI3730 (Applied Biosystems) according to the manufacture instructions with GS ROX-labelled 500 size standard (Applied Biosystems). For each primer combination, negative amplification controls without template DNA resulted in no amplification products.
Raw AFLP data were scored and collected as presence/absence matrix firstly by Genemarker v1.7 (SoftGenetics LLC) and then each locus was manually inspected. Only unambiguously detect-able fragments in the size range 75–450 bp were scored. To test the reproducibility of the AFLP data, the complete AFLP procedure (digestion, ligation, pre-selective, selective amplification) was repeated for 15 individuals (5% of the samples) and scored independently for each primer pair.
Assuming a set of measures of wild and cultivated populations, population genetic statistics were generated by the program POPGENE version 1.31 [68] including: the number of polymor-phic fragments (Fp), the percentage of polymorpolymor-phic fragments (PPF), Nei’s [67] gene diversity (h), Shannon’s diversity index (H), coefficient of gene differentiation (GST= total genetic diversity
-gene diversity within population/total -genetic diversity), and the level of gene flow: Nm= 0.5(12GST)/GST. To explore the
relationships among individuals Principal Coordinate Analysis (PCoA) was performed by software MVSP version 3.1 (Kovach Computing Services, Anglesey, Wales) from pairwise Euclidian distances between individuals genotypes. A neighbor-joining (NJ) tree rooted by the populations of Scrophularia buergeriana was constructed by the PHYLIP 3.62 package [69] and group support was assessed by a bootstrap analysis with 1000 replicates. Genetic admixture analysis was implemented in STRUCTURE version 2.2.3 [70] with ‘‘no admixture model’’ and assumed ‘‘uncorrelated allele frequencies’’ [71]. The main modeling assumptions of STRUCTURE are Hardy-Weinberg equilibrium within popula-tions [70]. But the cultivated populapopula-tions are Hardy-Weinberg disequilibrium because of extensively clonal reproduction by rhizome within population. So instead of using all cultivated populations, only one individual from each different cultivated population (total ten individuals) were used for STRUCTURE analysis. The number of clusters (K) was set from 2 to 14 (number of all wild populations) with 10 replicate runs for each K, a burn-in period of 100000, and additional 1000000 replicates of the MCMC chains after burn-in. The structure computations output files were carried out by the freely accessible STRUCTURE HARVESTER [72] to calculate similarity coefficients between the replicate runs and to plot the mean logarithmic likelihood of K values (the means of the estimated log posterior probability of the data over the replicate runs for each K value). All populations were divided into two groups (cultivated and wild) and analysis of molecular variance (AMOVA) [73] was conducted by ARLE-QUIN [62] to quantify genetic differentiation at different hierarchical levels. ‘‘Frequency- down-weighted marker values’’ (DW) [74] quantified by the amount of particular AFLP markers in the total dataset were calculated by AFLPdat [75].
Results
CpDNA sequence data
Total 21 different cpDNA haplotypes (A-U) were identified among the 364 individuals from 27 populations ofS. ningpoensis. A total of 26 polymorphic sites were detected across the two
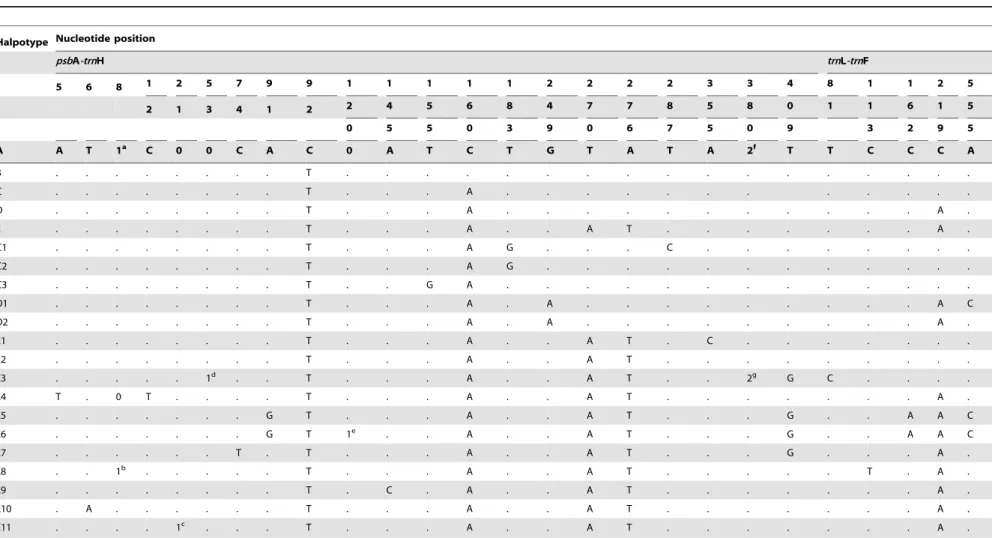
chloroplast regions (Table 2); 21 were single-site mutations, four were length polymorphisms (4 bp, 9 bp, 7 bp and 2 bp, respec-tively) and one was an inversion (22 bp). Considering that sequencing poly-N regions could easily cause homoplasies due to polymerase error, length variations in mononucleotide repeats (poly A or T stretches) were not treated as polymorphisms. The trnH-psbA region (21 polymorphic sites detected in 466 aligned positions; 4.5%) was more variable than thetrnL-trnF region (5 polymorphic sites detected in 811 aligned positions; 0.62%). The combined cpDNA sequences of S. ningpoensis varied in length from 1255 to 1268 bp, with a consensus length of 1277 bp after alignment. When the two fragments were combined, 2.0% of all sites (26/1277) were polymorphic. Both Tajima’s test (psbA-trnH: D=20.42908,P.0.10;trnL-trnF:D= 0.03414,P.0.10) and Fu & Li’s test (psbA-trnH:D* = 1.26305,P.0.10;F* = 0.68518,P. 0.10; trnL-trnF: D* = 1.01550, P.0.10; F* = 0.80528, P.0.10) indicated no significant deviation from neutrality for the two regions. The combined sequences of the spacers conformed to the expectation of neutrality as well (D=20.33903, P.0.10; D* = 1.51081, 0.10.P.0.05;F* = 0.87503,P.0.10). Sequences of the eighteen psbA-trnH and six trnL-trnF haplotypes are available in GenBank database (GenBank accession num-bers:KJ194143-KJ194166).
Haplotype diversity and within-population diversity declined under anthropogenic influence during the course of cultivation (Table 3). Wild populations contained all haplotypes, whereas cultivated populations only had three haplotypes (A, B and E). Moreover, in wild S. ningpoensis, eleven out of fourteen populations (78.6%) were polymorphic for haplotypes. In contrast, every cultivated population was fixed for a single haplotype. Wild populations had much higher estimates of haplotype diversity (hT= 0.919), the within-population component of diversity
(hS= 0.444) and nucleotide diversity (pT= 0.00301) than do cultivated populations (hT= 0.399 hS= 0, pT= 0.00076). In wild S. ningpoensis, haplotype diversity varied: populations LSW, TM2W had the highest haplotype diversity whereas populations TWW, PTW, THW from Zhejiang were each fixed for a single haplotype (Figure 1C). An AMOVA indicated that 41.02% of the total genetic variation occurred between cultivated and wild groups (Table 4), which is consistent with the high observed genetic differentiation (FST= 0.71988) between cultivated and wild
groups. And in cultivatedS. ningpoensisall genetic variation was among populations, but in the wild populations, more variation occurred within populations (58.54%) than among wild popula-tions (41.46%).
Table 2.Chloroplast DNA sequence polymorphisms detected in two intergenic spacer (IGS) regions ofScrophularia ningpoensisidentifying 21 haplotypes (A-E11).
Halpotype Nucleotide position
psbA-trnH trnL-trnF
5 6 8 1 2 5 7 9 9 1 1 1 1 1 2 2 2 2 3 3 4 8 1 1 2 5
2 1 3 4 1 2 2 4 5 6 8 4 7 7 8 5 8 0 1 1 6 1 5
0 5 5 0 3 9 0 6 7 5 0 9 3 2 9 5
A A T 1a C 0 0 C A C 0 A T C T G T A T A 2f T T C C C A
B . . . T . . . .
C . . . T . . . A . . . .
D . . . T . . . A . . . A .
E . . . T . . . A . . A T . . . A .
C1 . . . T . . . A G . . . C . . . .
C2 . . . T . . . A G . . . .
C3 . . . T . . G A . . . .
D1 . . . T . . . A . A . . . A C
D2 . . . T . . . A . A . . . A .
E1 . . . T . . . A . . A T . C . . . .
E2 . . . T . . . A . . A T . . . .
E3 . . . 1d . . T . . . A . . A T . . 2g G C . . . .
E4 T . 0 T . . . . T . . . A . . A T . . . A .
E5 . . . G T . . . A . . A T . . . G . . A A C
E6 . . . G T 1e . . A . . A T . . . G . . A A C
E7 . . . T . T . . . A . . A T . . . G . . . A .
E8 . . 1b . . . . . T . . . A . . A T . . . . . T . A .
E9 . . . T . C . A . . A T . . . A .
E10 . A . . . T . . . A . . A T . . . A .
E11 . . . . 1c . . . T . . . A . . A T . . . . . . . A .
All sequences are compared to the reference haplotype H1. Numbers ‘0/1’ in the sequences indicate absence/presence of four length polymorphisms, and ‘2’ presence of an inversion, whereby superscripts identify corresponding character states. Note that poly-A or poly-T stretches were excluded from analyses.
a: AAGC; b: AATC; c:TTTTTATTA; d:AATTTTA; e: AT;
f: CCTCTTGATAGAACAAGAAAAA; g:TTTTTCTTGTTCTATCAAGAGG.
doi:10.1371/journal.pone.0105064.t002
Domesticatio
n
of
Scrophularia
ningpoen
sis
PLOS
ONE
|
www.ploson
e.org
6
August
2014
|
Volume
9
|
Issue
8
|
position linked with haplotype C and D to form one clade, while the majority of rare haplotypes forms a ‘‘star’’ shape dominated by haplotype E. The geographic distribution and haplotype frequen-cies within populations are shown in Figure 1C. The most frequent haplotypes (A, B and E) were shared by both wild and cultivated groups, while other remaining haplotypes were found only in wild populations (Figure 1C). The most common and widest geographically distributed haplotype in cultivated popula-tions was A which was unique to the wild population LSW located in Lenshui County in northeastern Jiangxi Province. In wild populations, there was no clear geographical pattern of within-population diversity (Figure 1C). Moreover, U test (Nst/Gst) indicated no phylogeographic structure in wild S. ningpoensis (NST= 0.446, GST= 0.534, U =21.57, P.0.05).
AFLP data
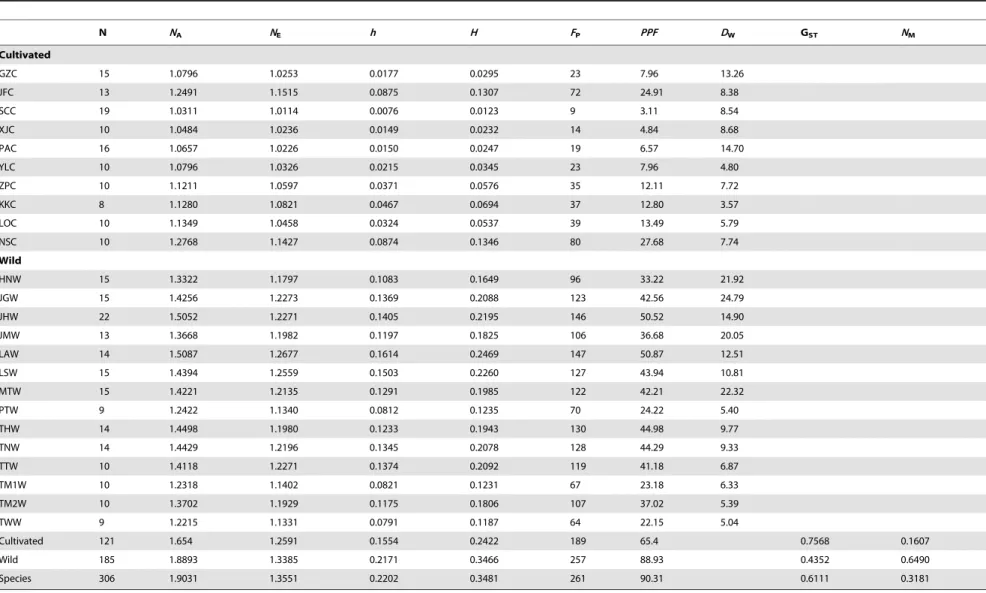
After exclusion of ambiguous or irreproducible fragments, 289 fragments were consistently scored for 24 populations (306 individuals) of which 261 fragments (90.31%) were polymorphic. The test for reproducibility yielded a mean error rate of 1.7% and confirmed the reproducibility of the AFLP fragments. Wild populations had much higher estimates of genetic diversity (h= 0.0791–0.1614) than did cultivated populations (h= 0.0076– 0.0875) (Table 5). In wild S. ningpoensis, the percentage of polymorphic fragments varied from 22.15% in population TWW to 50.87% in population LAW; in cultivatedS. ningpoensis, the percentage of polymorphic fragments varied from 3.11% in population SCC to 27.68% in population NSC (Table 5).
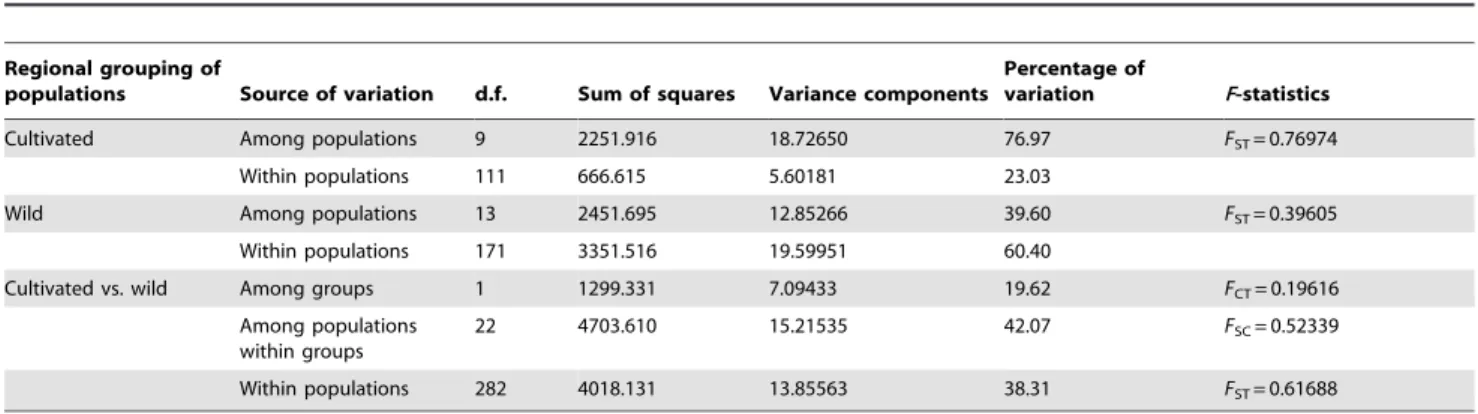
The variation between cultivated and wild groups accounted for 19.62% of the overall genetic variation (Table 6). In the cultivated
group, most variation (76.97%) existed in among-population with only 23.03% due to the within-population (Table 6). But the variation distribution in the wild group was opposite that most variation (60.40%) existed in within-population with only 39.60% due to the among-population (Table 6).
Principal coordinate analysis also showed a clear differentiation between cultivated and wildS. ningpoensis. All populations were grouped into three main clusters (Figure 2): cluster I included most wild populations; cluster II included most cultivated populations and two wild populations LSW & HNW; and cluster III included three cultivated populations: PAC, XJC and GZC. Populations PAC and XJC were from Zhejiang province. While GZC is in Fujian Province, local farmers indicated that it was directly introduced from Zhejiang cultivated populations. Genetic admix-ture analysis performed by STRUCTURE divided genetic variation into two gene pools (k = 2, Figure 3B): (1) Cultivated individuals, wild population HNW and part of wild population LSW; (2) Other wild populations. In STUCTURE analysis K values ranged from 2 to 14 and the one with the highest likelihood (k = 2) was chosen (Figure 4).
The Neighbor-Joining analysis identified two wild populations (HNW & LSW) that had a close relationship with cultivatedS. ningpoensis. The wild population HNW was sister to cultivated populations with a bootstrap value of 84%; LSW clustered with HNW and all cultivated populations supported by 100% bootstrap value (Figure 3A). Although three cultivated populations, PAC, XJC and GZC, grouped together and are distinct from otherS. ningpoensisin PCoA analysis, in the NJ tree they located in one clade with hundred percent support and were associated with other cultivated populations.
Table 3.Comparisons of genetic diversity and genetic structure between wild and cultivatedScrophularia ningpoensispopulations based on chloroplast DNA sequences.
Parameter wild cultivated
Number of haplotype 21 3
haplotype diversity (hT) 0.919 0.399
Within-population diversity(hS) 0.444 0
Nucleotide diversity(pT), 0.00301 0.00076
doi:10.1371/journal.pone.0105064.t003
Table 4.Hierarchical analysis of molecular variance for 28 populations ofScrophularia ningpoensisbased on chloroplast DNA sequences.
Regional grouping
of populations Source of variation d.f. Sum of squares Variance components
Percentage of
variation F-statistics(P)
Cultivated Among populations 12 79.731 0.50613 100 FST= 1(,0.001)
Within populations 158 0 0 0
Wild Among populations 13 156.171 0.79368 41.46 FST= 0.41462(,0.001)
Within populations 179 200.576 1.12053 58.54
Cultivated vs. wild Among groups 1 167.858 0.87163 41.02 FCT= 0.41023(,0.001)
Among populations within groups
25 235.902 0.65791 30.96 FSC= 0.52503(,0.001)
Within populations 337 200.576 0.59518 28.01 FST= 0.71988(,0.001)
Table 5.Genetic diversity in 24 populations ofS. ningpoensisbased on AFLP.
N NA NE h H FP PPF DW GST NM
Cultivated
GZC 15 1.0796 1.0253 0.0177 0.0295 23 7.96 13.26
JFC 13 1.2491 1.1515 0.0875 0.1307 72 24.91 8.38
SCC 19 1.0311 1.0114 0.0076 0.0123 9 3.11 8.54
XJC 10 1.0484 1.0236 0.0149 0.0232 14 4.84 8.68
PAC 16 1.0657 1.0226 0.0150 0.0247 19 6.57 14.70
YLC 10 1.0796 1.0326 0.0215 0.0345 23 7.96 4.80
ZPC 10 1.1211 1.0597 0.0371 0.0576 35 12.11 7.72
KKC 8 1.1280 1.0821 0.0467 0.0694 37 12.80 3.57
LOC 10 1.1349 1.0458 0.0324 0.0537 39 13.49 5.79
NSC 10 1.2768 1.1427 0.0874 0.1346 80 27.68 7.74
Wild
HNW 15 1.3322 1.1797 0.1083 0.1649 96 33.22 21.92
JGW 15 1.4256 1.2273 0.1369 0.2088 123 42.56 24.79
JHW 22 1.5052 1.2271 0.1405 0.2195 146 50.52 14.90
JMW 13 1.3668 1.1982 0.1197 0.1825 106 36.68 20.05
LAW 14 1.5087 1.2677 0.1614 0.2469 147 50.87 12.51
LSW 15 1.4394 1.2559 0.1503 0.2260 127 43.94 10.81
MTW 15 1.4221 1.2135 0.1291 0.1985 122 42.21 22.32
PTW 9 1.2422 1.1340 0.0812 0.1235 70 24.22 5.40
THW 14 1.4498 1.1980 0.1233 0.1943 130 44.98 9.77
TNW 14 1.4429 1.2196 0.1345 0.2078 128 44.29 9.33
TTW 10 1.4118 1.2271 0.1374 0.2092 119 41.18 6.87
TM1W 10 1.2318 1.1402 0.0821 0.1231 67 23.18 6.33
TM2W 10 1.3702 1.1929 0.1175 0.1806 107 37.02 5.39
TWW 9 1.2215 1.1331 0.0791 0.1187 64 22.15 5.04
Cultivated 121 1.654 1.2591 0.1554 0.2422 189 65.4 0.7568 0.1607
Wild 185 1.8893 1.3385 0.2171 0.3466 257 88.93 0.4352 0.6490
Species 306 1.9031 1.3551 0.2202 0.3481 261 90.31 0.6111 0.3181
NA:Observed number of alleles;NE:Effective number of alleles [Kimura and Crow (1964)];h:Nei’s (1973) gene diversity;H:Shannon’s Information index [Lewontin (1972)];NM:estimate of gene flow fromGSTorGCS. E.g., NM= 0.5(12GST)/GST;N:the number of individuals in population;FP:the number of polymorphic fragments;PPF:the percentage of polymorphic fragments;DW:the frequency down-weighed marker value.
doi:10.1371/journal.pone.0105064.t005
Domesticatio
n
of
Scrophularia
ningpoen
sis
PLOS
ONE
|
www.ploson
e.org
8
August
2014
|
Volume
9
|
Issue
8
|
Discussion
Change of genetic diversity under domestication
For many crop species the domestication process has left a signature in the pattern of genetic diversity as a result of founder effects, genetic bottlenecks and artificial selection [76]. Many crops show evidence of genome-wide reductions in variation [77,78,79]. In our study, the pattern of genetic diversity between cultivated and wild populations ofScrophularia ningpoensisis consistent with other domesticated crop species, even though the domestication history of S. ningpoensis is only one thousand years. Out of twenty-one cpDNA haplotypes in the species, only three haplo-types were detected in cultivated populations. Moreover, cultivat-ed populations had little within-population genetic polymorphisms (Table 3). The cpDNA nucleotide diversity (pT) and haplotype
diversity (hT) of cultivated populations were much less than that of
the wild group (Table 3). AFLP data also support these patterns
(Table 5). These results are consistence with many crop-relative systems of domestication [80,81] although the degree of decline in diversity of S. ningpoensis with such a short history of domestication is surprising. This medicinal plant has lost genetic diversity as a result of domestication which clearly shows that a species can have large genetic alterations even before there are significant changes in morphology, phenology or breeding system. Other species native to China, such as Corydalis yanhusuo (traditional Chinese medicine) [16],Metasequoia glyptostroboides [82],Malus pumila[83] andZizania latifolia[84] also revealed the same genetic pattern.
These large changes in genetic diversity are most likely the result of both founder effects and selection for medicinal quality, and importantly, the clonal mode of reproduction. The extent of the loss of genetic diversity depends in part on population size during domestication and time over which domestication occurred [77]. At the beginning of cultivation,S. ningpoensiswas gathered from Table 6.Hierarchical analysis of molecular variance for 24 populations ofS. ningpoensisbased on AFLP.
Regional grouping of
populations Source of variation d.f. Sum of squares Variance components
Percentage of
variation F-statistics
Cultivated Among populations 9 2251.916 18.72650 76.97 FST= 0.76974
Within populations 111 666.615 5.60181 23.03
Wild Among populations 13 2451.695 12.85266 39.60 FST= 0.39605
Within populations 171 3351.516 19.59951 60.40
Cultivated vs. wild Among groups 1 1299.331 7.09433 19.62 FCT= 0.19616
Among populations within groups
22 4703.610 15.21535 42.07 FSC= 0.52339
Within populations 282 4018.131 13.85563 38.31 FST= 0.61688
FST: genetic differences among populations;FCT: genetic differences among groups defined a priori;FSC: genetic differences among population within groups. doi:10.1371/journal.pone.0105064.t006
Figure 2. Principal coordinate analysis (PCoA) of 306 individuals from 24 populations ofS. ningpoensisbased on the Euclidean distance generated from AFLP data.To simplify comparison, cultivatedS. ningpoensisare indicated by triangles, while wildS. ningpoensisare indicated by circles.
the wild. Most likely a limited number of individuals from the wild formed the founding populations of cultivatedS. ningpoensis, the founders containing only a sample of the genetic diversity of wild populations. Although the domestication history ofS. ningpoensis is short, under cultivation it is propagated vegetatively from rhizome and flowers are removed. These practices restrict gene flow between wild and cultivatedS. ningpoensispopulations and among individuals within cultivated populations. Moreover, farmers select large and healthy rhizomes to establish new populations. Such selection coupled with clonally propagation could quickly fix alleles carried by selected individuals. The increasedFSTvalues (Table 4, Table 6) for cultivated populations
(cpDNA:FST= 1; AFLP:FST= 0.76974) relative to wild
popula-tions (cpDNA: FST= 0.41462; AFLP:FST= 0.39605) reflect the
different modes of reproduction in cultivated (clonally propagated) and wild (sexually propagated) populations.
Origin of cultivatedScrophularia ningpoensis
Locating the geographical site of domestication and assessing the demographic consequences of wild-domesticated species evolution can help to design strategies of use and management of genetic resources [85]. In the current study, three cpDNA haplotypes (A, B and E) found within cultivated populations are scattered on the haplotype network and shared with different wild population gene pools. But the most cultivated populations harbored haplotype A, which is only found in the wild population LSW. Two other haplotypes B & E, distributed in two cultivated populations (YLC and SCC) and one cultivated population (NSC) respectively, are shared with three and four different wild populations respectively. It is interesting that wild populations harboring haplotype B or E didn’t have haplotype A. This cpDNA pattern indicates that the wild population LSW in Jiangxi Province contributed substantially to the origin of cultivatedS. ningpoensis, while other six wild populations (JGW, LAW, JHW, TNW,
Figure 3. Neighbor-Joining and STRUCTURE analyses of the AFLP data.(A) Neighbor-Joining analysis of the AFLP data for all individuals of
S.ningpoensisbased on Nei’s (1979) genetic distances withS. buergerianaas the outgroup. (B) Result of the model from clustering (K = 2) of all wild individuals and 10 cultivated individuals ofS. ningpoensisusing STRUCTURE based on the AFLP data set.
doi:10.1371/journal.pone.0105064.g003
Domestication ofScrophularia ningpoensis
TM2W, PTW) located in geographically separated places were only involved in origin of three cultivated populations. Moreover, the wild population JGW harboring both haplotype B and E is also in Jiangxi Province as the wild population LSW. Thus, the Jiangxi region is a critical site for the origin of cultivatedS. ningpoensis.
However, results of AFLP analysis suggested that the origin of cultivated populations is more restricted to only two wild populations, HNW and LSW. In the neighbor-Joining analysis (Figure 3), HNW and LSW clustered with other cultivated populations by 100% bootstrap value and the STRUCTURE analysis was consistent, placing the two wild populations, HNW and LSW, into the same gene pool as the cultivated individuals. In principal coordinate analysis (Figure 2), wild population HNW and LSW grouped with majority of cultivated populations in one cluster. Thus, combined with cpDNA data, we infer that wild populations of the Jiangxi region may have played a major role in the origin of cultivatedS. ningpoensis. Although three cultivated populations, PAC, XJC and GZC, grouped to another cluster in PCoA analysis (Figure 2), they still located in the cultivated clade identified in the Neighbor-Joining analysis (Figure 3A) and were assigned to the same gene pool as the other cultivated S.
ningpoensis (Figure 3B). The wild population LSW located in eastern Jiangxi and HNW population is on the border between Hunan and Jiangxi, so AFLP data strongly supported that Jiangxi area of Eastern China is the geographic origin of cultivatedS. ningpoensis.
Considering the discordance between chloroplast and nuclear markers,the origin of cultivatedS. ningpoensismust be interpreted with caution. Firstly, patterns of cpDNA indicated broader geographic origin of cultivated S. ningpoensis compared with AFLP markers, which can be explained by the characteristics of chloroplast genome evolution. CpDNA evolves slowly and is uniparentally inherited in plants, so it usually only represents the maternal genome and often has low levels of variation making cpDNA less informative for intraspecific studies [86]. Nuclear genomic AFLP markers provided much higher resolution both because of rapid evolution and many independent markers, thus providing a more nuanced interpretation of the origin of cultivated S. ningpoensis. Revealed by AFLP markers, cultivated populations originated from Jiangxi area where wild populations were involved in the event of origin. Secondly, if AFLP data has revealed the more resolution, these two wild populations which were involved
Figure 4. The estimated mean logarithmic likelihood of K values ranging from 2 to 14 with 10 replicates for each K calculated using the R-script Structure–sum.
in the origin of cultivation, HNW & LSW, should harbor all cpDNA haplotypes (A, B and E) found in cultivated populations. But the wild population HNW didn’t share any cpDNA haplotype with cultivated populations; only the native population LSW harbored haplotype A. These data suggest that this entire region of China may have served as the source of medicinalS. ningpoensis rather than a specific population. The ancestors of cultivated populations YLC, SCC and NSC were probably introduced from wild population similar to the extant HNW; harvesting and cultivation may, by chance, collected all individuals which had the same cpDNA haplotypes with cultivated populations. In addition, the nearest wild population to HNW is JGW, which shared two cpDNA haplotypes, B&E, with cultivated populations. But the very high value of Dw in HNW (21.92) and JGW (24.79) suggests a long-term history of isolation [74]. The long term use, and most likely, trading of rhizomes ofS. ningpoensislead to a complicated domestication history for this species.
Crop improvement and sustainable cultivation ofS. ningpoensis
The therapeutic efficacy of a medicinal plant often varies by geographical location among the populations of a species [22]. CultivatedS. ningpoensisfrom Zhejiang Province is recognized to have the best medicinal quality [87]. Our previous study on HPLC fingerprints of S. ningpoensis has also revealed that materials cultivated in Zhejiang Province produce the highest content of bioactive compounds compared to other cultivated populations [45]. In this study, analysis of AFLP markers group cultivated populations from Zhejiang into one cluster which is divergent from other cultivated populations and other wild populations (Figure 2). Moreover, cultivated populations from Zhejiang gather in one clade associated with other cultivated populations in NJ tree (Figure 3A). This evidence strongly supports the genetic distinct nature of cultivated S. ningpoensis from Zhejiang (Figure 2). Under strong artificial selection, cultivated S. ningpoensis with high pharmaceutical quality has genetically diverged from wild populations. It is generally believed that different medical effects due to secondary compounds are caused by various environmental conditions and habitats where the medicinal plants are grown and harvested [88]. But our study combined with previous phyto-chemical analysis indicates that under artificial selection, cultivated S. ningpoensis from Zhejiang has become genetically differenti-ated from other cultivdifferenti-ated populations and chemical diversity may also be influenced by genetic factors. Thus, this result can help design strategies of crop improvement that consider both genetic and ecological factors for the cultivation of medicinal plants.
Genetic diversity underlies the plasticity of many secondary metabolites [89] and results in phytochemical diversity on which the pharmaceutical quality of medicinal plants relies [90]. Study onS. ningpoensisby HPLC and ISSR fingerprinting have already revealed a strong association between chemical and genetic variation of S. ningpoensis [45] suggesting that higher genetic diversity can account for higher phytochemical diversity that is critical for the pharmaceutical quality. This study that compares cultivated populations to the range of extant wild populations indicates that wild S. nignpoensis has much higher genetic diversity than does the cultivated plant (Figure 1C, Table 5). These wild populations represent an infrequently used source of genetic diversity that is conspecific with the cultivated gene pool. Cultivated and wild plants generally do not exhibit reproductive isolation [79]. Hence, wild resources can be utilized to improve the cultivatedS. ningpoensisby introducing genetic diversity by sexual reproduction and then selection for desired traits.
The results of this study can be used to select the most diverse natural populations for such a breeding program. Using the AFLP data, the values of Nei’s [67] gene diversity (h) of most wild S. ningpoensis were higher than 0.1 (Table 5), except for PTW, TWW and TM1W. For chloroplast data, three wild populations, TM2W, LSW and JHW, harbored more cpDNA haplotypes than others (Figure 1C). Thus, TM2W, LSW and JHW populations have high genetic diversity for both the cpDNA and nuclear genomes. These native populations have the greatest reservoir of genetic diversity and could be used for further improvement of cultivated S. ningpoensis to ensure that it provides an adequate supply of the medicinal plant and the quality of the plant is enhanced. Furthermore, the utilization of wild populations with appropriate guidelines for collection and for regulating manage-ment could be an efficient way to find, conserve and deploy desirable agronomic traits which would be beneficial for Radix Scrophulariae cultivation.
Acknowledgments
The authors would like to give special thanks to David Bufford, Joongku Lee, Tetsuo Ohi-Toma, Mingshui Zhao, Shuqing Sun for assistance in sample collection; David Bufford for helpful comments on manuscript; Pu Huang in Schaal lab of Washington University in St. Louis for assistance in DNA sequencing experiment.
Author Contributions
Conceived and designed the experiments: CXF BAS. Performed the experiments: CC PL. Analyzed the data: CC RHW. Wrote the paper: CC CXF BAS.
References
1. Zeder MA (2006) Central questions in the domestication of plants and animals. Evolutionary Anthropology 15: 105–117.
2. Lambert J, Srivastava J, Vietmeyer N (1997) Medicinal plants: Rescuing a glo-bal heritage (vol. 355). Washington D. C.: The World Bank. 8–15 p. 3. WHO IUCN, WWF (1993) Guidelines on the Conservation of Medicinal Plants.
Gland: The International Union for Conservation of Nature and Natural Resources. 21–25 p.
4. Vines G (2004) Herbal harvests with a future: towards sustainable sources for medicinal plants. Salisbury: Plantlife International. 1–10 p.
5. Canter PH, Thomas H, Ernst E (2005) Bringing medicinal plants into cultivation: opportunities and challenges for biotechnology. Trends Biotechnol 23: 180–185.
6. Uniyal RC, Uniyal MR, Jain P, TRAFFIC I (2000) Cultivation of medicinal plants in India: a reference book. New Delhi: TRAFFIC-India. 20 p. 7. Schippmann U, Leaman DJ, Cunningham AB (2002) Impact of cultivation and
gathering of medicinal plants on biodiversity: global trends and issues. Rome: Food and Agriculture Organization of the United Nations.
8. Palevitch D (1991) Agronomy applied to medicinal plant conservation. In: Akerele OH, editor. Conservation of medicinal plants. Cambridge: Cambridge University Press. pp. 167–178.
9. Berna´th J (1999) Biological and economical aspects of utilization and exploitation of wild growing medicinal plants in Middle-and South Europe. Acta Hort (ISHS) 500:31–42.
10. Lange D, Schippmann U (1997) Trade survey of medicinal plants in Germany: a contribution to international plant species conservation. Bonn: German Federal Agency for Nature Conservation.
11. Pei-gen X (1991) The Chinese approach to medicinal plants: Their utilization and conservation. In: Akerele OH, editor. Conservation of medicinal plants. Cambridge: Cambridge University Press. pp. 305–313.
12. He S, Sheng N (1997) Utilization and conservation of medicinal plants in China: Medicinal plants for forest conservation and health care. Rome: Food and Agriculture Organization of the United Nation. 109–115 p.
13. Gao W, Jia W, Gao X, Wang R, Xiao P (2005) In vitro culture and cultivation of Chinese medicinal plants for industrial utilization and genetic resource conservation. Genetic Resour 3: 116.
14. EI-Domyati FM, Younis RA, Edris S, Mansour A, Sabir J, et al. (2011) Molecular markers associated with genetic diversity of some medicinal plants in Sinai. Journal of Medicinal Plants Research 5: 1918–1929.
Domestication ofScrophularia ningpoensis
15. Yuan QJ, Zhang ZY, Hu J, Guo LP, Shao AJ, et al. (2010) Impacts of recent cultivation on genetic diversity pattern of a medicinal plant, Scutellaria baicalensis(Lamiaceae). BMC Genet 11: 29.
16. Qiu YX, Zong M, Yao Y, Chen BL, Zhou XL, et al. (2009) Genetic variation in wild and cultivated rhizoma corydalis revealed by ISSRs markers. Planta med 75: 94–98.
17. Shi W, Yang CF, Chen JM, Guo YH (2008) Genetic variation among wild and cultivated populations of the Chinese medicinal plant Coptis chinensis (Ranunculaceae). Plant Biol 10: 485–491.
18. He J, Chen L, Si Y, Huang B, Ban X, et al. (2009) Population structure and genetic diversity distribution in wild and cultivated populations of the traditional Chinese medicinal plantMagnolia officinalis subsp. biloba (Magnoliaceae). Genetica 135: 233–243.
19. Zhang DQ, Gao LM, Yang YP (2010) Genetic diversity and structure of a traditional Chinese medicinal plant species,Fritillaria cirrhosa(Liliaceae) in southwest China and implications for its conservation. Biochem Syst Ecol 38: 236–242.
20. Hartmann T (2007) From waste products to ecochemicals: Fifty years research of plant secondary metabolism. Phytochemistry 68: 2831–2846.
21. Fernie AR (2007) The future of metabolic phytochemistry: larger numbers of metabolites, higher resolution, greater understanding. Phytochemistry 68: 2861– 2880.
22. Woo Y, Kim H, Cho J, Chung H (1999) Discrimination of herbal medicines according to geographical origin with near infrared reflectance spectroscopy and pattern recognition techniques. J Pharm Biomed Anal 21: 407–413. 23. Bagdonaite´ E, Ma´rtonfi P, Repcˇa´k M, Labokas J (2012) Variation in
concentrations of major bioactive compounds in Hypericum perforatum L. from Lithuania. Ind Crops Prod 35: 302–308.
24. Cirak C, Radusiene J, Stanius Z, Camas N, Caliskan O, et al. (2012) Secondary metabolites of Hypericum orientaleL. growing in Turkey: variation among populations and plant parts. Acta Physiol Plant 34: 1313–1320.
25. Singh SK, Katoch R, Kapila RK (2013) Chemotypic variation for essential oils inValeriana jatamansiJones populations from Himachal Pradesh. Journal of Essential Oil Research 25: 154–159.
26. Verma RS, Chauhan A, Padalia RC, Jat SK, Thul S, et al. (2013) Phytochemical Diversity of Murraya koenigii (L.) Spreng. from Western Himalaya. Chem Biodivers 10: 628–641.
27. Li Y, Sun S, Zhou Q, Qin Z, Tao J, et al. (2004) Identification of American ginseng from different regions using FT-IR and two-dimensional correlation IR spectroscopy. Vib Spectrosc 36: 227–232.
28. Milligan BG, Leebens-Mack J, Strand AE (1994) Conservation genetics: beyond the maintenance of marker diversity. Mol Ecol 3: 423–435.
29. Francisco-Ortega J, Santos-Guerra A, Kim S, Crawford DJ (2000) Plant genetic diversity in the Canary Islands: a conservation perspective. Am J Bot 87: 909– 919.
30. Hong D, Yang H, Jin C, FIscher A M, et al. (1994) Flora of China. China & US: Science Press & Missouri Botanical Garden Press. 13 p.
31. Kajimoto T, Hidaka M, Shoyama K, Nohara T (1989) Iridoids from Scrophularia ningpoensis. Phytochemistry 28: 2701–2704.
32. Sagare AP, Kuo CL, Chueh FS, Tsay HS (2001) De novo regeneration of Scrophularia yoshimuraeYamazaki (Scrophulariaceae) and quantitative analysis of harpagoside, an iridoid glucoside, formed in aerial and underground parts of in vitro propagated and wild plants by HPLC. Biol Pharm Bull 24: 1311–1315. 33. Yen KY (1992) The Illustrated Chinese Materia Medica Crude and Prepared.
Taiwan: SMC Publishing Inc Press. 64 p.
34. Huang S (1982) Shen Nong Ben Cao Jing (The Divine Farmer’s Materia Medica). Beijing: Traditional Chinese Medicine Ancient Books Press. 35. Liu L, Hudgins WR, Shack S, Yin MQ, Samid D (1995) Cinnamic acid: a
natural product with potential use in cancer intervention. Int J Cancer 62: 345– 350.
36. Garcia D, Fernandez A, Saenz T, Ahumada C (1996) Antinflammatory effects of different extracts and harpagoside isolated from Scrophularia frutescens L. Farmaco 51: 443–446.
37. de Santos Galı´ndez J, Dı´az Lanza A, Fernandez Matellano L (2002) Biologically active substances from the genusScrophularia. Pharm Biol 40: 45–59. 38. Dia´z AM, Abad MJ, Ferna´ndez L, Silva´n AM, De Santos J, et al. (2004)
Phenylpropanoid glycosides from Scrophularia scorodonia: In vitro anti-inflammatory activity. Life Sci 74: 2515–2526.
39. Miyazawa M, Okuno Y, Nakamura S, Kameoka H (1998) Suppression of SOS-inducing activity of chemical mutagens by cinnamic acid derivatives from Scrophulia ningpoensisin the Salmonella typhimurium TA1535/pSK1002 umu test. J Agric Food Chem 46: 904–910.
40. National Pharmacopoeia Committee (2010) Chinese pharmacopoeia (Part I). Beijing: China Medical Science Press. 332 p.
41. Su S (1975) Tu Jing Ben Cao. Beijing: The Science Press.
42. Ran MX, Zhou HQ (1999) Guidelines on Modern Cultivation, Breeding and Processing of Chinese Materia Medica. Beijing: Traditional Chinese Medicine Press.
43. Obeso JR (2002) The costs of reproduction in plants. New Phytol 155: 321–348. 44. McKey D, Elias M, Pujol B, Duputie´ A (2010) The evolutionary ecology of
clonally propagated domesticated plants. New Phytol 186: 318–332. 45. Yang ST, Chen C, Zhao YP, Xi W, Zhou XL, et al. (2011) Association between
Chemical and Genetic Variation of Wild and Cultivated Populations of Scrophularia ningpoensisHemsl. Planta Med 77: 865–871.
46. Xu CB (2007) The Textual Research of Common Chinese Materia Medica. Beijing: People’s Medical Publishing Press.
47. Doyle JJ (1987) A rapid DNA isolation procedure for small quantities of fresh leaf tissue. Phytochemical bulletin 19: 11–15.
48. Doyle J (1991) DNA protocols for plants-CTAB total DNA isolation. Molecular techniques in taxonomy: 283–293.
49. Taberlet P, Gielly L, Pautou G, Bouvet J (1991) Universal primers for amplification of three non-coding regions of chloroplast DNA. Plant Mol Biol 17: 1105–1109.
50. Sang T, Crawford DJ, Stuessy TF (1997) Chloroplast DNA phylogeny, reticulate evolution, and biogeography ofPaeonia(Paeoniaceae). Am J Bot 84: 1120. 51. Thompson JD, Higgins DG, Gibson TJ (1994) Clustal W: improving the
sensitivity of progressive multiple sequence alignment through sequence weighting, position-specific gap penalties and weight matrix choice. Nucleic Acids Res 22: 4673–4680.
52. Nei M (1987) Molecular evolutionary genetics. New York: Oxford University Press.
53. Rozas J, Rozas R (1999) DnaSP version 3: an integrated program for molecular population genetics and molecular evolution analysis. Bioinformatics 15: 174– 175.
54. Clement M, Posada D, Crandall KA (2000) TCS: a computer program to estimate gene genealogies. Mol Ecol 9: 1657–1659.
55. Nylander JAA (2004) MrModeltest v2. Program distributed by the author. Evolutionary Biology Centre, Uppsala University.
56. Ronquist F, Huelsenbeck JP (2003) MrBayes 3: Bayesian phylogenetic inference under mixed models. Bioinformatics 19: 1572–1574.
57. Felsenstein J (1973) Maximum likelihood and minimum steps methods for estimating evolutionary trees from data on discrete characters. Systematic Zoology 22: 240–249.
58. Stamatakis A, Hoover P, Rougemont J (2008) A rapid bootstrap algorithm for the RAxML web servers. Systematic biology 57: 758–771.
59. Miller MA, Pfeiffer W, Schwartz T (2010) Creating the CIPRES Science Gateway for inference of large phylogenetic trees. Proceedings of the Gateway Computing Environments Workshop (GCE). New Orleans, LA: IEEE. 60. Swofford DL (2003) PAUP*: phylogenetic analysis using parsimony (* and other
methods), version 4.0 b10. Sunderland: Sinauer Associates.
61. Pons O, Petit RJ (1996) Measuring and testing genetic differentiation with ordered versus unordered alleles. Genetics 144: 1237–1245.
62. Excoffier L, Laval G, Schneider S (2005) Arlequin (version 3.0): an integrated software package for population genetics data analysis. Evol Bioinform Online 1: 47.
63. Tajima F (1989) Statistical-method for testing the neutral mutation hypothesis by DNA polymorphism. Genetics 123: 585–595.
64. Fu YX, Li WH (1993) Statistical tests of neutrality of mutations. Genetics 133: 693–709.
65. Rozas J, Sa´nchez-DelBarrio JC, Messeguer X, Rozas R (2003) DnaSP, DNA polymorphism analyses by the coalescent and other methods. Bioinformatics 19: 2496–2497.
66. Vos P, Hogers R, Bleeker M, Reijans M, van de Lee T, et al. (1995) AFLP: a new technique for DNA fingerprinting. Nucleic Acids Res 23: 4407–4414. 67. Nei M (1973) Analysis of gene diversity in subdivided populations. Proc Natl
Acad Sci U S A 70: 3321–3323.
68. Yeh FC, Yang R, Boyle TB, Ye ZH, Mao JX (1997) Popgene, the user-friendly shareware for population genetic analysis. Molecular biology and biotechnology centre, University of Alberta, Canada.
69. Felsenstein J (1993) Phylip: phylogenetic inference package, version 3.5 c. Department of Genetics, University of Washington, USA.
70. Pritchard JK, Stephens M, Donnelly P (2000) Inference of population structure using multilocus genotype data. Genetics 155: 945–959.
71. Falush D, Stephens M, Pritchard JK (2007) Inference of population structure using multilocus genotype data: dominant markers and null alleles. Mol Ecol Notes 7: 574–578.
72. Earl DA (2012) Structure harvester: a website and program for visualizing Structure output and implementing the evanno method. Conserv Genet Resour 4: 359–361.
73. Excoffier L (1995) Amova: Analysis of molecular variance (version 1.55). University of Geneva, Switzerland.
74. Scho¨nswetter P, Tribsch A (2005) Vicariance and dispersal in the alpine perennialBupleurum stellatumL. (Apiaceae). Taxon: 725–732.
75. Ehrich D (2006) AFLPdat: a collection of R functions for convenient handling of AFLP data. Mol Ecol Notes 6: 603–604.
76. Doebley JF, Gaut BS, Smith BD (2006) The molecular genetics of crop domestication. Cell 127: 1309–1321.
77. Eyre-Walker A, Gaut RL, Hilton H, Feldman DL, Gaut BS (1998) Investigation of the bottleneck leading to the domestication of maize. Proc Natl Acad Sci U S A 95: 4441–4446.
78. Londo JP, Chiang YC, Hung KH, Chiang TY, Schaal BA (2006) Phylogeography of Asian wild rice, Oryza rufipogon, reveals multiple independent domestications of cultivated rice,Oryza sativa. Proc Natl Acad Sci U S A 103: 9578–9583.
80. Olsen KM, Schaal BA (1999) Evidence on the origin of cassava: phylogeography ofManihot esculenta. Proc Natl Acad Sci U S A 96: 5586–5591.
81. Olsen KM, Schaal BA (2007) Insights on the evolution of a vegetatively propagated crop species. Mol Ecol 16: 2838–2840.
82. Li YY, Chen XY, Zhang X, Wu TY, Lu HP, et al. (2005) Genetic differences between wild and artificial populations of Metasequoia glyptostroboides: implications for species recovery. Conservation Biology 19(1): 224–231. 83. Zhang Q, Li J, Zhao Y, Korban S, Han Y (2012) Evaluation of genetic diversity
in Chinese wild apple species along with apple cultivars using SSR markers. Plant molecular biology reporter 30(3): 539–546. (PR 7/31)
84. Xu XW, Ke WD, Yu XP, Wen J, Ge S (2008) A preliminary study on population genetic structure and phylogeography of the wild and cultivated Zizania latifolia(Poaceae) based on Adh1a sequences. Theor Appl Genet 116:835–843.
85. Frankel OH (1995) The conservation of plant biodiversity. Cambridge: Cambridge University Press.
86. Wolfe KH, Li WH, Sharp PM (1987) Rates of nucleotide substitution vary greatly among plant mitochondrial, chloroplast, and nuclear DNAs. Proc Natl Acad Sci U S A 84: 9054–9058.
87. Wang JK, Wang JL (2007) History and genuine character of traditional Chinese medicine. Beijing: Science and Technology of China Medicine Press. 88. Zhang X, Han T, Zhang Q, Zhang H, Huang B, et al. (2009) Chemical
fingerprinting and hierarchical clustering analysis of Centella asiatica from different locations in China. Chromatographia 69: 51–57.
89. Hartmann T (2007) From waste products to ecochemicals: Fifty years research of plant secondary metabolism. Phytochemistry 68: 2831–2846.
90. Fernie AR (2007) The future of metabolic phytochemistry: larger numbers of metabolites, higher resolution, greater understanding. Phytochemistry 68: 2861– 2880.
Domestication ofScrophularia ningpoensis