Genetic Variations and Haplotype Diversity of the
UGT1
Gene Cluster in the Chinese Population
Jing Yang1,2, Lei Cai1,2, Haiyan Huang1,2, Bingya Liu1, Qiang Wu1,2*
1Key Laboratory of Systems Biomedicine (Ministry of Education), Center for Comparative Biomedicine, Institute of Systems Biomedicine, Shanghai Jiao Tong University, Shanghai, China,2State Key Laboratory of Oncogenes and Related Genes, Shanghai Cancer Institute, Renji Hospital, School of Medicine, Shanghai Jiao Tong University, Shanghai, China
Abstract
Vertebrates require tremendous molecular diversity to defend against numerous small hydrophobic chemicals. UDP-glucuronosyltransferases (UGTs) are a large family of detoxification enzymes that glucuronidate xenobiotics and
endobiotics, facilitating their excretion from the body. TheUGT1gene cluster contains a tandem array of variable first
exons, each preceded by a specific promoter, and a common set of downstream constant exons, similar to the genomic
organization of the protocadherin (Pcdh), immunoglobulin, and T-cell receptor gene clusters. To assist pharmacogenomics
studies in Chinese, we sequenced nine first exons, promoter and intronic regions, and five common exons of theUGT1gene
cluster in a population sample of 253 unrelated Chinese individuals. We identified 101 polymorphisms and found 15 novel SNPs. We then computed allele frequencies for each polymorphism and reconstructed their linkage disequilibrium (LD)
map. TheUGT1cluster can be divided into five linkage blocks: Block 9 (UGT1A9), Block 9/7/6 (UGT1A9,UGT1A7, andUGT1A6),
Block 5 (UGT1A5), Block 4/3 (UGT1A4andUGT1A3), and Block 39UTR. Furthermore, we inferred haplotypes and selected their
tagSNPs. Finally, comparing our data with those of three other populations of the HapMap project revealed ethnic
specificity of theUGT1genetic diversity in Chinese. These findings have important implications for future molecular genetic
studies of theUGT1gene cluster as well as for personalized medical therapies in Chinese.
Citation:Yang J, Cai L, Huang H, Liu B, Wu Q (2012) Genetic Variations and Haplotype Diversity of theUGT1Gene Cluster in the Chinese Population. PLoS
ONE 7(4): e33988. doi:10.1371/journal.pone.0033988
Editor:Sudhindra R. Gadagkar, Midwestern University, United States of America
ReceivedJune 14, 2011;AcceptedFebruary 24, 2012;PublishedApril 13, 2012
Copyright:ß2012 Yang et al. This is an open-access article distributed under the terms of the Creative Commons Attribution License, which permits
unrestricted use, distribution, and reproduction in any medium, provided the original author and source are credited.
Funding:This work was supported by grants 30970669 and 31171015 from the National Natural Science Foundation of China, 2009CB918701 from the Ministry
of Science and Technology of China, and 09PJ1405300 from the Science and Technology Commission of Shanghai Municipality. The funders had no role in study design, data collection and analysis, decision to publish, or preparation of the manuscript.
Competing Interests:A related patent with application number 201110359152.7 has been filed to the State Intellectual Property Office of China. This does not alter the authors’ adherence to all the PLoS ONE policies on sharing data and materials.
* E-mail: [email protected]
Introduction
The adaptive immune system, central nervous system (CNS), and chemical defense system in vertebrates require tremendous molecular diversity to defend against viruses and bacteria, to specify complex neuronal connectivity, and to remove numerous small hydrophobic chemicals from the body, respectively [1,2,3]. The vertebrate genomes generate the required molecular diversity in these systems through gene duplication, gene conversion and transposition, somatic mutation and DNA rearrangement, alter-native splicing, promoter usage, and polyadenylation, copy number variation, as well as single nucleotide polymorphism of the clustered immunoglobulin, Pcdh (PCDHA, MIM# 604966;
PCDHB, MIM# 604967; PCDHG, MIM#604968), and UGT1
genes [2,4,5,6,7,8,9]. These gene clusters are organized into variable and constant regions [4,10,11]. Each cluster contains a large number of highly-similar variable exons organized in a tandem array followed by a single set of downstream constant exons [4,10,11].
In the adaptive immune system, somatic mutation and DNA rearrangement of the immunoglobulin and T-cell receptor gene clusters play a critical role in generating vast molecular diversity required for defense against unlimited number of foreign antigens [4]. In the central nervous system, alternative promoter usage and
alternative splicing play an essential role in generating tremendous molecular diversity of neural cell adhesion Pcdh proteins [12,13]. These Pcdhs may specify diverse neuronal connectivity in the brain that is required to control complex human behavioral repertoire such as language, tool use, emotion, empathy, culture learning, and consciousness [2,10]. In addition, positive selection and gene conversion of clustered Pcdh genes also increase the diversity of Pcdh proteins [6,14]. Finally, species-specific gene duplications and exon mutations suggest that birth-and-death evolution plays an important role in the dynamic evolvement of the clusteredPcdhgenes [14].
substrates sit in a pocket in the N-terminal Rossmann domain encoding by variable exons, and the donor substrate UDPGA lies in the C-terminal Rossmann domain encoded by the constant exons [7,21,22,23]. The acceptor binding pocket is surrounded by four hypervariable regions consisting of very diverse residues [7]. UGT1 enzymes catalyze the transfer of the glucuronic acid moiety from UDPGA to hydrophobic acceptor substrates to increase their hydrophilicity. Thus, glucuronidation by UGT1 enzymes is an important pathway for detoxification of environmental toxins, biotransformation of therapeutic drugs, and metabolism of endobiotics.
In addition to the UGT1 diversity generated by alternative splicing, UGT1 genetic diversity, such as single nucleotide polymorphisms (SNPs), also affects their enzymatic activities [15]. SomeUGT1A1SNPs have been associated with hyperbilir-ubinemic diseases such as Crigler-Najjar syndrome types I and II (CNI, MIM #218800 and CNII, MIM #606785), Gilbert syndrome (GS, MIM#143500), as well as severe side effects of medicines, such as diarrhea and neutropenia of the colorectal cancer drug irinotecan [15,24,25,26]. Thus, theUGT1SNPs may be used as biomarkers for assessing individualized disease risk and personalized medical therapy. However, owning to the overlap-ping substrate specificity and the differential linkage disequilibrium between SNPs, it is challenging to identify functionalUGT1SNPs. Because haplotypes have greater power and are more appropriate to be used for genotype-phenotype correlations than individual SNPs [27], it is necessary to perform haplotype analyses of the entireUGT1locus in a large population sample.
To systematically analyze the haplotype architecture of the UGT1locus, we resequenced theUGT1gene clusters, including nine functional genes (UGT1A1, MIM 191740; UGT1A3, MIM 606428; UGT1A4, MIM 606429; UGT1A5, MIM 606430;
UGT1A6, MIM606431;UGT1A7, MIM 606432;UGT1A8, MIM
606433;UGT1A9, MIM 606434; andUGT1A10, MIM 606435) and their flanking regions, in a large sample of the Chinese population. We identified 101 polymorphisms in this Chinese cohort, including 15 novel ones. In addition, we reconstructed the LD map of the whole UGT1 locus. Moreover, we inferred haplotypes at the structural levels ofUGT1variable exons, linkage blocks, and the entire UGT1 locus. TagSNPs for each of the inferred haplotype were also identified. Finally, we compared the SNP frequency, LD map, and haplotype of the Chinese population with those of the Japanese, Caucasian, and African populations. Our results reveal an ethnic-specific pattern of molecular diversity of the clustered UGT1 genes. This work provides an important insight into the genetic variation and genomic architecture of the UGT1 cluster and lays a solid foundation for further pharmacogenomics studies in Chinese.
Materials and Methods
DNA Samples
Peripheral blood samples from 253 unrelated healthy Chinese individuals were obtained from the Henan Regional Hospital after their use in routine physical examinations. Total genomic DNA was isolated from the blood samples by using the Promega Wizard Genomic DNA Purification Kit. The use of these samples was approved by the hospital. Written informed consent was obtained from participants. The study was reviewed and approved by the Institutional Ethics Committee of Shanghai Jiao Tong University.
UGT1Sequencing
We screened nineUGT1first exons, five common exons, and their adjacent regulatory and intronic regions by sequencing 12
PCR-amplified regions of 253 individuals covering a total length of about 17.7 kb (Fig. 1A and Table S1). The gene-specific primer pairs were designed according to the reference sequence AF297093.1 (Table S1) [28]. The PCR amplification was performed in a 20-ml reaction containing 10 ng of genomic DNA, 2ml of 10 6 PCR buffer, 2ml of 2.5 mM dNTPs, 0.25mmol of each primer, and 1 unit of Taq polymerase. After a hot start at 94uC for 3 min, 35 cycles of 94uC, 30 seconds for denaturing, 50–65uC (specific annealing temperatures for PCR reactions are indicated in Table S1), 30 seconds for annealing, and 72uC, 50 to 90 seconds for extension were performed. The final extension was incubated at 72uC for 7 min. Each of the PCR fragments was gel-purified and sequenced in two opposite directions (Fig. 1A and Table S1). Sequences were analyzed with the Vector NTI Advance 10 software (Invitrogen).
The levels of the pairwise linkage disequilibrium (LD) were calculated with HAPLOVIEW 4.1 software [29,30] for all of the polymorphisms identified except those with the frequency,0.005 or the p-value of Hardy-Weinberg equilibrium (HWE),0.05. The density of the color reflects the LD value (r2) with the denser the color, the higher the LD of the pair of markers (Fig. 1B). The haplotype blocks were reconstructed for all of polymorphisms except those with the minor allele frequency (MAF),0.005 or a p-value,0.05 as determined by HAPLOVIEW 4.1 [29,30]. We also confirmed these results by using the GEVALT 2.0 software [31].
Haplotype Reconstruction and TagSNPs Selection TheUGT1haplotypes were inferred with the Bayesian statistical method by using the Phase 2.1.1 program [32]. The TagSNPs were selected with the STAMPA program of the GEVALT 2.0 software [31]. The minimal subsets of SNPs were selected as the tagSNPs when their prediction accuracy is more than or equal to 99% to represent all of the SNPs.
HapMap Analysis
We downloaded the genotyping data from the HapMap database of three other populations: the Japanese in Tokyo area, Japan (JPT, 45 unrelated individuals), the Caucasian with northern and western European ancestry from Utah, United States (CEU, 30 trios), and the Yoruba people in Ibadan, Nigeria (YRI, 30 trios). We compared our data of the Chinese Han in Henan province (CHH) with those of the three HapMap populations.
Results
Analyses of Polymorphisms of theUGT1Gene Cluster in a
Sample of Chinese Population
V
a
riable exons
Constant exons
1
2p
3
4
5
6
7
9
13p
10
8
11
p
12p
2 3 4 5b 5a
Resequenced
regions
A
→
c.711A>C
p.Y189C
p. T202I
c.-2189T>C
c.-1818T>C
c.-688A>C
c.-118_-117insT
c.588G>T
c.855+143C>T
c.855+152G>A
c.855+219T>A
c.855+313A>C
c.855+399C>T
c.855+485A>G
c.855+642G>A
c.855+649C>T
p.K129N
p.K131Q
p.K131R
p.R208W
c.756G>A
p.S7A
c.105C>T
c.315A>G
p.T181A
p.R184S
c.627G>T
c.-369C>T
c.-247_-246insC
c.-234C>T
p.L48S
p.D50E p.L63P
p.H142N
p.A158G
c.645C>T
c.657C>T
p.H225Y
p.L248I
p.V249L
p.G259R
c.783T>C.
c.792T>C
c.-457C>T
c.-419G>A
c.-219C>T
c.-163G>A
p.L48V
p.Q98stop
c.448T>C
c.804G>A
c.867+43C>T
c.867+101G>T
c.-66T>C
p.R45W
p.V47A
c.477A>G
c.867+51A>T
c.-54_-53insTA
c.189C>T
p.G71R
p.P229Q
c.996+15T>C
c.996+307A>G
c.1091C>T
c.1304+1086C>A
c.1602+211T>C
c.1602+339G>C
c.1602+440G>C
1A8
1
A10
1
A9
1A7
1
A6
1A5
1
A4
1A3
1
A1
Exon 2
Exon 4
3
’UTR
94
69
93
45
60
53
31 59
50
44
Block 9
Block 9/7/6
Block 5
Block 4/3
C
Block 3’ UTR
Block 9
Block 9/7/6
Block 5
Block 4/3
Block 3’UTR
were excluded in the following LD analysis. Interestingly, one SNP affecting the protein sequence is not in HWE (pS141C).
We identified 15 novel polymorphisms (Table S2), all of which, except the p.S141C of UGT1A10 (p = 0.004), confirm to the Hardy-Weinberg equilibrium. Ten of these polymorphisms are in the coding sequences, two are in the promoter regions, two are in the intronic regions, and one is in the 39UTR. Six of the 10 novel polymorphisms in the coding region are nonsynonymous. They are p.N209D (MAF = 0.004) of UGT1A8, p.S141C (MAF = 0.004) and p.Y189C (MAF = 0.006) of UGT1A10, p.Q182R (MAF = 0.002) of UGT1A9, and p.P10L (MAF = 0.002) and p.T78S (MAF = 0.004) of UGT1A4. Among these 15 novel polymorphisms, 11 are rare SNPs, as judged by MAF ,0.005. Two of the four with MAF.0.005 are in the coding region and the two in the noncoding region (c.*22189T.C ofUGT1A9and c.*1304+1086C.A of intron 4 in the constant region) have relatively high frequencies of MAF.0.014 (Table S2).
We identified three polymorphisms of nucleotide insertions in the promoter regions, 2118insT resulting in 2118T10 of
UGT1A9, 253ins(TA) resulting in 253(TA)7 of UGT1A1, and
2246insC resulting in 2246C5 of UGT1A5 (Table S2). The former two are known to influence the UGT1 gene expression [34,35]. We however did not observe theUGT1A1*36(253(TA)5)
and UGT1A1*37 (253(TA)8) alleles at this site, which were
previously reported in the Caucasian and African populations [36].
LD Analyses and Haplotype Block Reconstruction We performed pairwise LD analyses for all of the 69UGT1 polymorphisms in HWE and with the MAF.0.005 (Fig. 1B). We used the algorithm of confidence intervals to reconstruct the haplotype block [29]. A strong LD was defined as having a one-sided upper 95% confidence bound on D’ as.0.98 and a lower bound is above 0.7 [29]. A block is reconstructed if 95% of informative SNP pairs are in ‘‘strong LD’’.
The UGT1 locus can be divided into five haplotype blocks: Block 9 with two polymorphisms (c.2688A.C andUGT1A9*1b) in the promoter region ofUGT1A9; Block 9/7/6, composed of the intronic SNPs ofUGT1A9and the coding SNPs ofUGT1A7and
UGT1A6, spanning a large region of about 20 kb, which is quite
similar to those of the Japanese and Caucasian populations [9,37]; Block 5, consisting of three polymorphisms in the promoter region and 13 polymorphisms in the coding region of theUGT1A5gene, spanning only about 1 kb; Block 4/3, consisting of SNPs of
UGT1A4andUGT1A3, spanning about 11 kb, which has not been
observed in other populations; and Block 39 UTR, composed of three SNPs,1A1*76,1A1*78, and1A1*79, in the 39UTR region. We did not observe that theUGT1A8andUGT1A10SNPs belong to one block as reported in the Japanese population [37] and that the SNPs of UGT1A3 and UGT1A1 genes are in one block as reported in the Caucasians [9,38].
To reveal more clearly the boundaries of the LD blocks, we reconstructed the haplotype blocks using only those polymor-phisms in HWE and with the MAF.0.05, excluding all of the polymorphisms with the MAF between 0.005 and 0.05. This did not affect the haplotype block structure with the exception of the
Block 9/7/6. This block now excludes three polymorphisms: c.855+143C.T (MAF = 0.026) and c.855+152G.A (MAF = 0.166) ofUGT1A9, and c.627G.T (MAF = 0.024) ofUGT1A6 (data not shown).
In addition to the paired-polymorphism linkages in the same block, we also observed long-distance LDs among different blocks. For example, the polymorphisms of the UGT1A5 and UGT1A4 genes, though in separate blocks, have a strong linkage. This strong linkage was represented by the rectangular shape between Block 5 and the SNPs ofUGT1A4(0.880,D’,0.950; 0.800,R2 ,0.890) (Fig. 1B). Moreover, there is a strong LD between Block 9 and Block 9/7/6, represented by a small rectangle (0.680, D’ ,0.970; 0.180,R2,0.800) (Fig. 1B). Finally, there is a relatively strong linkage between the intronic SNPs c.855+152G.A, c.855+642G.A, c.855+649C.T ofUGT1A9, the c.756G.A of
UGT1A7, and many polymorphisms of UGT1A5 and UGT1A4
genes (0.810,D’,0.880; 0.600,R2,0.690) (Fig. 1B). We also noted that one intronic SNP downstream of the constant exon 2 c.996+307A.G has a strong linkage with many polymorphisms of1A5and 1A4(0.920,D’,0.960; 0.780,R2 ,0.850). The1A5polymorphisms also have a moderate LD with two1A3alleles: c.-66T.C and1A3*1c(0.890,D’,0.920; 0.430 ,R2,0.770).
To investigate the interblock linkage, we performed a pairwise multi-allelic LD analysis by using the HAPLOVIEW (Fig. 1C) [30]. This analysis confirmed the strong linkage between Block 9 and Block 9/7/6 (D’ = 0.94; R2 = 0.157), and also between Block 5 and Block 4/3 (D’ = 0.93; R2 = 0.118) (Fig. 1C).
The human UGT1A1 gene plays an important role in the metabolism of the endobiotic bilirubin and exobiotic irinotecan [26,35]. Thus, its genotyping has been used in predicting jaundice and personalized treatment of colorectal cancers. We identified sets of polymorphisms of the entireUGT1locus linked with three important UGT1A1 polymorphisms. First, the 1A1 promoter insertion polymorphism c. 254_253insTA (1A1*28), associated with the Gilbert Syndrome, has a moderate to high LD with the 1A3polymorphisms (C.266T.C, R2 = 0.233;1A3*10a, R2 = 0.740;1A3*1c, R2 = 0.236; c.867+51A.T, R2 = 0.314) and one 1A5 allele, c.792T.C (D’ = 0.805, R2 = 0.205) (Fig. 1B). However, the 1A1*28 has extensive higher LDs with a vast number of polymorphisms in theUGT1A3, UGT1A6, UGT1A7,
and UGT1A9 first exons in the Caucasian population [9,38].
Second, the1A1 c.211G.A (1A1*6) has a low to moderate LD with some SNPs of the1A9, 1A7 and 1A6genes (Fig. 1B). The
1A1*6 allele has a reduced glucuronosyltransferase activity for
SN238 in the Japanese cancer patients [39,40]. Finally, the
UGT1A1*27, also associated with the Gilbert Syndrome, has a
complete linkage with the 1A4 intronic SNP c.867+101G.T
(1A4*1d) (D’ = 1, R2 = 1) (Fig. 1B), suggesting that, in addition to
1A1*27, the1A4*1dcan be used as a genotyping marker for the
Gilbert Syndrome.
Haplotype Reconstruction and TagSNPs Selection for the
UGT1Locus
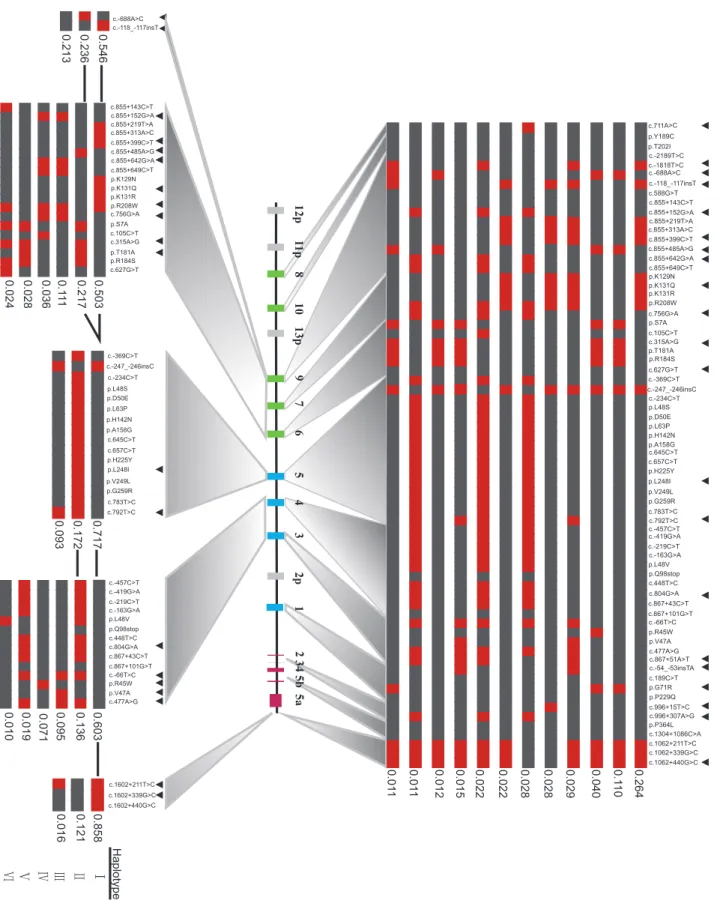
We next identified haplotypes for the entire UGT1locus. We included rare polymorphisms with a frequency between 0.005 and Figure 1. Polymorphisms and linkage analyses of theUGT1gene cluster in Chinese Population.(A) The genomic structure of theUGT1
gene cluster. The resequenced regions are indicated by gray boxes under each exon. The diagram is drawn to scale. (B) Pairwise Linkage disequilibrium (LD) analysis and haplotype block reconstruction in the entireUGT1locus. The polymorphisms are in the same order as the genomic
organization on chromosome 2. The extent of the LD is represented by different shades of gray. The blue lines are the boundaries of haplotype blocks. (C) Multiallelic LD analysis of the five haplotype blocks in theUGT1locus. The numbers (%), generated by the Haploview 4.1, represent the D’ values between any two haplotype blocks.
0.546 0.213 0.236 c.-688A>C c.-118_-117insT ▼▼ 0.503 0.217 0 .111 0.036 0.028 0.024 c.855+143C>T c.855+152G>A c.855+219T>A c.855+313A>C c.855+399C>T c.855+485A>G c.855+642G>A c.855+649C>T p.K129N p.K131Q p.K131R p.R208W c.756G>A p.S7A c.105C>T c.315A>G p.T181A p.R184S c.627G>T 0.858 0.121 0.016 c.1602+211T>C c.1602+339G>C c.1602+440G>C 0.603 0.095 0.071 0.019 0.010 0.136 c.-457C>T c.-419G>A c.-219C>T c.-163G>A p.L48V p.Q98stop c.448T>C c.804G>A c.867+43C>T c.867+101G>T c.-66T>C p.R45W p.V47A c.477A>G c.-369C>T c.-247_-246insC c.-234C>T p.L48S p.D50E p.L63P p.H142N p.A158G c.645C>T c.657C>T p.H225Y 0.717 0.172 0.093 p.L248I p.V249L p.G259R c.783T>C c.792T>C Haplotype 0.264 0.1 1 0 0.040 0.029 0.028 0.028 0.022 0.022 0.015 0.012 0.01 1 0.01 1 1 2p 3 4 5 6 7 9 13p 10 8 11 p 12p
2 34 5b 5a
p.Y189C p.T202I c.-2189T>C c.588G>T c.855+143C>T c.855+219T>A c.855+313A>C c.855+649C>T p.K129N p.K131R p.R208W p.S7A c.105C>T p.T181A p.R184S c.-369C>T c.-234C>T p.L48S p.D50E p.L63P p.H142N p.A158G c.645C>T c.657C>T p.H225Y p.V249L p.G259R c.783T>C c.-457C>T c.-419G>A c.-219C>T p.L48V c.448T>C c.867+43C>T c.867+101G>T c.-66T>C p.R45W p.V47A c.477A>G c.189C>T p.P229Q p.P364L c.1304+1086C>A c.1062+211T>C c.1062+339G>C c.711A>C c.-1818T>C c.-688A>C c.-118_-117insT c.855+152G>A c.855+485A>G c.855+642G>A p.K131Q c.756G>A c.315A>G c.627G>T p.L248I c.792T>C c.804G>A c.867+51A>T c.-54_-53insTA p.G71R c.996+15T>C c.996+307A>G c.1062+440G>C c.855+399C>T c.-163G>A p.Q98stop c.-247_-246insC ▼ ▼ ▼ ▼ ▼▼ ▼ ▼ ▼ ▼ ▼ ▼ ▼ ▼ ▼ ▼ ▼ ▼ ▼ ▼ ▼ ▼▼ ▼ ▼ ▼ ▼ ▼ ▼ ▼ ▼ ▼ ▼ ▼ ▼▼ ▼ ▼ ▼ Ⅰ Ⅱ Ⅲ Ⅳ Ⅴ Ⅵ
0.05 in addition to the polymorphisms with a frequency .0.05, because rare variants may play an important role in the etiology of complex diseases [41]. In this way, 337 haplotypes of the entire UGT1locus in this cohort were inferred, 12 of which exhibit a frequency.1%, representing 59.2% of allUGT1alleles (Fig. 2).
The most common haplotype of the UGT1 locus has a frequency of 26.4% (Fig. 2). This haplotype contains two functional variants, 1A9*1b (c.2118_2117insT) and 1A7*1a(p. K129N/p.K131Q/p.K131R/p.R208W). The former has been associated with a modest increase in the promoter activity [34]; while the latter was associated with an approximately 6-fold higher glucuronosyltransferase activity in vitro [42]. Thus, this most common UGT1 haplotype appears to encode 1A7 and 1A9 isozymes with the higher glucuronosyltransferase activity.
The second common haplotype has a frequency of 11% (Fig. 2). This haplotype includes one1A9promoter variant (c.2688A.C), one1A9intronic variant (c.855+485A.G), and three1A6coding variants1A6*2(p.S7A, p.T181A, p.R184S). The1A6*2allele has been associated with an increased glucuronidation activity [43]. This second haplotype also includes the1A1*6 (p.G71R) allele, which exhibits the reduced enzymatic activity [44]. Thus, these 1A9, 1A6, and1A1alleles may have compensatory effects in this UGT1haplotype.
We used the STAMPA software to select tagSNPs in theUGT1 locus and in five different blocks. We found that 21 SNPs in the UGT1 locus can represent all of the 69 polymorphisms of frequency .0.5% with the accuracy of 99.03%. Thus, these 21 SNPs are tagSNPs of theUGT1locus (Fig. 2).
Haplotypes Reconstruction and TagSNPs Selection for the Five LD Blocks
We also reconstructed haplotypes for the five LD blocks (Fig. 2). The haplotype diversity of each block is relatively limited in comparison with that of the entire locus. The haplotypes with the frequency .1% in each of the five blocks are shown in the Figure 2, representing 99.5%, 91.9%, 98.2%, 93.4%, and 99.5% of all chromosomes, respectively. The five LD blocks have 2, 9, 2, 5, and 2 tagSNPs with the prediction accuracy of 100%, 99.01%, 99.82%, 99.14%, and 99.41%, respectively (Fig. 2). The most common haplotypes of each block all have a frequency .50%. The differences in the haplotype diversity between the whole locus and the individual blocks suggest that there have been lots of recombination events between blocks.
Haplotypes Reconstruction and TagSNPs Selection for NineUGT1Variable Exons
In the above analysis, theUGT1A8, UGT1A10, and UGT1A1 genes were not found to belong to any blocks (Fig. 1B). Since it has been suggested that it is more reliable to identify tagSNPs for each UGT1gene than for haplotype blocks containing multiple genes [38], we also determined haplotypes and tagSNPs for each of the nine individualUGT1genes. We included 78 polymorphisms in HWE in this analysis, excluding the SNPs located within the constant exons and the 39 UTR (Fig. 3). The haplotypes with a frequency.1% for each of the nineUGT1variable exons account for 99.6%, 99%, 91.9%, 99.2%, 98.2%, 97.8%, 93.7%, 98.5%, and 97.9% of all chromosomes, respectively (Fig. 3).
TheUGT1A9gene has the most haplotype diversity, in which
48 haplotypes were identified and 8 with a frequency.1% (Fig. 3). The reference sequences of AF297093.1 [28] represent the most common haplotype ofUGT1A1,UGT1A3,UGT1A6,UGT1A8and
UGT1A10 genes. The reference sequence allele of the UGT1A9
variable exon only has a frequency of 2.7% (Fig. 3). Moreover, the
reference sequence allele of the UGT1A5 variable exon is not represented in the reconstructed UGT1A5 haplotypes (data not shown).
The most common haplotype of 1A9 (39.9%) contains five variants of c.21818T.C, c.855+219T.A, c.855+313A.C, c.855+399C.T, and c.2118_2117insT (1A9*1b). By contrast, the most common haplotype of 1A4 contains only one variant, c.471T.C (1A4*1b), with a frequency of 76.2%. The most common haplotype of1A7, 1A7*1a with a frequency of 53.3%, contains four variants: p.K129N, p.K131Q, p.K131R, and p.R208W.
Following the aforementioned procedure, we determined the tagSNPs in each of the nine UGT1 variable exons. We found between 2 to 7 tagSNPs for each of the variable exons with a prediction accuracy.99% (Fig. 3).
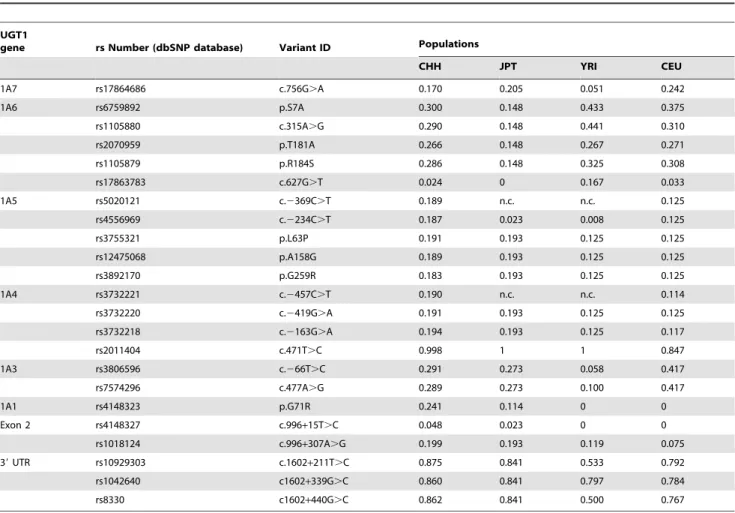
Comparison of Polymorphisms in Four Populations To compare with the Chinese cohort, we downloaded genotyping data of the JPT, CEU, and YRI groups from the HapMap Database (http://hapmap.ncbi.nlm.nih.gov). We found that 19 polymorphisms are shared by CHH, JPT, and CEU, of which only 16 polymorphisms exist in the YRI population (Fig. 4). The common SNPs of theUGT1locus in these four populations have ethnic-specific frequencies (Table 1). For example,UGT1A3
266T.C (rs3806596) has a frequency of 0.2–0.5 in CHH, JPT, and CEU, but is very rare (0.058) in YRI. Compared with the African and Caucasian populations, the SNP frequencies are more similar in the Asian populations (CHH and JPT). Many SNPs have similar frequencies in these two populations, e.g., p.L63P, p.A158G (1A5*2), and p.G259R of 1A5; c.2419G.A, c.2163G.A, and c.471T.C (1A4*1b) of1A4; c.266T.C and c.477A.G (1A3*1c) of1A3; and the intronic SNP c.996+307A.G (Table 1). Interestingly, the abundant SNP of 1A1 in Asian populations, p.G71R (1A1*6), has a much higher frequency in Chinese (0.241) (Table S2) than in Japanese (0.114) (Table 1).
Comparison of LD Map in Four Populations
We performed an LD analysis by using 19 common polymorphisms of the CHH and JPT datasets. These two populations have highly similar LD maps (Fig. 4). For example, both populations have three similar LD Blocks (Fig. 4A,B). However, c.2234C.T (rs4556969) of 1A5 is within the second LD block in CHH but not in JPT (Fig. 4A,B). In addition, we also compared our data with the HapMap data of the Han Chinese. The results are overall very similar except that there exists a large linkage block in the Chinese HapMap data (data not shown).
For better comparison, we included the 1A1 polymorphisms
1A1*6 (rs4148323) and exon 2 c.996+15T.C (rs4148327) of
UGT1A1in the LD analysis for the CEU and YRI populations
despite the fact that their frequencies were zero in these two population (Table 1; Fig. 4C,D). Compared with CHH and JPT, the linkage pattern of highly-linked SNPs is similar in CEU (Fig. 4C). We excluded p.S7A (rs6759892), c.315A.G (rs1105880), and p.T181A (1A6*5) (rs2070959) of 1A6, which are not in HWE, in the LD analysis for the YRI cohort. In comparison with CHH, JPT, and CEU, our results showed a very low level of the long-distance LD, consistent with more recombinations, in the UGT1 locus in the YRI population (Fig. 4D).
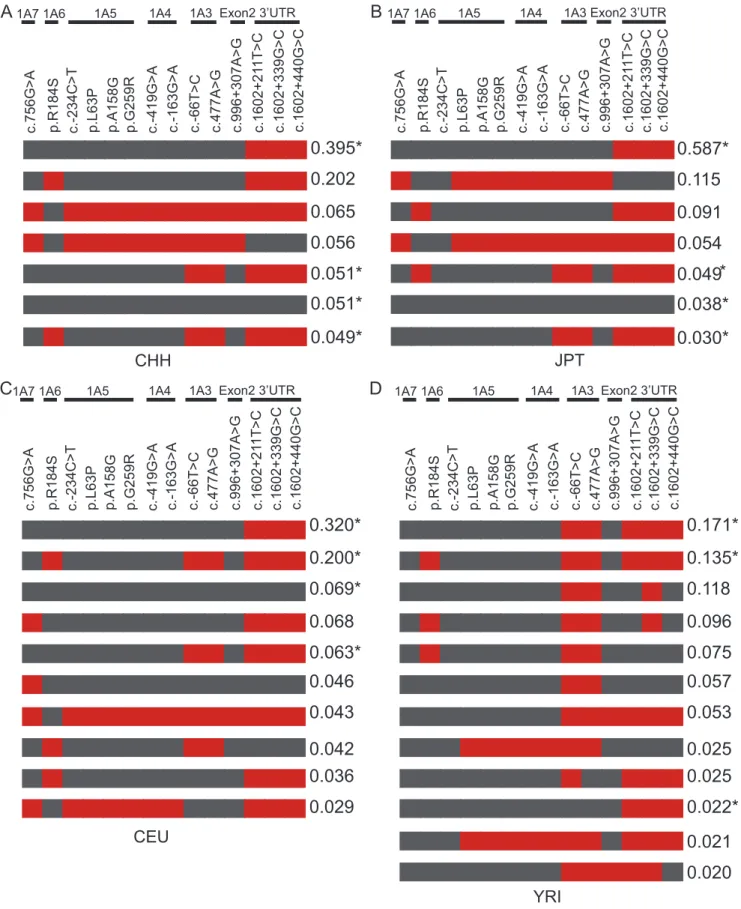
Haplotype Comparisons in Four Populations
in HWE with the Phase2.1.1 program. We listed the haplotypes with a frequency.2% (Fig. 5).
We observed that four common haplotypes of theUGT1locus are shared by these four populations. Each has a haplotype frequency.2% (Fig. 5, indicated by asterisks) with the exception of one with the frequency of 1.3% in YRI (data not shown). There are two additional common haplotypes in the CHH, JPT, and CEU populations (Fig. 5, and data not shown). In total, five haplotypes (.2%) with similar frequencies are shared between CHH and JPT, suggesting that these two populations are much closer. The most common haplotype in each of the four populations includes three polymorphisms of 39 UTR (1A1*76,
1A1*78, and 1A1*79) (Fig. 5). We noticed that one functional
polymorphism, i.e. p.R184S of1A6(1A6*9), resides in many high frequency haplotypes (Fig. 5).
We noted that there exists an ethnic specificity in the haplotype distribution of these four populations. For example, CHH has one specific haplotype with the frequency of 1.2% (data not shown). Moreover, JPT has one specific haplotype with the frequency of 5.4% (Fig. 5B). In addition, CEU has three specific haplotypes with the frequencies of 4.6%, 2.9% (Fig. 5C), and 1.5% (not shown). Finally, YRI has the most haplotype diversity (Fig. 5D). For example, YRI has eight specific haplotypes with the frequency .2%.
Discussion
The UGT family proteins encoded by theUGT1gene cluster are the major drug-metabolizing enzymes, catalyzing about 35% of all phase II drug metabolizing reactions [3]. Single nucleotide polymorphisms of theUGT1gene cluster, which alter amino acids or change gene expression levels, have significant clinical phenotypes, such as variability in inter-individual drug efficacy and/or toxicity [26]. Previous studies have analyzed the genetic architecture of theUGT1gene cluster in the Caucasian, African, and Japanese populations [9,37,38,45]. However, the SNPs and haplotypes of the entireUGT1gene cluster have not been analyzed in a large sample of the Chinese population.
Here, we resequenced all of the variable and constant exons and their surrounding regulatory noncoding regions of the entire UGT1 gene cluster in 253 healthy Chinese individuals. We included the UGT1A5 gene in our resequencing regions for completeness, even though this gene was not included in most other studies because of its low enzymatic activity and substrate uncertainty [9,37,38,45]. We identified 15 novel polymorphisms in this Chinese cohort. We analyzed the polymorphism distribution, established the LD map, and reconstructed the haplotype patterns. This is the first report regarding the numerous genetic variations and their distribution attributes within the Chinese population.
We found 101 polymorphisms in the nine functional UGT1 genes and their flanking sequences of about 17.7 kb of theUGT1 cluster. The polymorphisms in this cluster are unusually abundant (5.7 SNPs per kb) because there is, on average, only one SNP per kb in the human genome [46]. In particular, there are currently 72 nonsynonymous SNPs in the nine coding variable regions (comprising about 7 kb) of the humanUGT1cluster. This suggests that there may be an adaptive evolutionary force for selecting the molecular diversity in the UGT1 cluster among individuals in humans. We previously found that the adaptive evolution plays an essential role for selecting diversified residues in the N-terminal
domains of the nine functional human UGT1 enzymes [7]. By sampling a population of 253 Chinese individuals, our data confirm this initial observation and extend it to suggest that additional adaptive evolution for SNP diversity exists in the human UGT1 locus of the phase II drug-metabolizing enzymes. Interestingly, there also exists the adaptive evolution of SNP diversity in the human SULT1C2 locus, which also encodes a phase II drug-metabolizing enzyme [46], suggesting that the adaptive evolution may be a general phenomenon for enhancing the molecular diversity of the phase II drug-metabolizing enzymes. The gene clusters in the immune systems are known to have the adaptive evolution of SNP diversity and this diversity has inheritable influences on the expression regulation of the immune gene clusters [46]. It will be interesting to determine whether there are adaptive changes for polymorphisms in about 1 million-bp region of the three human neuralPcdhclusters.
We identified 11 novel rare polymorphisms in theUGT1gene cluster with the frequencies ,0.5%. These rare polymorphisms may be important in the future analysis of UGT1 inheritable diseases as well as the pharmacogenetic studies of drug metabolism. Increasingly, increasing evidence suggests that rare variants may be the causative factors of and contribute to multifactorial inheritance disease risks [41]. By contrast, common variants may only confer relatively small increments in disease risks [41]. Thus, we included rare SNPs (0.05.MAF.0.005) in the UGT1 haplotype analysis, which potentially increases the power in future haplotype association studies.
The UGT1A1 protein is the only relevant bilirubin glucur-onidating isozyme among members of the UGT1 protein family encoded by the human UGT1 gene cluster [47]. To date, numerous polymorphisms of UGT1A1 have been identified in association with human diseases of CNI, CNII, and GS [7,15]. The polymorphic insertions in the promoter region of the human
UGT1A1 gene are associated with the efficiency of irinotecan
metabolism [26]. The frequency of the allelic variant c.254_253insTA (1A1*28) (0.105) of the UGT1A1 gene in the Chinese cohort (Table S2) is quite similar to that (0.143) in the healthy Taiwanese [48]. The coding polymorphism G71R of the human UGT1A1 gene is associated with the efficacy of the jaundice phototherapy in infants [49,50]. The frequency of this variant c.211G.A (1A1*6) (0.241, Table S2), which is associated with the serum bilirubin level in the Asian populations, is similar to previously reported [50]. Finally, we found the complete linkage of
the UGT1A4 intronic SNP c.867+101G.T (1A4*1d) with the
UGT1A1c.686C.A (p.P229Q) (UGT1A1*27). Thus, we suggest
that this UGT1A4 intronic SNP can be used as a genotyping marker for the Gilbert Syndrome allele ofUGT1A1*27.
We identified most of the polymorphisms previously reported in Asian populations [38]. The Asian population sample in this previous study included people from Southeast Asian countries, such as Philippines (4 individuals), Vietnam (4 individuals), and Thailand (3 individuals), in addition to China (17 individuals). This is consistent with the idea that Southeast Asian people may have migrated to East Asia in history [51]. However, we noted that some previously reported alleles, such as c.719C.T of 1A9, c.211G.T and c.272G.C of1A5, c.173C.T, c.219A.C, and c.605C.T of 1A4 [38], were not observed in our study. In addition, we did not observe the two polymorphisms, p.P451L and Y486D of UGT1A1, previously reported in the Singaporean Figure 3. Haplotypes and tagSNPs in each of nine variable exons.All of the polymorphisms in HWE are included in the analysis. The haplotypes with frequency of more than or equal to 1% are shown. Black triangle indicates tagSNPs for each gene.
Chinese [49]. This suggests that there is a heterogeneous distribution of variants between Asian populations.
Our LD and haplotype analyses of the UGT1 gene cluster demonstrate the ethnic specificity in the LD and haplotype patterns. For example, Block 9/7/6 and Block 39UTR are present in the Chinese, Japanese, and French-Canadian populations, while Block 5 and Block 4/3 are only observed in the Chinese population. The same haplotypes coexist in different samples with different frequencies; and different populations have their own specific haplotypes. Five haplotypes are shared by the CHH (Chinese), JPT (Japanese), CEU (Caucasian), and YRI (African) groups. However, each of these four populations has its own set of haplotypes (Fig. 5).
The LD map, haplotype block determination, and haplotype reconstruction are greatly dependent on the parameters chosen for the analyses, such as the threshold of SNP frequency and the algorithm used. The cutoff value of SNP frequency influences the LD pattern of theUGT1locus. For example, we did not observe the close linkage of the 686G.A (1A1*27) with (TA)6/7 in theUGT1A1
gene, which was previously reported in Taiwanese [48]. By contrast, we observed thatUGT1A5andUGT1A4are in separate blocks in our Chinese cohort (Fig. 1); However, it is linked in one block in a small sample of 50 Korean individuals [52]. Finally, when variants1A9 c.855+143C.T and 1A6 c.627G.T, both having frequencies below 0.050 (Table S2), were included in the LD analysis, the Block 9/7/6 boundary was altered (not shown).
Compared with individual SNP markers, haplotype, which is the linked combination of polymorphisms, has the greater power to provide more useful information on genotype-phenotype analyses [27]. However, although haplotypes carry more infor-mation than SNPs, there are limitations of computational approaches for reconstructing haplotypes and for determining their frequencies. In this study, we used thePHASE2.1.1computer program, which has previously been shown to have a low error rate in the prediction of haplotypes [32], to reconstruct haplotypes in the Chinese population. Moreover, the relative large sample size of 253 individuals being examined in this study also decreases the error rate in the reconstruction.
Figure 4. Comparsion of LD map of CHH with those of three HapMap populations.The extent of pairwise LD is represented by different shades of gray squares. The thick lines indicate the boundaries of haplotype blocks. The scale above each graph indicates the relative positions of the polymorphisms on chromosome 2. (A) Chinese (CHH, 253 unrelated individuals). (B) Japanese (JPT, 45 unrelated individuals). (C) Caucasian (CEU, 30 trios). (D) African (YRI, 30 trios).
doi:10.1371/journal.pone.0033988.g004
Table 1.Comparison of SNP frequencies at theUGT1locus in four populations.
UGT1
gene rs Number (dbSNP database) Variant ID Populations
CHH JPT YRI CEU
1A7 rs17864686 c.756G.A 0.170 0.205 0.051 0.242
1A6 rs6759892 p.S7A 0.300 0.148 0.433 0.375
rs1105880 c.315A.G 0.290 0.148 0.441 0.310
rs2070959 p.T181A 0.266 0.148 0.267 0.271
rs1105879 p.R184S 0.286 0.148 0.325 0.308
rs17863783 c.627G.T 0.024 0 0.167 0.033
1A5 rs5020121 c.2369C.T 0.189 n.c. n.c. 0.125
rs4556969 c.2234C.T 0.187 0.023 0.008 0.125
rs3755321 p.L63P 0.191 0.193 0.125 0.125
rs12475068 p.A158G 0.189 0.193 0.125 0.125
rs3892170 p.G259R 0.183 0.193 0.125 0.125
1A4 rs3732221 c.2457C.T 0.190 n.c. n.c. 0.114
rs3732220 c.2419G.A 0.191 0.193 0.125 0.125
rs3732218 c.2163G.A 0.194 0.193 0.125 0.117
rs2011404 c.471T.C 0.998 1 1 0.847
1A3 rs3806596 c.266T.C 0.291 0.273 0.058 0.417
rs7574296 c.477A.G 0.289 0.273 0.100 0.417
1A1 rs4148323 p.G71R 0.241 0.114 0 0
Exon 2 rs4148327 c.996+15T.C 0.048 0.023 0 0
rs1018124 c.996+307A.G 0.199 0.193 0.119 0.075 39UTR rs10929303 c.1602+211T.C 0.875 0.841 0.533 0.792 rs1042640 c1602+339G.C 0.860 0.841 0.797 0.784
rs8330 c1602+440G.C 0.862 0.841 0.500 0.767
The common SNPs of theUGT1locus and their frequencies in the four populations are listed. The rs number and Variant ID are also shown. CHH, Chinese in Henan province, China, 253 unrelated individuals.
n.c., not characterized.
CEU
0.320*
0.200*
0.069*
0.068
0.063*
0.046
0.043
0.042
0.036
0.029
1A7 1A6 1A5 1A4 1A3 Exon2 3’UTR
c.75
6
G
>
A
p.R184S c.-2
34C>
T
p.L63P p.A
158G p.G 2 5 9 R
c.-163G>A c
.-6
6T>C
c.477A>G c.1602+21
1T> C c.996+307A>G c .-419 G >A c.1602+339G>C c.1602+440G>C
C
YRI
0.171*
0.135*
0.118
0.096
0.075
0.057
0.053
0.025
0.025
0.022*
0.021
0.020
c .7 56G>Ap.R184S c.-2
3
4
C
>
T
p.L63P p.A
15 8G p .G 2 5 9 R
c.-163G>A c.-6
6
T
>
C
c.477A>G c.16
0 2 + 2 11 T >C c.996+307A>G
1A7 1A6 1A5 1A4 1A3 Exon2 3’UTR
c. -41 9 G>A c.1602+339G>C c.1602+440G>C
D
A
CHH
c.75 6 G > Ap.R184S c.-234C>T p.L63P p.A
1 58G p.G 2 5 9 R
c.-163G>A c .-66T>C
c.477A>G c.1602+21
1T>
C
c.996+307A>G
1A7 1A6 1A5 1A4 1A3 Exon2 3’UTR
c.-419 G >A c.1602+339G>C c.1602+440G>C
0.395*
0.202
0.065
0.056
0.051*
0.051*
0.049*
B
JPT
0.587*
0.115
0.091
0.054
0.049
0.038*
0.030*
c .756G>A p.R184S c.-23 4C>Tp.L63P p.A
1 5 8G p .G 2 5 9 R
c.-163G>A c
.-6
6
T>
C
c.477A>G c.1
6 0 2 +21 1 T > C c.996+307A>G
1A7 1A6 1A5 1A4 1A3 Exon2 3’UTR
c .-41 9 G >A c.1602+339G>C c.1602+440G>C
*
Figure 5. Haplotypes and their frequencies in CHH and three HapMap populations.Only the 14 polymorphisms shared by these four groups are included in the analysis. The haplotypes with frequency more than or equal to 2% are shown. The asterisk (*) indicates the common haplotypes shared by these four populations. The gray boxes in each haplotype represent the reference alleles of the AF297093.1 sequence, and the red ones represent the variants. (A) Chinese. (B) Japanese. (C) Caucasian. (D) African.
We expect that the sets of tagSNPs for each LD block and for each gene identified here could be used for selective SNP genotyping and for inferring all of the non-typed SNPs at a considerable savings in cost [53]. Therefore, the tagSNPs identified here in the UGT1 gene cluster are anticipated to provide a solid foundation for future pharmacogenomic studies. In summary, the genetic variation and haplotype architecture gained from this study should lay a fundamental basis for the prognosis of metabolism diseases as well as for future genomic applications, including the individualized medicine.
Supporting Information
Table S1 List of the primers for PCR amplification and
sequencing. List of all of the primers used to amplify and to sequence each of the 12 UGT1 regions is shown. The size of PCR products and the annealing temperature for each PCR reaction are also shown. The usage of the primers for PCR (P) and for sequencing (S) is indicated. In three cases, a second primer was used for sequencing. F, forward primer; R, reverse primer. (DOC)
Table S2 SNPs and their frequencies identified in
Chinese population. The 101 polymorphisms identified in the Chinese population are listed. The dbSNP Submitter SNP (ss) accession numbers for 15 novel SNPs are also shown. The positions for all of 101 SNPs are according to the finished February 2009 human reference sequence assembly (GRCh37). The corresponding allele frequencies are shown in the right column.
(DOC)
Acknowledgments
We would like to thank Drs. Sudhindra Gadagkar and Dan Czajkowsky as well as the anonymous reviewers for critical comments on the manuscript. Qiang Wu is a Pujiang Scholar.
Author Contributions
Conceived and designed the experiments: JY QW. Performed the experiments: JY. Analyzed the data: JY HH QW. Contributed reagents/ materials/analysis tools: LC HH BL. Wrote the paper: JY QW.
References
1. Zipursky SL, Sanes JR (2010) Chemoaffinity revisited: Dscams, protocadherins, and neural circuit assembly. Cell 143: 343–353.
2. Muotri AR, Gage FH (2006) Generation of neuronal variability and complexity. Nature 441: 1087–1093.
3. Evans WE, Relling MV (1999) Pharmacogenomics: translating functional genomics into rational therapeutics. Science 286: 487–491.
4. Litman GW, Dishaw LJ, Cannon JP, Haire RN, Rast JP (2007) Alternative mechanisms of immune receptor diversity. Curr Opin Immunol 19: 526–534. 5. Noonan JP, Li J, Nguyen L, Caoile C, Dickson M, et al. (2003) Extensive linkage
disequilibrium, a common 16.7-kilobase deletion, and evidence of balancing selection in the human protocadherin alpha cluster. Am J Hum Genet 72: 621–635.
6. Noonan JP, Grimwood J, Schmutz J, Dickson M, Myers RM (2004) Gene conversion and the evolution of protocadherin gene cluster diversity. Genome Res 14: 354–366.
7. Li C, Wu Q (2007) Adaptive evolution of multiple-variable exons and structural diversity of drug-metabolizing enzymes. BMC Evol Biol 7: 69.
8. Me´nard V, Eap O, Harvey M, Guillemette C, Le´vesque E´ (2009) Copy-number variations (CNVs) of the human sex steroid metabolizing genesUGT2B17and
UGT2B28and their associations with aUGT2B15functional polymorphism.
Hum Mutat 30: 1310–1319.
9. Me´nard V, Girard H, Harvey M, Pe´russe L, Guillemette C (2009) Analysis of inherited genetic variations at the UGT1 locus in the French-Canadian population. Hum Mutat 30: 677–687.
10. Wu Q, Maniatis T (1999) A striking organization of a large family of human neural cadherin-like cell adhesion genes. Cell 97: 779–790.
11. Zhang T, Haws P, Wu Q (2004) Multiple variable first exons: a mechanism for cell- and tissue-specific gene regulation. Genome Res 14: 79–89.
12. Tasic B, Nabholz CE, Baldwin KK, Kim Y, Rueckert EH, et al. (2002) Promoter choice determines splice site selection in protocadherin alpha and gamma pre-mRNA splicing. Mol Cell 10: 21–33.
13. Wang X, Su H, Bradley A (2002) Molecular mechanisms governingPcdh-gamma
gene expression: evidence for a multiple promoter and cis-alternative splicing model. Genes Dev 16: 1890–1905.
14. Wu Q (2005) Comparative genomics and diversifying selection of the clustered vertebrate protocadherin genes. Genetics 169: 2179–2188.
15. Tukey RH, Strassburg CP (2000) Human UDP-glucuronosyltransferases: metabolism, expression, and disease. Annu Rev Pharmacol Toxicol 40: 581–616.
16. Mackenzie PI, Walter Bock K, Burchell B, Guillemette C, Ikushiro S, et al. (2005) Nomenclature update for the mammalian UDP glycosyltransferase (UGT) gene superfamily. Pharmacogenet Genomics 15: 677–685.
17. Ritter JK, Chen F, Sheen YY, Tran HM, Kimura S, et al. (1992) A novel complex locus UGT1 encodes human bilirubin, phenol, and other UDP-glucuronosyltransferase isozymes with identical carboxyl termini. J Biol Chem 267: 3257–3261.
18. Owens IS, Basu NK, Banerjee R (2005) UDP-glucuronosyltransferases: gene structures ofUGT1andUGT2families. Methods Enzymol 400: 1–22. 19. Huang H, Wu Q (2010) Cloning and comparative analyses of the zebrafishUgt
repertoire reveal its evolutionary diversity. PLoS One 5: e9144.
20. Locuson CW, Tracy TS (2007) Comparative modelling of the human UDP-glucuronosyltransferases: insights into structure and mechanism. Xenobiotica 37: 155–168.
21. Laakkonen L, Finel M (2010) A molecular model of the human UDP-glucuronosyltransferase 1A1, its membrane orientation, and the interactions between different parts of the enzyme. Mol Pharmacol 77: 931–939. 22. Miley MJ, Zielinska AK, Keenan JE, Bratton SM, Radominska-Pandya A, et al.
(2007) Crystal structure of the cofactor-binding domain of the human phase II drug-metabolism enzyme UDP-glucuronosyltransferase 2B7. J Mol Biol 369: 498–511.
23. Patana AS, Kurkela M, Goldman A, Finel M (2007) The human UDP-glucuronosyltransferase: identification of key residues within the nucleotide-sugar binding site. Mol Pharmacol 72: 604–611.
24. Kadakol A, Ghosh SS, Sappal BS, Sharma G, Chowdhury JR, et al. (2000) Genetic lesions of bilirubin uridine-diphosphoglucuronate glucuronosyltransfer-ase (UGT1A1) causing Crigler-Najjar and Gilbert syndromes: correlation of genotype to phenotype. Hum Mutat 16: 297–306.
25. Crigler JF, Jr., Najjar VA (1952) Congenital familial nonhemolytic jaundice with kernicterus. Pediatrics 10: 169–180.
26. Innocenti F, Ratain MJ (2006) Pharmacogenetics of irinotecan: clinical perspectives on the utility of genotyping. Pharmacogenomics 7: 1211–1221. 27. Judson R, Stephens JC, Windemuth A (2000) The predictive power of
haplotypes in clinical response. Pharmacogenomics 1: 15–26.
28. Gong QH, Cho JW, Huang T, Potter C, Gholami N, et al. (2001) Thirteen UDP glucuronosyltransferase genes are encoded at the humanUGT1gene complex locus. Pharmacogenetics 11: 357–368.
29. Gabriel SB, Schaffner SF, Nguyen H, Moore JM, Roy J, et al. (2002) The structure of haplotype blocks in the human genome. Science 296: 2225–2229. 30. Barrett JC, Fry B, Maller J, Daly MJ (2005) Haploview: analysis and
visualization of LD and haplotype maps. Bioinformatics 21: 263–265. 31. Halperin E, Kimmel G, Shamir R (2005) Tag SNP selection in genotype data
for maximizing SNP prediction accuracy. Bioinformatics 21 Suppl 1: i195–203. 32. Stephens M, Smith NJ, Donnelly P (2001) A new statistical method for haplotype reconstruction from population data. Am J Hum Genet 68: 978–989. 33. Finel M, Li X, Gardner-Stephen D, Bratton S, Mackenzie PI, et al. (2005) Human UDP-glucuronosyltransferase 1A5: identification, expression, and activity. J Pharmacol Exp Ther 315: 1143–1149.
34. Yamanaka H, Nakajima M, Katoh M, Hara Y, Tachibana O, et al. (2004) A novel polymorphism in the promoter region of human UGT1A9 gene
(UGT1A9*22) and its effects on the transcriptional activity. Pharmacogenetics
14: 329–332.
35. Bosma PJ, Chowdhury JR, Bakker C, Gantla S, de Boer A, et al. (1995) The genetic basis of the reduced expression of bilirubin UDP-glucuronosyltransferase 1 in Gilbert’s syndrome. N Engl J Med 333: 1171–1175.
36. Beutler E, Gelbart T, Demina A (1998) Racial variability in the UDP-glucuronosyltransferase 1 (UGT1A1) promoter: a balanced polymorphism for regulation of bilirubin metabolism? Proc Natl Acad Sci USA 95: 8170–8174. 37. Saeki M, Saito Y, Jinno H, Sai K, Ozawa S, et al. (2006) Haplotype structures of
theUGT1Agene complex in a Japanese population. Pharmacogenomics J 6:
63–75.
38. Thomas SS, Li SS, Lampe JW, Potter JD, Bigler J (2006) Genetic variability, haplotypes, and htSNPs for exons 1 at the humanUGT1Alocus. Hum Mutat 27: 717.
39. Carlini LE, Meropol NJ, Bever J, Andria ML, Hill T, et al. (2005)UGT1A7and
UGT1A9 polymorphisms predict response and toxicity in colorectal cancer
40. Fujita K, Ando Y, Nagashima F, Yamamoto W, Eodo H, et al. (2007) Genetic linkage ofUGT1A7andUGT1A9polymorphisms toUGT1A1*6is associated with reduced activity for SN-38 in Japanese patients with cancer. Cancer Chemother Pharmacol 60: 515–522.
41. Manolio TA, Collins FS, Cox NJ, Goldstein DB, Hindorff LA, et al. (2009) Finding the missing heritability of complex diseases. Nature 461: 747–753. 42. Guillemette C, Ritter JK, Auyeung DJ, Kessler FK, Housman DE (2000)
Structural heterogeneity at the UDP-glucuronosyltransferase 1 locus: functional consequences of three novel missense mutations in the humanUGT1A7gene. Pharmacogenetics 10: 629–644.
43. Nagar S, Zalatoris JJ, Blanchard RL (2004) HumanUGT1A6pharmacogenetics: identification of a novel SNP, characterization of allele frequencies and functional analysis of recombinant allozymes in human liver tissue and in cultured cells. Pharmacogenetics 14: 487–499.
44. Aono S, Yamada Y, Keino H, Hanada N, Nakagawa T, et al. (1993) Identification of defect in the genes for bilirubin UDP-glucuronosyl-transferase in a patient with Crigler-Najjar syndrome type II. Biochem Biophys Res Commun 197: 1239–1244.
45. Maitland ML, Grimsley C, Kuttab-Boulos H, Witonsky D, Kasza KE, et al. (2006) Comparative genomics analysis of human sequence variation in the
UGT1Agene cluster. Pharmacogenomics J 6: 52–62.
46. Frazer KA, Ballinger DG, Cox DR, Hinds DA, Stuve LL, et al. (2007) A second generation human haplotype map of over 3.1 million SNPs. Nature 449: 851–861.
47. Bosma PJ, Seppen J, Goldhoorn B, Bakker C, Oude Elferink RP, et al. (1994) Bilirubin UDP-glucuronosyltransferase 1 is the only relevant bilirubin glucuronidating isoform in man. J Biol Chem 269: 17960–17964.
48. Huang CS, Luo GA, Huang ML, Yu SC, Yang SS (2000) Variations of the bilirubin uridine-diphosphoglucuronosyl transferase 1A1 gene in healthy Taiwanese. Pharmacogenetics 10: 539–544.
49. Zhou YY, Lee LY, Ng SY, Hia CP, Low KT, et al. (2009)UGT1A1haplotype mutation among Asians in Singapore. Neonatology 96: 150–155.
50. Akaba K, Kimura T, Sasaki A, Tanabe S, Ikegami T, et al. (1998) Neonatal hyperbilirubinemia and mutation of the bilirubin uridine diphosphate-glucuronosyltransferase gene: a common missense mutation among Japanese, Koreans and Chinese. Biochem Mol Biol Int 46: 21–26.
51. Chu JY, Huang W, Kuang SQ, Wang JM, Xu JJ, et al. (1998) Genetic relationship of populations in China. Proc Natl Acad Sci USA 95: 11763–11768. 52. Yea SS, Lee SS, Kim WY, Liu KH, Kim H, et al. (2008) Genetic variations and haplotypes of UDP-glucuronosyltransferase1Alocus in a Korean population. Ther Drug Monit 30: 23–34.