ISSN(P): 2304-1455/ISSN(E):2224-4433 Volume 5(12), 263-270
MILK CONSUMPTION AND SUPPLY OF ULAANBAATAR CITY
Ichinkhorloo Bazarragchaa
College of Economics and Management, North West A&F University, Yangling, Shaanxi, China
Nyambat Luvsandorj
Management Department, Mongolian University of Life Science, Ulaanbaatar, Mongolia
Lu Qian
College of Economics and Management, North West A&F University, Yangling, Shaanxi, China Abstract1
Ulaanbaatar city (UB) is not only capital and the largest city with continuously growing populations in Mongolia. The people, who must consume milk at highest amounts, are those living in urban areas, especially UB city. Current level of domestic liquid milk production is not met consumption of capital city and other biggest cities. The objective of this study is to analyze market equilibrium of liquid milk (Estimations were relied on the information regarding cow milk, which has the highest yield than milk from other species of five types of livestock) market of UB city, and determine level of milk supply. Market theory, including demand and supply analyses were applied using regression analyses to estimate functional forms and other required statistical- econometrical indicators. Secondary data gathered from National Statistical Office (2004-2014) and methodology for converting adult equivalence methodology cited from methodological guidance. According to the study results, main finding was comparatively bigger deficit of liquid milk market of UB warn weak position of liquid milk security level (794.4 t <237.8 t). Therefore, support of domestic liquid milk producers should be desirable to improve market condition as well as national food security issue. It is clear that in the future more advanced development of intensified dairy farms and supports of their activities are essential in order to meet the demands.
Keywords: liquid milk, intensified dairy farm, adult equivalence, statistical- econometrical indicators
1. INTRODUCTION
Milk and dairy products are one of the traditional foods of the Mongolians and it is the first necessity for physiology needs. Therefore, milk is included in the nutrition strategy list of four foods for population by a new Food Law of Mongolia (GOM, 2012). The Mongolian people do not use the milk directly in their food, but they add milk to tea, make yogurt and curd, additionally use the clotted cream in their food; also high contents of oil in the everyday products as melted butter, milk butter, mare's milk, drink made by thinning, acid drink, high contents of colostrum's as cheese, dried curds and dried milk products as habit to accustomed from ancient period in their life (Unur, 2013). In Mongolia with sharply continental climate, where is dominated the pasture animal husbandry it is less time to prepare the milk /about 4 months/.In warm season, it is formed excess milk. In addition, it is delicate product with high risk to blink in transportation. In cold season, it is
Corresponding author’s
Name: Ichinkhorloo Bazarragchaa Email address: ichko1998@gmail.com
Asian Journal of Agriculture and Rural Development
deficiency in the milk. Becauseof delayed treatment of excess milk accumulated in warm season,1/3of milk is “lost - pour out”. Depending from this in cold season the need in milk is
compensated by imported milk. There are over 18.0 million liters of milk are imported annually (Lkhagvajav, 2013). Now it is restoring manufacture branch for milk and milk products but it is impossible to supply the needs of population in milk especially for population in settlement areas, therefore it is compensated by the import goods to reserve the foodstuffs. Annually use 87.6kg of milk in urban areas but cattle-breeders 220.8 kg of milk (Jargalan, 2012). From the government in 1999 year it was approved “White Revolution” (GOM, 2006)national program with a purpose to improve milk and dairy product supply for the population. Level of the small enterprise’s technology, especially products packaging were improved; at the same time it was increased capacity to produce sterilized milk, yogurt, whipping cream, hard and soft cheese, delicious ice-cream and brand products (Unur, 2013). Even though consumers know that most of companies in Ulaanbaatar using milk powder for their packed milk advertising it as a fresh liquid milk, they still consuming these fake products. Probably, consuming of powdered milk that compensating fresh mill is rather cheaper than wasting time and money for investing on establishment of dairy farms (Sukhbaatar, 2012).
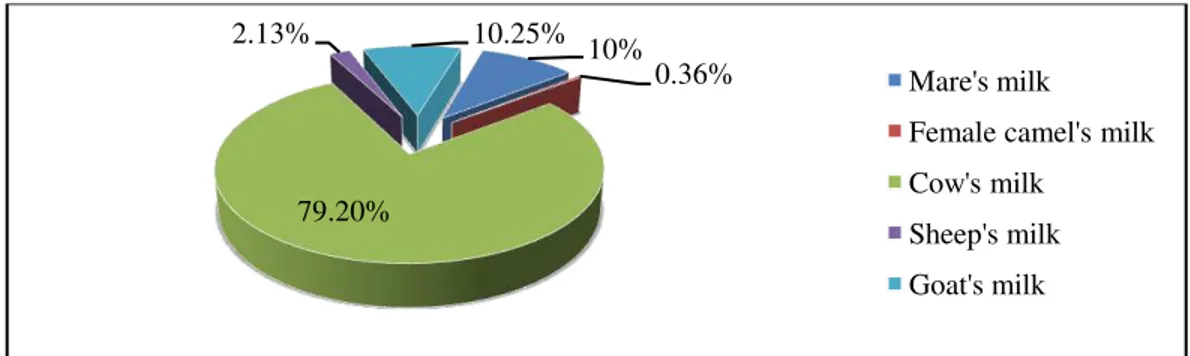
Mongolia in 2014 year has totally 51.1million livestock, from what there are 2.9 million of horse, 3.4million of cattle, 0.3 million of camel, 23.2million of sheep, 22million of goat (NSO, 2014). There are 42.8% of total livestock are dams. These are about 530.0 million liter of milk resource where 79.2 percent is cow milk(Figure 1).
Figure 1: Milk resources in the country by kinds of livestock
The government program “Supporting intensified animal husbandry”(GOM, 2003), national programs “Milk” (GOM, 2006)and “Food Guarantee” (GOM, 2009) were directed to make investment for citizens and entities that produce milk and milk products, also to provide real financial assistance (MFA, 2010).
Figure 2 shows the milk production since implementation program for “Supporting intensified animal husbandry” (Damdinsuren, 2008).
Figure 2: Milk production (million lifters) 10%
0.36%
79.20%
2.13% 10.25%
Mare's milk
Female camel's milk
Cow's milk
Sheep's milk
Goat's milk
0 200 400 600 800 1000
Milk produced in agricultural branch, million liters
2. DESCRIPTION
2.1. Study area
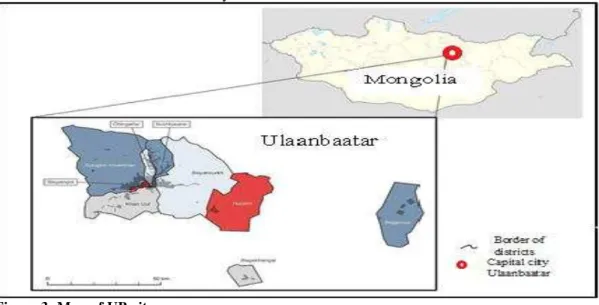
UB is the capital city of Mongolia and only city of million population in the country on the one hand, and an area called Ulaanbaatar the capital (briefly the capital), which has 4,704.4 km2 territory and 9 districts, 3 of which are separate cities according to new administrative divisions in 1992.As of 2014, there were 1.3 million populations in the capital (wikipedia.org, 2010).UB city is situated in eastern central body of Mongolia, surrounded with Soums of Tuv Aimag (Figure 3).
Different study sites are UB is the coldest national capital in the world, with a monsoon-influenced, cold semi-arid climate that closely borders a subarctic climate and humid continental, characterized by the existence of four seasons, as follows:
- Spring from March to May; - Summer from June toAugust;
- Autumn from September to November; - Winter from December to February.
Figure 3: Map of UB city
3. METHODOLOGY
Relying on the data from Statistical Year book (NSO, 2014) of Mongolia (2004-2014), necessary materials were collected and the study was performed in 2 stages.
3.1. Annual consumption and supply of liquid milk for populations of UB city
It estimated by using Methodology to calculate statistical indicators of food security and safety (NSO, 2008).
3.1.1 To estimate number of equivalent population.
3.1.2 To estimate annual demand of milk for equivalent population. 3.1.3 To estimate total milk reserve.
3.1.4 To express milk supply with physical amounts and percentages.
3.2. Market equilibrium of liquid milk market of UB city
3.2.2. Demand and supply analyses were applied using regression analyses to estimate functional forms and other required statistical- econometrical indicators.
4. RESULTS AND DISCUSSION
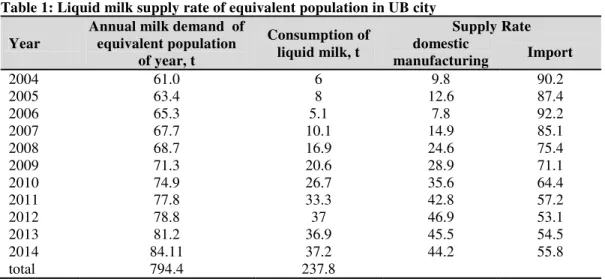
4.1. Table 1 shows milk supply of UB city population could not be completely, provided use imported milk (Anne & Manfred, 1997).
Table 1: Liquid milk supply rate of equivalent population in UB city
Year
Annual milk demand of equivalent population
of year, t
Consumption of liquid milk, t
Supply Rate domestic
manufacturing Import
2004 61.0 6 9.8 90.2
2005 63.4 8 12.6 87.4
2006 65.3 5.1 7.8 92.2
2007 67.7 10.1 14.9 85.1
2008 68.7 16.9 24.6 75.4
2009 71.3 20.6 28.9 71.1
2010 74.9 26.7 35.6 64.4
2011 77.8 33.3 42.8 57.2
2012 78.8 37 46.9 53.1
2013 81.2 36.9 45.5 54.5
2014 84.11 37.2 44.2 55.8
total 794.4 237.8
4.2. Use MS-Excel (Bolormaa, 2013) equilibrium of liquid milk market was calculated relying on total consumption of liquid milk (mil L), supply (mil L), consumers’ price (MNT per liter), annual household income (thousand MNT) of UB city and producers’ price(MNT per liter).
4.2.1. Liquid milk demand (1) and supply function (3) s (Based data analysis reports (table 2, table 3) are:
4.2.1.1. �= 50.9879−0.0236∙ �+ 0.0325∙ ; �
2= 0.95;. . . . (1)
From demand function (1), increase of consumers’ price one liter milk by 1 MNT resulted in decrease of consumption by 0.023 million liter, increase annual family income by 1000 MNT leads to increase of milk consumption by 0.032 million liter. Fisher value F=78.12 expresses confidence probability of the equation is 0.95.
If R of the equation (1) is replaced with household income of 2014: 2014 = 1519.8 demand
function is � = 100.443−0.023∙ �; . . . (2)
Table2: Data analysis report
Regression Statistics
Multiple R 0.975
R Square 0.951
Adjusted R Square 0.939
Standard Error 2.089
Observations 11
ANOVA
d.f SS MS F
Regression 2 681.692 340.846 78.121
Total 10 716.596
Coefficients Standard Error t Stat
Intercept 50.988 1.993 25.580
PD -0.024 0.026 -0.910
R 0.033 0.022 1.918
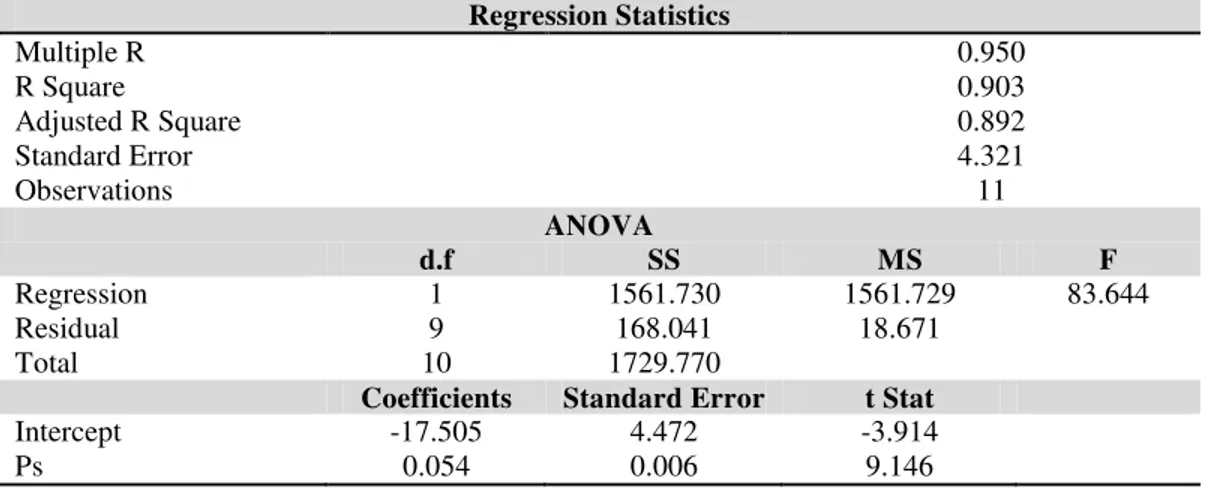
Table 3: Data analysis report
Regression Statistics
Multiple R 0.950
R Square 0.903
Adjusted R Square 0.892
Standard Error 4.321
Observations 11
ANOVA
d.f SS MS F
Regression 1 1561.730 1561.729 83.644
Residual 9 168.041 18.671
Total 10 1729.770
Coefficients Standard Error t Stat
Intercept -17.505 4.472 -3.914
Ps 0.054 0.006 9.146
=−17.505 + 0.055∙ ; �2= 0.90; . . . .(3)
From supply function, increase of producers’ price one liter milk by 1 MNT resulted in increase of production by 0.055 million liter. Fisher value F=83.64 expresses confidence probability of the equation is 0.95.
4.2.1.2. Equilibrium state (figure 4):
100.4437−0.023∙ � =−17.505 + 0.055∙ ;. . . . .(4)
Equilibrium price:0.078∙ ∗= 117.949; ∗= 1502.534 MNT per liter Equilibrium quantity is ∗= 100.443−0.023∙ ∗= 64.953 million liters
Figure 4: Equilibrium liquid milk market of UB city 0.0
20.0 40.0 60.0 80.0 100.0
1100 1200 1300 1400 1500 1600 1700 1800
Qd(P) Qs(P)
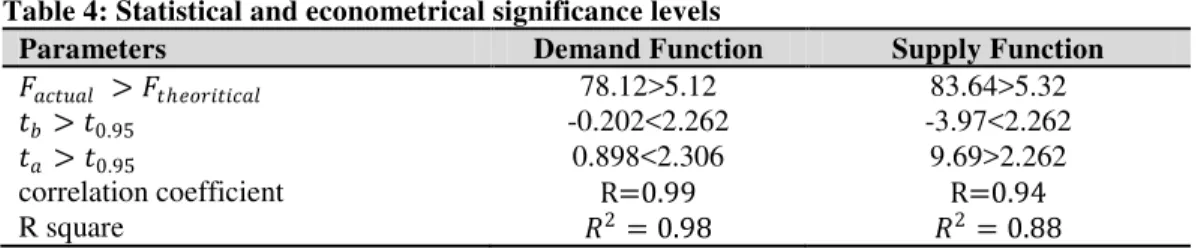
Table 4: Statistical and econometrical significance levels
Parameters Demand Function Supply Function
� >�ℎ� �� � 78.12>5.12 83.64>5.32
> 0.95 -0.202<2.262 -3.97<2.262
> 0.95 0.898<2.306 9.69>2.262
correlation coefficient R=0.99 R=0.94
R square 2= 0.98 2= 0.88
4.2.2. Liquid milk demand and supply functions were confident (table 4), use them calculated forecast of interval error (Nyambat, 2014).
4.2.2.1. For demand function � = 100.443−0.023∙ �:
a. Milk consumers’ price is similar to 2014and if it was � = �2014 = 1375MNT/liter;
�2014 = �2014 ∙ 1 +
1
+ 2014− � 2
( �− �)2 = 2.337; . . . .(5)
Forecast error, million liters:
�= 0.95∙ �2014 = 2.337∙2.201 = 5.144 ; . . . .(6)
�− �= 67.965−5.144≤ �∗ ≤ �+�= 67.965 + 5.144 . . . .(7)
When consumer’s price is similar to 2014, liquid milk demand is between the below interval:
62.821≤ �∗ ≤73.109 million liters.
b. Considering it is greater by 25% than 2014or �2014 = 1718.75 MNT /liter, if the error is
estimated, it is clear that:
�2014 = �2013 ∙ 1 +
1
+ 2014− � 2
�− � 2 = 2.666 . . . (8)
Forecast error, million liter:
�= 0.95∙ �2014 = 2.201∙2.666 = 5.869; . . . .(9)
�− �= 59.841−5.869≤ �∗ ≤ �+�= 59.841 + 5.869; . . . .(10)
When consumers’ price is greater by25% than 2014 or �2014 = 1718.75 MNT/liter,liquid milk
demand is between the below interval: 53.976≤ �∗ ≤65.715million liters.
4.2.2.2. For supply function =−17.505 + 0.054∙ :
a. Milk producers’ price is similar to 2014and if it was = 2014 = 1013 MNT /liter;
2014 = 2014 ∙ 1 +
1
+ 2014− 2
− 2 = 6.028 ; . . . .(11)
Forecast error, million liters:
�= 0.95∙ 2014 = 6.028∙2.201 = 13.263; . . . .(12)
When consumers’ price is similar to 2014, liquid milk supply is between the below interval: 24.422≤ ∗≤50.948 million liter.
b. Considering it is greater by 25% than 2014or = 2014 = 1266.25 MNT /liter, if the error is
estimated, it is clear that:
2014 = 2014 ∙ 1 +
1
+ 2014− 2
( − )2 = 5.257; . . . (14)
Forecast error, million liter:
�= 0.95∙ 2013 = 5.257∙2.201 = 11.571 ; . . . . . (15)
− �= 51.483−11.571≤ ∗≤ +�= 51.483 + 11.571 .... . . (16) When producers’ price is greater by25% than 2014 or = 1266.52 MNT/liter,liquid milk supply is between the below interval: 39.912≤ ∗≤63.054million liters.
5. CONCLUSION
According to the study results, main finding was comparatively bigger (supply (production) <consumption or 794.4 t <237.8 t) deficit of liquid milk market UB warn weak position of food security level. Therefore, support of domestic liquid milk producers should be desirable to improve market condition as well as national milk security issue.
Determined function of liquid milk demand and supply function (2), (3) s for UB city demonstrate demand elasticity is higher, while supply elasticity is weak. From above it is clear imported powder milk is diluted and then it is sold in large amounts. Consumption of liquid milk is similar to that in 2014, probability of equation of consumers’ price to purchase milk (7) and consumption is greater by 25% than those in 2014, probability of equation of consumers’ price 1 liter liquid milk (10) and supply is similar to that in 2014, while probability of equation of producers’ price of 1 liter milk (13) and supply is greater by 25% than those in 2014, probability of equation of producers’ price 1 liter liquid milk (16) is 0.95.
Calculated function and parameter report (Table 4) shows demand and supply function regression coefficient (-0.2042<2.2622), (-3.97<2.2622) and a coefficient of supply function 0.8977<2.2622) are not confident, while supply function regression coefficient (9.6940>2.2622) is confident. Functions correlation coefficients closer to +1 indicates correlation density is good, while determination coefficient (R2) closer to +1 reveals proper selection of linear function.
Acknowledgement
I acknowledge our co-authors, Professor L. Nyambat and Professor Lu Qian (陆迁) for their invaluable advices and supervision in my entire research journey.
Views and opinions expressed in this study are the views and opinions of the authors, Asian Journal of Agriculture and Rural Development shall not be responsible or answerable for any loss, damage or liability etc. caused in relation to/arising out of the use of the content.
Reference
Anne, T., & Manfred, M. (1997). Implication of economics policy for food security / a training
mannual. Rome: FAO, UN.
Damdinsuren, L. (2008). Mongolian Dairy Products. Doctoral thesis, Mongolian University of Science and Technology, Mongolia.
GOM (Government of Mongolia) (2006). Milk- National Program. Government resolution No. 239, Mongolia.
GOM (Government of Mongolia) (2006). White Revolution. Government Resolution No. 105, Mongolia.
GOM (Government of Mongolia) (2009). Food Guarantee-National Program. Government Resolution No. 32, Mongolia.
GOM (Government of Mongolia) (2012).Food Law.Government of Mongolia, chapter 3-3.1.6, Mongolia.
GOM (Government of Mongolia) (2003). To Support Intensified Animal Husbandry- National program.Government Resolution No. 160, Mongolia.
Jargalan, B. (2012). Mongolian milk or monmilk. Journal of Mongolian Agriculture, 6(18), 5-9. Lkhagvajav, O. (2013). Current condition of Mongolian food branch. Niigmiin Toli-Daily
Newspaper, 19(5284), pp. A3.
MFA (2010). Report- Food Guarantee. Ulaanbaatar: Ministry of Food and Agriculture press. NSO (2014). Mongolian Statistical Yearbook 2006-2014. Ulaanbaatar, Mongolia.
NSO (2008). Methodology for estimation of statistical parameters food safety and supply. Retrieved 2015, from NSO Web site: http://web.nso.mn/AAZMS/assets/uploads/files/cafc3-khunsnii_ayulgvi_baidal.pdf.
Nyambat, L. (2014). Econometrics: Methdology, 1st ed.4 ungu Press, Ulaanbaatar, pp. 14-24 Orosoo, R., & Bakey, A. (2012). Economics: Market theory. 3rd ed. Inter Press, Ulaanbaatar. Sukhbaatar, T. (2012, June 22). Food safety Mongolia-Milk safety.Journal of Mongolian
Agriculture, 7(19), 6-8.
Unur, K. (2013). Let's build milk farm for farmers. Niigmiin Toli-Daily Newspaper, 27(5292), pp. B5.