Instituição: Curso de Nutrição do Centro de Ciências Biológicas e da Saúde da Universidade Federal de Sergipe (UFS), São Cristóvão, SE, Brasil 1Acadêmica do Curso de Nutrição da UFS, Aracaju, SE, Brasil 2Nutricionista pela UFS, Aracaju, SE, Brasil
3Doutora em Nutrição pela Universidade Federal de Viçosa; Professora Adjunta da UFS, Aracaju, SE, Brasil
Endereço para correspondência: Elenice de Oliveira S. Filha
Rua Cabo Nivaldo Gomes da Silva, 248 – Bugio CEP 49090-390 – Aracaju/SE
E-mail: [email protected]
Fonte financiadora: Fundação de Apoio à Pesquisa e à Inovação Tecnológica do Estado de Sergipe (FAPITEC), protocolo 019.203.01084/2008-3, e Programa de Auxílio à Integração de Docentes e Técnicos Administrativos Recém-Doutores às Atividades de Pesquisa (PAIRD/UFS)
Conflito de interesse: nada a declarar Recebido em: 5/2/2012
Aprovado em: 11/6/2012
Consumption of food groups among children attending the public
health system of Aracaju, Northeast Brazil, in Sergipe
Consumo dos grupos alimentares em crianças usuárias da rede pública de saúde do município de Aracaju, Sergipe
Consumo de los grupos alimentares en niños usuarios de la red pública de salud en el municipio de Aracaju, Sergipe (Brasil)
Elenice de Oliveira S. Filha1, Jackeline Silveira Araújo2, Juliana Santos Barbosa2, Danielle Pereira Gaujac2, Cinthia Fontes da S. Santos2,
Danielle Góes da Silva3
ABSTRACT
Objective: To investigate the consumption of food groups among children attending the public health system of Ara-caju, in Sergipe, Northeast Brazil.
Methods: A cross-sectional study with 359 children aged 6 to 35 months attending five Basic Health Units. Food intake was determined by 24-hour recall, and the reported foods consumed by the children were converted into portions based on the eight food groups from the Food Pyramid. Inadequacies were analyzed according to the rec-ommendations of the Brazilian food guides. Dietary intake of children with the following age ranges were compared: 6 to 11, 12 to 23 and 24 to 35 months. Statistical analysis applied Kruskal-Wallis and chi-square tests, considering 5% as the significance level.
Results: Among the 359 studied children, insufficient consumption of vegetables, fruits and dairy products, and high intake of sugar and sweets were observed. When comparing consumption between the different age groups, children aged 6 to 11 months presented lower consump-tion of fruits, meat and vegetables, and those aged 24 to 35 months had high percentage of intake of cereals, sugar and sweets, and oil and fat.
Conclusions: The dietary intake of children showed inadequacies in food groups of fruit, vegetables, dairy, and sugar and sweets, as well as significant differences between age-groups. Thus, it is important to highlight the need for nutritional education respecting age specificities, in order to contribute to medium and long-term prevention of nutritional problems.
Key-words: food consumption; feeding; child.
RESUMO
Objetivo: Avaliar o consumo dos grupos alimentares em crianças usuárias da rede pública de saúde do município de Aracaju, Sergipe.
os testes estatísticos Kruskal-Wallis e qui-quadrado foram utilizados, considerando nível de significância de 5%.
Resultados: Dentre as 359 crianças incluídas, observou-se consumo insuficiente de hortaliças, frutas, leite e derivados, e alto consumo de açúcares e doces. Quando comparado o consu-mo entre as diferentes faixas etárias, as crianças de 6 a 11 meses apresentaram menor consumo de frutas, carnes e leguminosas, e as de 24 a 35 meses tiveram maiores percentuais de ingestão excessiva de cereais, açúcares e doces, óleos e gorduras.
Conclusões: O consumo alimentar das crianças apresen-tou inadequações nos grupos alimentares das frutas, horta-liças, leite e derivados, açúcares e doces, além de diferenças significativas no consumo entre as faixas etárias. Nesse contexto, é importante salientar a necessidade da educação alimentar e nutricional, respeitando as especificidades de cada grupo etário, visando a contribuir para a prevenção de problemas nutricionais em médio e longo prazos.
Palavras-chave: consumo alimentar; alimentação; criança.
RESUMEN
Objetivo: Evaluar el consumo de los grupos alimentares en niños usuarios de la red pública de salud del municipio de Aracaju, Sergipe.
Métodos: Estudio transversal con niños de 6 a 35 meses de cinco Unidades Básicas de Salud. Para la evaluación die-tética, se utilizó el Recordatorio Alimentar de 24 horas. Los alimentos y preparaciones consumidos por los niños fueron transformados en porciones en función de los ocho grupos de alimentos de la Pirámide Alimentar y sus inadecuaciones fueron analizadas conforme a las recomendaciones de los guías alimentares brasileños. Se comparó el consumo alimentar de las franjas de edad de 6 a 11 meses, 12 a 23 meses y 24 a 35 meses.Para análisis de las variables, se utilizaron las pruebas estadísticas Kruskal-Wallis y Chi cuadrado, considerando un nivel de significancia de 5%.
Resultados: Entre los 359 niños incluidos, se observó consumo insuficiente de hortalizas, frutas y leche y derivados, y alto consumo de azúcares y dulces. Cuando comparado el consumo entre las distintas franjas de edad, los niños de 6 a 11 meses presentaron menor consumo de frutas, carnes y leguminosas, y los niños de 24 a 35 meses presentaron ma-yores porcentajes de ingestión excesiva de cereales, azúcares y dulces, aceites y grasas.
Conclusión:El consumo alimentar de los niños presen-tó inadecuaciones en los grupos alimentares de las frutas, hortalizas, leche y derivados, azúcares y dulces, además de
las diferencias significativas en el consumo entre las franjas de edad. En ese contexto, es importante subrayar la necesi-dad de la educación alimentar y nutricional, respetando las especificidades de cada grupo de edad, con el objetivo de contribuir para la prevención de problemas nutricionales en medio y largo plazos.
Palabras clave: consumo alimentar; alimentación; niño.
Introduction
Feeding practices in the irst three years of life are extremely important in building a child’s eating habits. They are also an appropriate source of information, as diet composition is fundamental for the maintenance of an adequate nutritional status. Inadequate habits contribute to the early development of disorders, such as overweight and obesity, and may also acceler-ate the development of diseases, such as hypertension, diabetes type 2, coronary heart diseases, osteoporosis and cancer(1-3).
The current trend of preferences among children promotes the consumption of high amounts of fats, sugars, sweets and salt and a low consumption of vegetables and fruits(4-10). The
increased consumption of high-energy density foods and the reduction in the practice of physical activities are the major environmental factors associated with the increase in the prevalence of overweight and obesity(11,12).
The physiological and behavioral characteristics of chil-dren vary according to their age. Infants in their irst year of life grow faster than preschoolers (2 to 5 years of age). Therefore, nutritional needs are higher, and inadequate consumption may affect their nutritional status and lead to deiciencies of speciic nutrients, such as iron and zinc(13).
At this age, the early or late introduction of complemen-tary foods may have negative effects on health and delay growth(14). Food neophobia at the time of complementary
food introduction may be solved by parental interference, as parents are responsible for offering a varied diet so that chil-dren try different lavors and develop and exercise their taste. During the preschool years, physiological growth slows down and appetite is usually decreased, together with a lack of interest in meals, which characterizes physiological anorexia(15). Food consumption by preschoolers is
character-ized by a monotonous diet and affected by family habits(16).
Moreover, the excessive consumption of high-calorie foods may limit the intake of a varied diet, because the child is rapidly satiated and cannot eat other foods.
and the necessary nutrients should be offered for the adequate development of the organism and the prevention of nutri-tional deiciencies and excesses.
Food guides have been developed to provide the popu-lation with dietary guidance about healthy food choices and adequate consumption of the different types of foods. According to the American Dietetic Association(17), dietary
guides for children should contribute to reducing nutritional deiciencies and malnutrition, as well as to preventing over-weight and obesity among children. In Brazil, the two most often used diet guides for children are the one developed by Philippi et al(18), represented by the food pyramid for
chil-dren 2 to 3 years of age and based on the North American food guide, and the one published by the Brazilian Ministry of Health and the Pan-American Health Organization for children younger than 2 years(19). These food guides describe
the number of recommended servings for each food group: cereals, legumes, fruits, vegetables, dairy products, meat and eggs, sugars and sweets and oils and fats. The recom-mended amounts and types in the food guides are described according to the diet pattern of the population and based on scientiic evidence(17).
Scientiic studies should be conducted to report on the con-sumption of foods in the different groups by children. This study evaluated consumption and investigated dietary inadequacies according to Brazilian food guides in a group of children seen in Basic Healthcare Units in the city of Aracaju, Brazil.
Methods
This cross-sectional population-based study was conduct-ed from July 2009 to February 2010 in ive Basic Healthcare Units (BHU) in the suburbs of the city of Aracaju, Brazil. The BHUs were selected from a list provided by the Center for Continued Health Education of the Basic Healthcare Network in Aracaju with BHUs distributed into eight re-gions. Five BHU were selected from four different regions; they had the largest number of children younger than 35 months and were located in suburban areas of the town.
The sample was selected by convenience, and we enrolled all children seen in the BHU on the days when data were collected. The inal sample comprised 359 children aged 6 to 35 months. Inclusion criteria were: to be a patient in a selected BHU, to have started eating complementary foods and not to have any disease that may compromise food con-sumption. All parents or guardians received explanations about the study and signed a written informed consent term.
Children were not included if their guardians did not know what their food consumption was on the previous day. This study was approved by the Ethics in Research Committee of Universidade de Federal de Sergipe.
Data were collected during an interview with parents or guardians, and a questionnaire about sample characteristics and a food survey were illed out. The questionnaire had questions about age, sex, parental education and per capita family income. The 24-hour recall was used to evaluate dietary intake. All foods and drinks consumed in the day before the interview were recorded using servings according to home measurements separately for each meal. The description of food servings was illustrated in a photo album of home servings and food amounts. To estimate food consumption, the foods were classiied into the eight groups of the food pyramid (cereals and le-gumes, fruits, vegetables, meats, milk and dairy products, sugars and sweets and oils and fats) and described as number of servings according to the caloric value provided by each serving in each food group and according to the recom-mendations in the food guides followed(16,17). For example,
one serving of cereals was recorded when the child had eaten 75kcal of foods in this group. The Virtual Nutri 2.0(20)
software was used to calculate calorie consumption and to deine intake for each food group. Mixed preparations were separated into their ingredients to classify foods according to their groups in the food pyramid. Home measurements were converted into grams or milliliters of food using a table of home measurements(21).
The oils and fats used in foods and preparations were added to their corresponding group, except those naturally found in foods. Sugars and sweets were added when used in preparations, in foods with a high amount of sugars, in artiicial powdered juice mixes and in sweets in general.
To compare the consumption of food groups by children, they were divided into three groups (6 to 11 months, 12 to 23 months and 24 to 35 months) for the analysis according to each age speciicity. The results of dietary intake of children 24 to 35 months of age were compared with the servings in the food pyramid developed by Philipi et al(18) for children 2
to 3 years old, in which the adequate consumption of serv-ings is 5 for cereals, 3 for fruits, 3 for vegetables, 2 for meat and eggs, 3 for milk and dairy products, 1 for legumes, 1 for sugars and sweets and 1 for oils and fats. For children younger than 24 months, servings were compared with the food guide for children younger than 2 years(19), which
3 servings of milk and dairy products, 1 serving of legumes, 1 serving of sugars and sweets and 2 servings of oils and fats. The SPSS for Windows 18.0.1 was used for statistical analyses(22). The Kruskal-Wallis test was used to compare
number of servings consumed in the food groups according to age groups. A chi-square test was used to compare the frequency of inadequate number of servings consumed in the food groups according to age groups. The signiicance level was set at p<0.05.
Results
Of the 359 children enrolled in the study, 208 (57.9%) were aged 12 to 24 months, 86 (24.0%) were 6 to 12
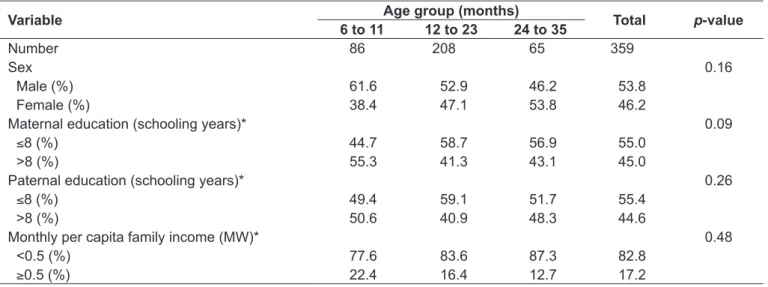
months, and 65 (18.1%), older than 24 months. The characteristics of children according to age group are shown in Table 1. There were no differences in sex, pa-rental education and per capita family income between age groups.
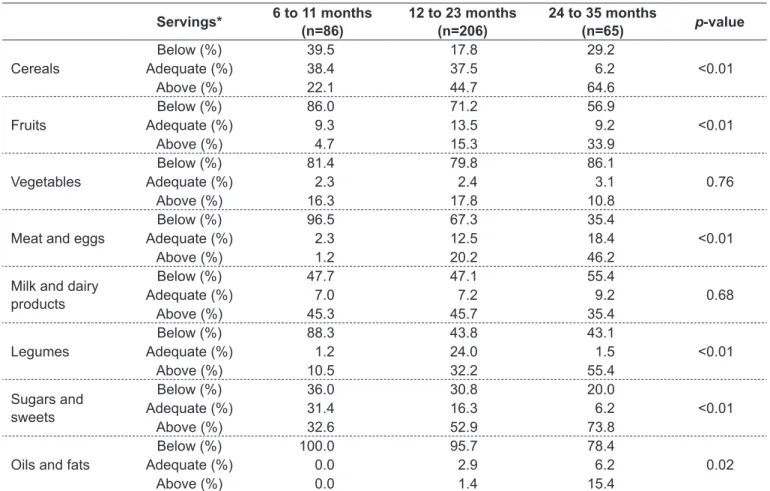
The analysis of food groups revealed that the consumption of cereals, fruits, meat and eggs, legumes, sugars and sweets was different between age groups, whereas the consumption of vegetables, milk and dairy products and oils and fats was similar (Table 2).
Table 3 shows the adequacy of food group consumption according to food guides for children in the three age groups. Infants and children aged 6 to 11 and 12 to 23 months had a greater percentage of inadequate consumption of fruits,
Table 1 - Characteristics of the children included in the study and seen in the Basic Healthcare Units in suburban areas of Aracaju, Brazil, according to age group, 2010
Variable Age group (months) Total p-value
6 to 11 12 to 23 24 to 35
Number 86 208 65 359
Sex 0.16
Male (%) 61.6 52.9 46.2 53.8
Female (%) 38.4 47.1 53.8 46.2
Maternal education (schooling years)* 0.09
≤8 (%) 44.7 58.7 56.9 55.0
>8 (%) 55.3 41.3 43.1 45.0
Paternal education (schooling years)* 0.26
≤8 (%) 49.4 59.1 51.7 55.4
>8 (%) 50.6 40.9 48.3 44.6
Monthly per capita family income (MW)* 0.48
<0.5 (%) 77.6 83.6 87.3 82.8
≥0.5 (%) 22.4 16.4 12.7 17.2
MW: Minimum wage; *Variables with where data were missing: maternal education (01); paternal education (16); per capita family income (10)
Table 2 - Consumption of servings in each food group according to age group of children under study, Aracaju, Brazil, 2010
Food groups 6 to 11 months 12 to 23 months 24 to 35 months p-value R Mean±SD Median R Mean±SD Median R Mean±SD Median
Cereals 3–5 4.0±3.0 3.3 3–5 5.5±3.2 4.9 5 7.6±4.2 6.7 <0.01
Fruits 3–4 1.0±1.8 0.3 3–4 2.0±2.5 1.2 3 3.0±3.3 2.1 0.00
Vegetables 3 1.2±2.2 0.0 3 1.4±2.6 0.0 3 0.9±2.0 0.0 0.44
Meat and eggs 2 0.6±1.5 0.1 2 1.4±1.3 1.1 2 2.6±1.9 2.1 <0.01
Mild and dairy products
3 3.9±4.0 3.0 3 3.4±2.5 3.0 3 3.0±2.7 2.5 0.34
Legumes 1 0.3±0.7 0.0 1 0.9±1.2 0.8 1 1.4±1.3 1.6 <0.01
Sugars and sweets
1 2.2±2.7 1.0 1 2.1±2.4 1.3 1 2.7±2.1 2.3 0.01
Oils and fats 2 0.0±0.1 0.0 2 0.2±0.5 0.0 1 0.4±0.9 0.0 0.43
meats and eggs, which were below the recommended amounts. Children older than 24 months had an excessive consumption of cereals, legumes, sugars and sweets and oils and fats. There were no differences in the consumption of vegetables or milk and dairy products between age groups.
Discussion
Food choices are extremely important for the adequate growth and development because the quality of food intake affects nutrient supply and nutritional status. The pattern of food consumption in the sample of children seen in the BHUs in the city of Aracaju was characterized by the insuf-icient consumption of vegetables, fruits and milk and dairy products, as well as by the excessive consumption of sugars and sweets. Studies in the literature have reported that the insuficient consumption of fruits, vegetables and legumes, skipping meals, the reduced consumption of milk and dairy products and the increase in the consumption of processed
foods and soft drinks, in addition to the introduction of foods that are not appropriate for the age, favor the development of overweight in children(12).
Oils and fats and sugars and sweets are distributed in all food groups, and were placed separately in the food pyramid to limit the amounts added to dietary intake. Therefore, the reduced consumption of the recommended servings in these food groups does not necessarily lead to an inadequate intake.
The adequate introduction of healthy foods after 6 months of age in a pleasant environment promotes the acquisition of healthy eating preferences. Family habits affect consumption by children because of the transference of an eating culture, as children learn about hunger and satiety during socializa-tion, develop the perception of tastes and preferences, and begin to develop their eating behavior(15).
This study found that infants and children 6 to 11 and 12 to 23 months old had an excessive consumption of foods, such as milk and dairy products and sugars and sweets, which may result in a predominantly monotonous diet of
Table 3 - Consumption of foods by children under study in Aracaju, Brazil, according to recommendations in food guides, 2010
Servings* 6 to 11 months (n=86)
12 to 23 months (n=206)
24 to 35 months
(n=65) p-value
Cereals
Below (%) 39.5 17.8 29.2
Adequate (%) 38.4 37.5 6.2 <0.01
Above (%) 22.1 44.7 64.6
Fruits
Below (%) 86.0 71.2 56.9
Adequate (%) 9.3 13.5 9.2 <0.01
Above (%) 4.7 15.3 33.9
Vegetables
Below (%) 81.4 79.8 86.1
Adequate (%) 2.3 2.4 3.1 0.76
Above (%) 16.3 17.8 10.8
Meat and eggs
Below (%) 96.5 67.3 35.4
Adequate (%) 2.3 12.5 18.4 <0.01
Above (%) 1.2 20.2 46.2
Milk and dairy products
Below (%) 47.7 47.1 55.4
Adequate (%) 7.0 7.2 9.2 0.68
Above (%) 45.3 45.7 35.4
Legumes
Below (%) 88.3 43.8 43.1
Adequate (%) 1.2 24.0 1.5 <0.01
Above (%) 10.5 32.2 55.4
Sugars and sweets
Below (%) 36.0 30.8 20.0
Adequate (%) 31.4 16.3 6.2 <0.01
Above (%) 32.6 52.9 73.8
Oils and fats
Below (%) 100.0 95.7 78.4
Adequate (%) 0.0 2.9 6.2 0.02
Above (%) 0.0 1.4 15.4
*Servings were classiied as adequate when they meet the recommendations of the childhood food guide for children younger than 2 years(19) and
dairy products. The opposite was observed for children aged 24 to 35 months, who consumed mostly cereals, meats and eggs, legumes, sugars and sweets and oils and fats. Such reversal of the eating pattern in older children, when com-pared with younger children, should be associated with the incorporation of family eating habits, which affect the eating behavior of children.
According to our study, the highest percentages of inadequa-cy (below recommendations) of consumption of fruit, meats and legumes were found in the group of 6- to 11-month-old infants. Infants in the irst year of life are very vulnerable to nutritional deiciencies because of the decrease in nutrient reserves (such as iron) accumulated during fetal life, of the greater physiological need due to accelerated growth and the introduction of comple-mentary foods(23,24). The inadequate intake of these foods (fruits,
meats and legumes) in the population under study may have contributed to the development of deiciencies, such as iron deiciency anemia, a very common problem among infants. Fruits are excellent sources of vitamins, specially ascorbic acid, a nutrient that promotes iron absorption; meats provide iron with the best bioavailability in the diet; and legumes, especially beans, are rich in non-heme iron(14), which, despite their low
bioavailability, are the main source of iron among low socio-economic populations in Brazil.
In our sample, the consumption of fruits and vegetables was well below the recommended servings in all age groups. However, the consumption of fruits showed a slight reduc-tion of its inadequacy (below recommended levels) as age increased, and vegetables retained a high percentage of insuficient consumption in all age groups. Oliveira et al(25)
found that, among children in their irst and second years of life, the consumption of fruits was more frequent in the second year, and their consumption of vegetables was lower in the irst year. The consumption of vegetables and fruits is extremely important for the adequate supply of vitamins and minerals, as well as to control weight, and it contributes to the prevention of chronic noncommunicable diseases that may affect pediatric populations(1,3,26). Simon et
al(27) conducted a study with preschool children aged 2 to 6
years and found that they consumed fewer servings of cere-als and vegetables and more milk and dairy products than recommended, in addition to adequate consumption of fruit servings. However, their study, conducted with children in private schools in São Paulo, had a population of different socioeconomic characteristics from those of our sample.
Growth slows down in preschool children and their appetite may be decreased. In this phase, new eating habits are acquired
and affect the eating patterns to be adopted in older ages(28). In
our study, the greatest percentages of consumption above the recommended amounts were observed in the group of children 24 to 35 months old, for sugars and sweets (73.8%), cereals (64.6%), oils and fats (15.4%). The foods that contributed to the high consumption of these groups were added sugars, white bread, starchy foods and butter. Barbosa et al(9) studied
the consumption of preschool children aged 2 to 3 years in day-care centers in Rio de Janeiro and found that the food groups consumed in numbers of servings below those recommended by Philippi et al(18) were cereals, fruits, vegetables and milk
and dairy products. They also found an excessive consumption of legumes and sugar and sweets. Mondini et al(6) evaluated
children in the metropolitan area of São Paulo and found that inadequate eating habits, such as the high consumption of processed foods, sweets and soft drinks, were associated with childhood obesity. A study conducted in the Paquetá Island, in Rio de Janeiro, found that consumption in the group of fruits and vegetables among two- and three-year-old children did not meet the minimum recommended for the age(7).
The eating patterns of children probably relect the eat-ing habits of their families. Data of the latest Expenditure and Income Survey for Brazilian families(28) conirmed that
the consumption of fruits and vegetables is substantially below the recommended nutritional values. Moreover, basic and traditional Brazilian foods, such as rice, black beans and manioc lour, have lost importance, and the relative participation of processed foods, such as breads, cold cuts, cookies, soft drinks and precooked meals, increased their participation in the Brazilian diet. The same survey showed that Aracaju, the city where this study was conducted, had a high consumption of cereals, meats, sugars and oils and fats, whereas the consumption of fruits and vegetables was low. However, milk and dairy products were the group with the greatest participation in the diet of this population. Some of our results are similar to those of the national survey.
Some of the socioeconomic characteristics of the popula-tion under study were the low level of parental educapopula-tion and of the per capita family income. Other studies have reported that low levels of parental education, particularly maternal schooling, may contribute signiicantly to food deiciencies and inadequate choices of foods, which may result in serious nutritional deicits in children(29).
1. Bhargava SK, Sachdev HS, Fall CH, Osmond C, Lackshmy R, Barker DJ et al. Relation of serial changes in childhood body-mass index to impaired glucose tolerance in young adulthood. N Engl J Med 2004;350:865-75.
2. Barreto SM, Pinheiro AR, Sichieri S, Monteiro CA, Batista Filho M, Schimidt MI et al. Analysis of the global strategy on diet, physical activity and health of the World Health Organization. Epidemiol Serv Saude 2005;14:41-68. 3. Lobstein T, Jackson-Leach R. Estimated burden of paediatric obesity and
co-morbidities in Europe. Part 2. Numbers of children with indicators of obesity-related disease. Int J Pediatr Obes 2006;1:33-41.
4. Krebs-Smith SM, Cook A, Subar AF, Cleveland L, Friday J, Kahle LL. Fruit and vegetable intakes of children and adolescents in the United States. Arch Pediatr Adolesc Med 1996;150:81-6.
5. Triches RM, Giugliani ER. Obesity, eating habits and nutritional knowledge among school children. Rev Saude Publica 2005;39:541-7.
6. Mondini L, Levy RB, Saldiva SR, Venâncio SI, de Azevedo Aguiar J, Stefanini ML.
Overweight, obesity and associated factors in irst grade schoolchildren in a city of
the metropolitan region of São Paulo, Brazil. Cad Saude Publica 2007;23:1825-34. 7. Barbosa RM, Carvalho CG, Franco VC, Salles-Costa R, Soares EA. Food intake assessment of children attending a philanthropic daycare center in the Ilha de Paquetá, Rio de Janeiro, Brazil. Rev Bras Saude Mater Infant 2006;6:127-34.
8. Castro TG, Novaes JF, Silva MR, Costa NM, Franceschini SC, Tinôco AL et al. Characteristics of dietary intake, socioeconomic environment and nutritional status preschoolers at public kindergartens. Rev Nutr 2005;18:321-30. 9. Barbosa RM, Croccia C, Carvalho CG, Franco VC, Salles-Costa R, Soares
EA. Food intake by children based on the Brazilian food guide pyramid for young children. Rev Nutr 2005;18:633-41.
10. Saldiva SR, Escuder MM, Mondini L, Levy RB, Venâncio SI. Feeding habits of children aged 6 to 12 months and associated maternal factors. J Pediatr (Rio J) 2007;83:53-8.
11. Oliveira CL, Fisberg M. Obesidade na infância e adolescência - uma verdadeira epidemia.Arq Bras Endocrinol Metab 2003;47:107-8.
12. Rinaldi AE, Pereira AF, Macedo CS, Mota JF, Burini RC. Feeding practices and physical inactivity contributions to childhood overweight. Rev Paul Pediatr 2008;26:271-7.
13. World Health Organization. Complementary feeding of young children in developing countries. Geneva: WHO; 1998.
14. Giugliani ER, Victoria CG. Complementary feeding. J Pediatr (Rio J) 2000;76 (Suppl 3):S253-62.
15. Ramos M, Stein LM. Development children’s eating behavior. J Pediatr (Rio J) 2000;76 (Suppl 3):S229-37.
16. Fidelis CM, Osório MM. Dietary intake of macro and micronutrients by children
under ive years of age in the state of Pernambuco, Brazil. Rev Bras Saude
Mater Infant 2007;7:63-74.
17. Nicklas T, Johnson R; American Dietetic Association. Position of the American Dietetic Association: dietary guidance for healthy children ages 2 to 11 years. J Am Diet Assoc 2004;104:660-77.
18. Philippi ST, Cruz AT, Colucci AC. Food guide pyramid for young children 2 to 3 years old. Rev Nutr 2003;16:5-19.
19. Brasil. Ministério da Saúde. Secretária de Política de Saúde; Organização Pan-americana de Saúde. Guia alimentar para crianças menores de 2 anos. Brasília: Ministério da Saúde; 2002.
20. Philippi ST, Latterza AR, Szarfarc SC. Virtual Nutri Plus – versão 2.0 for Windows [software]. São Paulo (SP): Universidade de São Paulo; 2008.
use only one recall because of the constant mobility of the population and the dificulty in making a second contact with parents or guardians. We believe that the intrapersonal diet variation in this population may be small because of the food monotony observed; therefore, our data may relect a habitual eating pattern among the children included in the study. Another limitation is the fact that a convenience sample was used, as this type of sampling may reduce the validity of conclusions and make it dificult to generalize indings for other populations.
The results of this study suggest that the children seen in the Basic Healthcare Units of Aracaju have an insuficient consumption of vegetables, fruits and milk and dairy prod-ucts and an excessive consumption of sugars and sweets. When the different age groups were compared, infants in their irst year of life had a consumption below the recom-mended levels for fruits, meat and eggs and legumes, and children in their third year of life had an excessive consump-tion of cereals, sugars and sweets and oils and fats.
The nutritional inadequacies found in the group of chil-dren included in this study suggest the need to promote
educational interventions for healthy eating habits. Such interventions may be conducted in schools and in the nutritional services of the public healthcare network, respecting the speciicities of each age group. The early establishment of healthy eating habits has an important role in the prevention of nutritional disorders, such as obesity and, consequently, of chronic noncommunicable diseases and speciic nutritional deiciencies.
Acknowledgments
We thank the children that participated in this study and their parents and guardians; the Head of the Municipal Department of Health of Aracaju for granting permission to conduct this study in the Basic Healthcare Units; and the inancing bodies, Fundação de Apoio à Pesquisa e à Inovação Tecnológica of the state of Sergipe (FAPITEC) and the Programa de Auxílio à Integração de Docentes e Técnicos Administrativos Recém Doutores às Atividades de Pesquisa (PAIRD/UFS).
21. Pinheiro AB, Lacerda EM, Benzecry EH, Gomes MC, Costa VM. Tabela para avaliação de consumo alimentar em medidas caseiras. 5th ed. São Paulo: Atheneu; 2005.
22. Hadler MC, Juliano Y, Sigulem DM. Anemia in infancy: etiology and prevalence. J Pediatr (Rio J) 2002;78 (Suppl 4):321-6.
23. Osório MM. Determinant factors of anemia in children. J Pediatr (Rio J) 2002;78:269-78.
24. Oliveira LP, Assis AM, Pinheiro SM, Prado MS, Barreto ML. Complementary
feeding in the irst two years of life. Rev Nutr 2005;18:459-69.
25. Marinho MC, Hamann EM, Lima AC. Behavioral changes in food intake practices in the population of Brasília, Federal District, Brazil. Rev Saude Mater Infant 2007;7:251-61.
26. Simon VG, Souza JM, Souza SB. Breastfeeding, complementary feeding, overweight and obesity in pres-school children. Rev Saude Publica 2009;43:60-9.
27. López MJ, Valdés LA. Anorexia en la infancia. Rev Cubana Pediatr 2002;74:213-21.
28. Brasil. Ministério do Planejamento, Orçamento e Gestão; Ministério da Saúde;
Instituto Brasileiro de Geograia e Estatística. Pesquisa de orçamentos
familiares (POF) 2008-2009: avaliação nutricional da disponibilidade domiciliar de alimentos no Brasil. Rio de Janeiro: IBGE; 2010.