Disruptions in Resting State Functional
Connectivity and Cerebral Blood Flow in Mild
Traumatic Brain Injury Patients
Chandler Sours1,2*, Jiachen Zhuo1,2, Steven Roys1,2, Kathirkamanthan Shanmuganathan2, Rao P. Gullapalli1,2
1Magnetic Resonance Research Center, University of Maryland School of Medicine, Baltimore, Maryland, United States of America,2Department of Diagnostic Radiology & Nuclear Medicine, University of Maryland School of Medicine, Baltimore, Maryland, United States of America
*csours001@umm.edu
Abstract
Mild traumatic brain injury (mTBI) is often occult to conventional imaging techniques. How-ever, there is growing evidence that mTBI patients who lack evidence of structural intracra-nial injury may develop post-concussive syndrome (PCS). We investigated longitudinal alterations in resting state functional connectivity (rs-FC) in brain networks in a population of 28 patients compared to 28 matched control participants. Rs-FC and cerebral blood flow (CBF) within the nodes of the Default Mode Network (DMN) and Task Positive Network (TPN) were assessed at three time points including acute, sub-acute, and chronic stages following mTBI. Participants received the Automated Neuropsychological Assessment Met-rics (ANAM) to assess cognitive performance. Main findings indicate that despite normal-ized cognitive performance, chronic mTBI patients demonstrate increased rs-FC between the DMN and regions associated with the salience network (SN) and TPN compared to the control populations, as well as reduced strength of rs-FC within the DMN at the acute stage of injury. In addition, chronic mTBI patients demonstrate an imbalance in the ratio of CBF between nodes of the DMN and TPN. Furthermore, preliminary exploratory analysis sug-gests that compared to those without chronic PCS, patients with chronic PCS reveal an imbalance in the ratio of CBF between the DMN nodes and TPN nodes across multiple stages of recovery. Findings suggest that the altered network perfusion with the associated changes in rs-FC may be a possible predictor of which mTBI patients will develop chronic PCS.
Introduction
Traumatic brain injury (TBI) is one of the most prevalent neurological disorders in the United States, resulting in a large emotional burden on patients and a vast financial burden on the nation. The Center for Disease Control (CDC) estimates that there are 1.7 million cases of TBI each year [1]. Although greater than 75% of these injuries are considered mild, many of these OPEN ACCESS
Citation:Sours C, Zhuo J, Roys S,
Shanmuganathan K, Gullapalli RP (2015) Disruptions in Resting State Functional Connectivity and Cerebral Blood Flow in Mild Traumatic Brain Injury Patients. PLoS ONE 10(8): e0134019. doi:10.1371/journal. pone.0134019
Editor:Linda Chao, University of California, San Francisco, UNITED STATES
Received:January 22, 2015
Accepted:July 3, 2015
Published:August 4, 2015
Copyright:© 2015 Sours et al. This is an open access article distributed under the terms of the
Creative Commons Attribution License, which permits unrestricted use, distribution, and reproduction in any medium, provided the original author and source are credited.
Data Availability Statement:The neuroimaging and neuropsychological data have been uploaded to the FITBIR database as part of Dr. Gullapalli's MagNeT Study. The website ishttps://fitbir.nih.govand once an account is requested and approved by FITBIR, the data can be accessed by searching for the MagNeT Study.
patients have poor long-term outcomes[2]. One of the most common types of damage induced by TBI is diffuse axonal injury (DAI), which is commonly missed by conventional CT and MR imaging especially in mild cases [3,4]. This makes it challenging to predict which of these indi-viduals will go on to suffer from persistent symptoms following the initial injury [5], a condi-tion known as post-concussive syndrome (PCS) [6,7].
Therefore, further investigation of advanced neuroimaging techniques to better characterize mild TBI (mTBI) is needed. One possible technique is resting state functional MRI, which can be used to characterize the interactions both within and between various neural networks. This interaction is calculated by determining functional connectivity, which can be defined as“the temporal correlation of a neurophysiological index measured in different brain areas”[8]. Two common resting state networks are the Default Mode Network (DMN) and the Task Positive Network (TPN), also referred to as the executive network. The DMN is a network of regions that is consistently deactivated, or“turned off”during task-related activities but demonstrates increased activity during resting conditions [9]. The DMN represents internally directed, self-reflective processes [10] and includes the posterior cingulate cortex (PCC), lateral parietal cor-tex (LPC), anterior cingulate corcor-tex (ACC), and medial prefrontal corcor-tex (MPFC) [11,12]. In contrast, the TPN is recruited during externally directed behavior and includes the bilateral dorsolateral prefrontal cortex (DLPFC) and posterior parietal cortex [13].
In ideal conditions, it has been shown that these two networks are anti-correlated at rest, which is represented by a negative resting state functional connectivity (rs-FC) [12]. It has been further suggested that the failure to adequately suppress activity of the DMN during cog-nitively demanding tasks results in a state of mind wandering or inattention, therefore, hinder-ing task performance[14]. Termed the Default Mode Interference Hypothesis, support for this theory results from studies in healthy volunteers where momentary lapses in attention were associated with a reduction in task induced deactivations of the DMN [15]. Furthermore, this balance between activation of the TPN and deactivation of the DMN during a task has been shown to be disrupted in multiple conditions with cognitive deficits similar to those of mTBI, including healthy aging [16,17], sleep deprivation [18], schizophrenia [19], attention deficit and hyperactivity disorder [20], post traumatic stress disorder (PTSD) [21], and sub-acute mTBI [22]. Additional data suggest that the modulation of the TPN and DMN is mediated by a third network, the Salience Network (SN) [23–25]. Given these findings, we propose that this imbalance in internally versus externally directed mental processes present during resting con-ditions may contribute to long-term PCS experienced by a subset of mTBI patients.
TBI has been shown to reduce rs-FC in multiple networks including interhemispheric rs-FC [26–28], the motor network [29], the TPN [30–32], and the DMN [30,33–37]. In addition, recent data suggests that there is increased rs-FC between the DMN and TPN in mTBI popula-tions [30] and specifically in mTBI patients with self-reported memory complaints [38]. How-ever, it is not clear whether in vivo changes in resting state conditions may be the result of altered neurovascular coupling, altered perfusion patterns as a result of structural damage induced by DAI, or are truly the result of changes in neural activity [39]. In TBI, these vascular changes may be induced by the breakdown of the blood brain barrier known to occur after injury [40]. Furthermore, the secondary injury cascade associated with TBI including reduced energy and glucose metabolism, increased inflammatory response, increased oxidative stress [40], and the diffuse reactive astrogliosis [41] may all be the result of an altered regional brain perfusion.
Using SPECT imaging, it has been shown that symptomatic mTBI patients demonstrate reduced regional CBF in the frontal, prefrontal, and temporal cortices in the chronic stage of injury (greater than two years post injury) [42]. While CT perfusion, SPECT imaging, and dynamic susceptibility contrast perfusion imaging [43] have been used in TBI research for The funders had no role in study design, data
collection and analysis, decision to publish, or preparation of the manuscript.
years, the arterial spin labeling (ASL) technique to measure brain perfusion has only recently been applied to TBI in both human populations and animal models. ASL is a non-invasive technique that uses protons in the arterial blood as an endogenous contrast agent eliminating the need for an exogenous contrast agent such as gadolinium. In a rodent lateral fluid percus-sion model of TBI, Hayward and colleagues noted increased regional CBF in the thalamus at the chronic stage that was positively correlated with increased vessel density in this region [44]. This increased vessel density within the thalamus was associated with reduced performance on the Morris water maze, suggesting that altered regional perfusion influences chronic cognitive performance. Furthermore, severe TBI patients show a global hypoperfusion at rest including regions of the posterior cingulate cortex (PCC), thalamus and disperse frontal regions [45]. In contrast to the animal studies [44], mTBI patients demonstrate reduced resting CBF in the thalamus, which was associated with reduced performance on measures of neurocognitive functioning [45]. Given the above findings, we hypothesize that information from resting state CBF changes in the mTBI population can potentially supplement the interpretation of infor-mation obtained from the rs-FC analyses. While regional alterations in perfusion are noted fol-lowing mTBI, modifications in the perfusion of specific networks are rarely assessed folfol-lowing trauma. Evidence exists demonstrating that during resting conditions, perfusion within the DMN is significantly higher than perfusion within the TPN among normal populations [46]. To our knowledge this balance of resting CBF within the TPN and DMN has not been investi-gated in an mTBI population in the context of the DMN Interference Hypothesis. Understand-ing the CBF changes in the context of changes in the network connectivity may provide further insights into the pathophysiology of mTBI.
In this study we followed a group of mTBI patients across the acute, sub-acute, and chronic stages of injury in order to investigate longitudinal changes in rs-FC within and between the DMN and TPN compared to control participants. In addition, we assessed whether mTBI patients exhibit alterations in the balance of resting perfusion within the DMN and TPN com-pared to control participants across the first 6 months following injury.
Materials and Methods
Ethics Statement
This study was approved by the International Review Board at the University of Maryland and all participants provided written informed consent and HIPAA compliance.
Participants
patients had LOC, 3/28 patients did not have LOC. Data regarding LOC for the remaining 7 patients was unavailable due to the fact that no other individuals were present during the acci-dent. However, of these 7 patients, they either had a positive head CT (n = 1) or noted altered mental status (n = 6) when the first responders arrived.
For the analysis presented in this manuscript, only participants who completed longitudinal resting state fMRI across the three time points of interest were included resulting in a final patient population of 28 mTBI patients (38.9+/-15.9yrs, 18M:10F). Individual patient clinical characteristics, mechanisms of injury, and CT and MRI interpretation by board certified trauma radiologist (K.S.) are shown inS1 Table. Presence of intracranial injury on MRI was determined by the examination of conventional MR images (T1, T2, FLAIR, and SWI). Five out of the 28 patients had either CT abnormalities while one additional patient had evidence of MRI abnormalities not noted on the convention CT, resulting in 6 mTBI patients with noted intracranial injury. Twenty-eight neurologically intact participants (39.25+/-17.2yrs, 16M:12F) that were age and education matched served as the control population. Participant demo-graphic information is shown inTable 1.
All 28 mTBI patients received rs-fMRI at three time points. An initial stage (referred to as acute stage) within 11 days (average 6 +/-3 days, range 1–11 days), a sub-acute stage approxi-mately 1 month post injury (average 36 +/-13 days, range 25–88 days), and a chronic stage (average 198 +/-26 days, range 137–266 days). At each time point the patients also received a resting state perfusion scan, using the pulsed arterial spin labeling technique (PASL). However, due to motion artifacts (translation greater than 3mm or rotation greater than 3 degrees), rest-ing state data from 1 patient at the acute stage was excluded from analysis, and PASL data from 2 patients at the acute stage and 2 patients at the sub-acute stage were excluded from analysis. The 28 control participants received rs-fMRI and PASL scans at a single time point.
In an exploratory analysis, mTBI patients were further subdivided into two cohorts of those with and without PCS at the chronic stage based on self-reported symptoms on the Modified Rivermead Post-Concussion Symptoms Questionnaire (RPQ) [48]. The RPQ asks participants to rate a series of common symptoms following TBI on a scale of 0–4. Based on the Interna-tional Classification of Disease tenth revision (ICD10) symptom criteria for PCS we defined PCS as reporting 3 or more of the following symptoms lasting for greater than three months: headaches, dizziness, sleep disturbances, trouble concentrating, fatigue, memory problems, and irritability at the chronic stage [49]. Twelve of the mTBI patients qualified as having PCS at 6 months while 16 did not qualify as having PCS.
Resting state fMRI data from a subset of this patient population has previously been pub-lished investigating the association between imaging findings and memory complaints (n = 16 at the sub-acute stage) [38] as well the associations between interhemispheric functional con-nectivity and cognitive performance (n = 18 at the acute and sub-acute stage of injury) [28]. Table 1. Participant Demographics.
N Age Sex Education Days Acute Days Sub-Acute Days Chronic +CT +MR
Control 28 39.3±17.2 16M: 12F 14.7±2.2 NA NA NA NA NA
mTBI 28 38.9±15.9 18M: 10F 13.9±2.7 6±3 36±13 198±26 5/28 6/28
PCS 12 46.3±14.1* 6M: 6F 13.3±2.1 7±3 35±8 196±23 2/12 3/12
No PCS 16 33.3±15.3* 12M: 4F 14.3±3.0 6±3 36±15 199±29 3/16 3/16
*p<0.05 based on independent t-tests
Neuropsychological Assessment
Patients underwent neuropsychological assessment at all three visits. However, due to the clini-cal condition or presence severe of post-concussive symptoms at time of the MRI, only 19 of the 28 mTBI patients at the acute stage and 27 out of the 28 mTBI patients at the sub-acute stage completed the neuropsychological assessment. One control participant declined partici-pation in the neuropsychological assessment resulting a control population of 27 participants for the neuropsychological assessment. Imaging data was included in the analysis for this control participant. Due to the possible selection bias caused by one third of the mTBI patients lacking neuropsychological testing at the initial stage, we have excluded analysis of behavioral data for the acute time point. The level of cognitive functioning was assessed by the administra-tion of the Mini Mental State Exam (MMSE) and Military Acute Concussion Evaluaadministra-tion (MACE) [50] at each visit. Global life satisfaction was assessed using Satisfaction with Life Scale (SWLS) [51]. Patient outcome was assessed by the Glasgow Outcome Scale Extended (GOSE) [52] and Disability Rating Scale (DRS) [53] at 6 months.
The ANAM battery consists of seven subtests assessing processing speed, memory, and attention. The specific subtests included in this battery are the code substitution (CS), code substitution delayed (CSD), match to sample (MTS), math processing (MATH), procedural reaction time (PRT), simple reaction time (SRT), simple reaction time repeat (SRT2) [54]. From each subtest, an individual throughput score is calculated which is a single measure encompassing both accuracy and reaction time. Specifically, the throughput score is the num-ber of correct responses per total amount of time a participant took to respond for each trial, expressed as the number of correct responses per minute [55]. We opted to examine a weighted throughput score (WT-TH), which has previously been referred to as an Index of Cognitive Efficiency [56]. The WT-TH was determined as an overall measure of performance on the ANAM and is given as WT-TH = (CS4.35+CSD5+MTS6.63+MATH8.37+PRT2.18+
SRT+SRT2)/7.
MR Data Acquisition
All imaging was performed on a Siemens Tim-Trio 3T MRI scanner using a 12 channel receive only head coil. A high resolution T1-MPRAGE (TE = 3.44 ms, TR = 2250 ms, TI = 900 ms, flip angle = 9°, resolution = 256 × 256 × 96, FOV = 22 cm, sl. thick. = 1.5 mm) was acquired for anatomic reference with slices parallel to the anterior and posterior commissure points (AC-PC). For the rs-fMRI scan, T2-weighted images were acquired using a single-shot EPI
sequence (TE = 30 ms, TR = 2000 ms, FOV = 230 mm, resolution = 64 × 64) with 36 axial slices (sl. thick. = 4 mm) over 5 min 42 seconds that yielded 171 volumes. The perfusion scan used the pulsed arterial spin labeling (PASL) technique based on single-shot EPI readout (TE = 11ms, TR = 2500ms, FOV = 230mm, resolution = 64×64) with 16 slices (sl. thick. = 5mm with 1mm gap) to cover the central portion of the brain with the spatial location of these slices matching the structural images. Forty-five pairs of labeled and control volumes were acquired following the initial acquisition of the constant equilibrium magnetization (M0) vol-ume. The PASL imaging data was taken over 3 min and 57 seconds. During the resting state scans, participants were instructed to rest peacefully with eyes closed.
Data Analysis
series were directly spatially normalized to standard space using the Montreal Neurological Institute (MNI) templates available in SPM 8. The T1 template was used for normalization of the T1-MPRAGE and the EPI template was used for the normalization of the resting state time series. The SPM normalization step uses the normalized mutual information to calculate the optimum 12-parameter affine transformation (3 translations, 3 rigid-body rotations, 3 shears, and 3 zooms) to match the size and position of the images. The resting state series was resam-pled to a spatial resolution of 2.0 mm isotropic. Spatial smoothing was then applied to the rest-ing state data usrest-ing a 5 mm Gaussian kernel. Individual T1-MPRAGE images in MNI space were segmented into white matter (WM), gray matter (GM) and cerebral spinal fluid (CSF). The segmented masks thus created were used to account for time series variance from the non-neuronal contributions of CSF and WM. The mean BOLD time series from the WM mask, CSF mask, and the 6 motion correction parameters were included in the model as regressors to remove the variance related to non-neuronal contributions and motion.
Resting State Voxel-based Analysis. The CONN-fMRI Functional Connectivity toolbox v13.h (http://www.nitrc.org/projects/conn) was used to process the resting state data and create average group networks for the DMN and the TPN. For the DMN, the reference time series was selected from a 5mm spherical region of interest (ROI) in the posterior cingu-late cortex (PCC) centered at (-5,-53,41) on the MNI tempcingu-late based on [12]. For the TPN, we selected two reference time series from bilateral 5mm spheres in the DLPFC centered at (-42,34,20) and (44,36,20) [12]. The mean BOLD time series for the above seed ROIs were extracted and correlated with the time series of each voxel within the entire brain. For the TPN, the time series from the right and left DLPFC were averaged before correlating with each vox-el’s time series from the entire brain. Correlations were converted to normalized z-scores within the CONN-fMRI functional connectivity toolbox prior to further analysis.
Within group rs-FC maps of the DMN and TPN were created using SPM8. Positive func-tional connectivity maps were thresholded at a voxel wisep-value of 0.001 (uncorrected) and
cluster extent threshold ofp-value of 0.001 using a family wise error correction for multiple
comparisons. Voxel wise functional connectivity maps were made separately for the control group, and the mTBI groups at each of the three time points. All between group contrast maps were created and were thresholded at voxel wisep-value of 0.005 (uncorrected) and
cluster extent threshold ofp-value of 0.05 using a family wise error correction for multiple
comparisons.
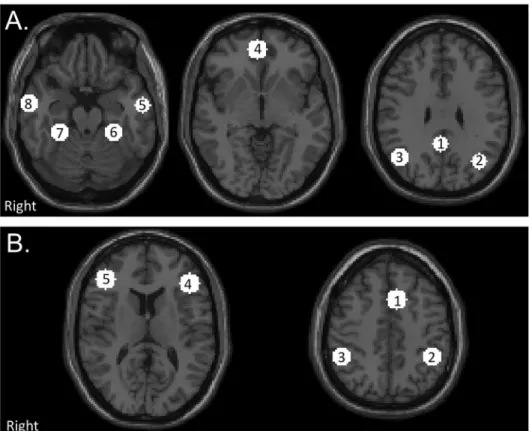
Resting State ROI-based Analysis. ROIs were created using a 10mm sphere centered at the peak voxel of each significantly correlated cluster for the DMN and TPN based the voxel wise group connectivity maps of the of an independent control group [57] created using identi-cal ROIs to the voxel-based analysis performed in this present analysis. The DMN and TPN ROIs are shown inFig 1. Coordinates of ROIs are presented inS2 Table. For each participant, the average time series was extracted from each ROI and pairwise correlations matrices were created. Average correlations matrices were created for the control group, and the mTBI group at each visit (acute, sub-acute, and chronic). Within network connectivity was determined by calculating the average of the pairwise connectivity measures for the 8 DMN ROIs (DMN rs-FC) and the average of the pairwise connectivity measures for the 5 TPN ROIs (TPN rs-rs-FC). Between network connectivity was determined by calculating the average of the pairwise con-nectivity measure between the 8 DMN ROIs and the 5 TPN ROIs (DMN-TPN rs-FC).
match the control images. The motion corrected control and time-shifted labeled images were then pair-wise subtracted and averaged to produce the mean perfusion-weighted image. CBF maps were estimated from the mean perfusion-weighted image and the M0 image based on formulas provided in [58] (units of mL/100g/min). Next, the T1-MPRAGE in native space was normalized to MNI space using the SPM normalization process using the 12-parameter affine transformation. The T1-MPRAGE in native space was coregistered to the ASL data in native space using the SPM coregistration process using a 12-parameter affine transformation. The DMN and TPN ROIs generated from the resting state analysis were transformed from MNI space to native ASL space via a two-step process. First the MNI space ROIs were transformed to native space and registered to the T1-MPRAGE using the inverse of the transformation matrix from the T1-MPRAGE to MNI space normalization step. Second the transformation from the coregistration of the T1-MPRAGE to the ASL space was applied to the ROIs, effec-tively registering the MNI space ROIs to native ASL space for subsequent analysis. All registra-tions were visually assessed to ensure proper registration. A gray matter (GM) mask from segmentation of the T1-MPRAGE was used to mask each ROI from which the GM CBF values were obtained for each ROI. Average CBF values for the DMN and TPN as well as a CBF ratio (TPN CBF/DMN CBF) were calculated.
Fig 1. Location of network regions of interests (ROIs).(A) Default Mode Network (DMN). 1) PCC Posterior cingulate cortex (PCC) 2) Left Lateral Parietal (LLP) 3) Right Lateral Parietal (RLP) 4) Medial Prefrontal Cortex (MPFC) 5) Left Inferior Temporal Gyrus (L ITG) 6) Right Inferior Temporal Gyrus (R ITG) 7) Left Medial Temporal Lobe (L MTL) 8) Right Medial Temporal Lobe (R MTL). (B) Task Positive Network (TPN). 1) Premotor Area (PM) 2) Left Supramarginal Gyrus (L SMG) 3) Right Supramarginal Gyrus (R SMG) 4) Left Dorsolateral Prefrontal Cortex (L DLPFC) 5) Right Dosolateral Prefrontal Cortex (R DLPFC). Networks consists of 10 mm spherical ROIs centered around the peak correlated voxel with the PCC for the DMN and the bilateral DLPFC for the TPN from the results of an independent control group thresholded at a voxel wise
p-value of 0.001 (uncorrected) and cluster extent threshold ofp-value of 0.001 (FWE).
Statistical Analysis
Differences in demographic characteristics between the control group and mTBI group were determined using unpaired t-tests. Group differences in measures of rs-FC (DMN rs-FC, TPN rs-FC, and DMN-TPN rs-FC) and rs-CBF (DMN CBF, TPN CBF, and CBF ratio) between the control group and mTBI group were tested using analysis of covariance (ANCOVAs) consider-ing age as a covariate at each time point (acute, sub-acute, and chronic) separately. Longitudi-nal changes in imaging measures (rs-FC and rs-CBF measures) within the first 6 months following mTBI were determined using repeated measures analysis of covariance (ANCOVAs) considering age as a covariate with visit as the within group variable (acute, sub-acute, or chronic) implemented in SPSS. Longitudinal changes in neuropsychological measures within the first 6 months following mTBI were determined using repeated measures ANCOVAs con-sidering age as a covariate with visit as the within group variable (sub-acute or chronic) imple-mented in SPSS. Within group differences between DMN CBF and TPN CBF were calculated using paired t-tests. Results shown are uncorrected for multiple comparisons.
Results
Participants
Table 1summarizes the demographic information for the study and control groups. There were no differences between the mTBI group and control group in age (p = 0.98), sex (p = 0.59), or years of education (p = 0.19). There were no differences between the mTBI group with and with-out chronic PCS in sex (p = 0.18), education (p = 0.31), and days post injury (acute: p = 0.50; sub-acute: p = 0.83; and chronic p = 0.75). In addition, the two groups had similar percentages of CT or MR positive patients (19% CT/MR positive in no PCS group vs 25% CT/MR positive in PCS group). The PCS group was however older than the group without PCS (p = 0.030)
Neuropsychological Assessment
Cross Sectional Analysis. Both the control group and mTBI group at sub-acute and chronic time points performed similarly on the MACE (sub-acute: p = 0.73; chronic: p = 0.76). There were no differences in ANAM performance as measured by the WT-TH between the control group and mTBI group at either time point (sub-acute: p = 0.40; chronic: p = 0.46). There were no differences in global life satisfaction as measured with the SWLS between the mTBI and control group at the sub-acute (p = 0.352) or chronic (p = 0.453) stages of injury.
MTBI Longitudinal Analysis. There were no longitudinal differences between the sub-acute and chronic time points in the mTBI group for the MACE (F = 0.003; p = 0.956), ANAM performance (F = 0.496; p = 0.500), or SWLS (F = 0.087; p = 0.770).
Resting State fMRI-Voxel Based Analysis
Cross Sectional Analysis. Fig 2represents the within group voxel based results for the DMN and the TPN for the control group and the mTBI group across the three visits (Fig 2). Based on threshold of voxel wisep-value of 0.005 (uncorrected) and cluster extent threshold of p-value of 0.05 FWE corrected, mTBI patients did not demonstrate any differences in rs-FC
including the left supramarginal gyrus (L SMG) and dorsal posterior cingulate cortex (dPCC) in the chronic stage (Fig 3A;Table 2), suggesting reduced within DMN rs-FC. Based on voxel wise analysis, mTBI patients did not demonstrate altered rs-FC with the TPN at the acute or sub-acute stages compared to the control group. However, at the chronic stage, mTBI patients had increased rs-FC with the TPN in the anterior prefrontal cortex and dPCC (Fig 3B; Table 2), which are nodes associated with the DMN, once again suggesting increased connec-tivity between the DMN and TPN.
Resting State fMRI-ROI Based Analysis
Cross Sectional Analysis. Average pairwise correlation matrices are shown for the control group (Fig 4A) and the mTBI group at each time point (Fig 4B–4D). These matrices visualize that for each group, the connectivity within each network (top left and bottom right corner of each matrix) is greater than connectivity between the two networks (top right and bottom left corner of each matrix). When the strength of rs-FC within the DMN was calculated, compared to the control group reduced DMN rs-FC was noted in the mTBI group in the acute stage (F = 9.088; p = 0.004) and a trend in reduced DMN rs-FC in the chronic stage (F = 3.027; p = 0.088). No differences in DMN rs-FC were noted in the mTBI group in the sub-acute stage Fig 2. Within group rs-FC maps for control participants and mTBI patients.(A) Default Mode Network (DMN). (B) Task Positive Network (TPN). Maps are thresholded at a voxel wisep-value of 0.001 (uncorrected) and cluster extent threshold ofp-value of 0.001 using a family wise error correction for multiple comparisons.
(F = 0.185; p = 0.669) (Fig 5A). Compared to the control group, mTBI patients did not show altered strength of rs-FC within the TPN at any time point (all p-values>0.500) (Fig 5B). Compared to the control group, mTBI patients showed increased between network connectiv-ity as demonstrated by increased DMN-TPN rs-FC in the acute (F = 2.851; p = 0.097) and chronic (F = 4.200; p = 0.045) stages of injury although it did not reach statistical significance Fig 3. Between group contrast maps for control participants versus mTBI group in the chronic stage.(A) DMN (B) TPN. Warm colors represent regions of increased rs-FC in the mTBI group and cool colors represent regions of reduced rs-FC in the mTBI group. Maps are thresholded at voxel wisep
-value of 0.005 (uncorrected) and cluster extent threshold ofp-value of 0.05 using a family wise error correction for multiple comparisons.
in the acute stage. No differences in DMN-TPN rs-FC were noted in the mTBI group in the sub-acute stage (F = 2.254; p = 0.139) (Fig 5C).
MTBI Longitudinal Analysis. Results of the repeated measures ANCOVAs in the mTBI group failed to detect longitudinal differences in DMN rs-FC (F = 0.443; p = 0.643), TPN rs-FC (F = 1.283; p = 0.282), or DMN-TPN rs-FC (F = 0.529; p = 0.591).
Resting CBF Analysis
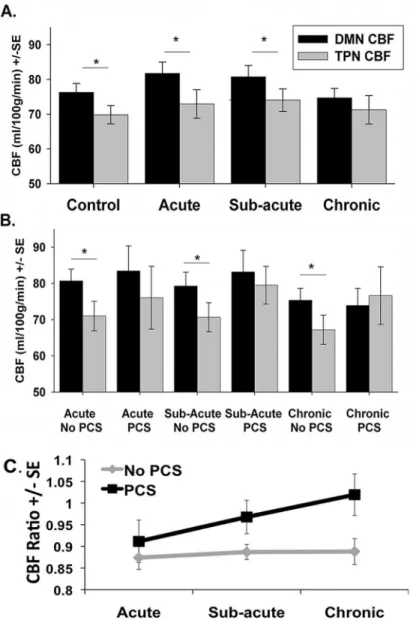
Cross Sectional Analysis. Compared to the control group, there was no group differences in network CBF values for either the DMN CBF or TPN CBF for the mTBI group as a whole at any of the three time points (all p-values>0.050). Furthermore, there were no differences in the CBF ratio between the mTBI group and the control group at any time point. As has been demonstrated by others [46], there was significantly greater DMN CBF than TPN CBF in the control group (p = 0.002). There was also greater DMN CBF compared to TPN CBF in the mTBI population as a whole at the acute stage (p<0.001), and in the sub-acute stage
(p = 0.007) (Fig 6A). However, at the chronic stage, mTBI patients failed to maintain a signifi-cant difference between DMN CBF and TPN CBF (p = 0.452) (Fig 6A).
MTBI Longitudinal Analysis. Results of the repeated measures ANCOVAs in the mTBI group failed to detect longitudinal differences in DMN CBF, TPN CBF, or the CBF ratio.
Exploratory PCS Longitudinal Analysis. There was significantly greater DMN CBF com-pared to the TPN CBF in the mTBI group without PCS at all three time points (acute: p<0.001; sub-acute: p<0.001; chronic: p = 0.004). However, there were no significant differences between the TPN CBF and the DMN CBF in the mTBI group with PCS at any time point (acute: p = 0.106; sub-acute: p = 0.659; chronic: p = 0.195) (Fig 6B).
Based on the results of the repeated measures ANCOVA, there were no between group dif-ferences or within group difdif-ferences for DMN CBF or TPN CBF. For the CBF ratio, there were no significant within group differences (F = 1.050; p = 0.358) or between group differences (F = 2.002; p = 0.171) (Fig 6C).
Discussion
Given the association between rs-FC between the DMN and TPN and cognition in prior stud-ies among both healthy participants and various patient populations [16–20], we predicted that rs-fMRI and perfusion ASL may be a sensitive measure to help distinguish mTBI patients from a control group. Investigating both perfusion ASL and rs-fMRI across three time points Table 2. Voxel wise Group Differences.
Region Abbreviation Coordinates Voxels
DMN
Chronic mTBI>Control Dorsal anterior cingulate/premotor dACC/PM (-4, 22, 34) 1034
Right Insula R In (46, 4, 2) 802
Left Insula L In (-40, 10, 6) 698
Left dorsolateral prefrontal cortex L DLPFC (-32, 46, 36) 414
Chronic mTBI<Control Dorsal posterior cingulate cortex dPCC (8, -52, 38) 415
Left supramarginal gyrus L SMG (-36, -64, 52) 791
TPN
Chronic mTBI>Control Anterior prefrontal cortex APFC (-4, 42, 0) 559
Dorsal posterior cingulate cortex dPCC (10, -36, 36) 535
Acute PCS>no PCS Right angular gyrus R AnG (30, -68, 4) 620
in a mTBI population, we demonstrated for the first time both a shift in network functioning common to all mTBI patients regardless of persistent symptoms, as well as preliminary results suggesting an adjustment in network perfusion within the mTBI population specific to patients with chronic PCS. The findings of this study lead us to three core conclusions. First, while the results failed to detect longitudinal changes in resting state measures within the mTBI popula-tion, the results do show that mTBI patients demonstrate increased rs-FC between the DMN and TPN at the chronic stage but reduced strength of rs-FC within the DMN at the acute stage. Second, chronic mTBI patients fail to maintain the expected balance of resting state per-fusion between the DMN and TPN compared to the control population. Finally, results from
Fig 4. Average correlation matrices.Matrices illustrating both within and between network connectivity values for the DMN and TNP for (A) Controls (B) Acute mTBI (C) Sub-acute mTBI (D) Chronic mTBI. The white boundaries separate the Default Mode Network (DMN) and the Task Positive Network (TPN) regions of interest (from top of matrix to bottom of matrix respectively). The color bar represents z-scores.
Fig 5. Plots of average network resting state connectivity strength.Plots of strength +/- standard error (SE) for control group and mTBI group across three time points. Average strength of network rs-FC for the (A) within Default Mode Network (rs-FC DMN) and (B) within Task Positive Network (TPN) (rs-FC TPN) and (C) between DMN and TPN (rs-FC DMN-TPN). # p<0.1,*p<0.05 compared to the control group based on analysis of covariance.
the exploratory analysis suggest that mTBI patients who develop chronic PCS demonstrate modified network perfusion patterns across all three stages of injury when compared to those who do not develop persistent symptoms.
Cross Sectional rs-FC
While mTBI patients performed similarly to control participants on all of the neuropsychologi-cal assessments, alterations in rs-FC and perfusion pertaining to the nodes of these two net-works were noted mainly during the chronic stage (Fig 3). As previously shown by other groups [34,59], mTBI patients demonstrated a trend in reduced rs-FC within the DMN at the chronic stage (Fig 5A). Furthermore, similar to previous studies that have demonstrated signif-icant reduction in rs-FC in the TBI population shortly after injury [30,33], the mTBI patients
Fig 6. Plots of average network cerebral perfusion flow (CBF).Plots of average network CBF values for the Default Mode Network (DMN) shown in Black and the Task Positive Network (TPN) shown in gray. (A) Average network CBF values for control participants and mTBI group across the three time points. (B) Average network CBF values for post-concussive syndrome (PCS) group and non PCS mTBI group. (C) CBF ratio (TPN CBF/DMN CBF) for the PCS group and non PCS group.*p<0.05 based on paired t-tests.
in this study demonstrated a reduction in DMN rs-FC during the acute stage of injury. How-ever, the mTBI patients in this study failed to demonstrate reductions in DMN rs-FC during the sub-acute stage. This inconsistent findings across studies may be due to differences in time of observation since injury, the inclusion criteria chosen by the various studies as some studies only included mTBI patients with cognitive complaints or post-traumatic symptoms, as well as the variability in the rate of recovery of patients within the first month following mTBI [34]. Furthermore, this variability may be due to the limited sensitivity of the current techniques to measure the subtle injury induced my mTBI. On the other hand, the mTBI group in this study demonstrated increased rs-FC between the DMN and TPN at the chronic stage at the ROI level (Fig 5C). Furthermore, based on the voxel-wise analysis, there is increased rs-FC between the DMN and the L DLPFC node of the TPN as well as between the TPN and the MPFC and dPCC nodes of the DMN (Fig 3).
It is interesting to note that similar to our previous report on sub-acute mTBI patients with memory complaints [38], the chronic mTBI patients demonstrated increased rs-FC between the DMN and the dorsal ACC and bilateral insula (Fig 3A). While the bilateral insula is some-times coactivated with the TPN (Fig 2B) [12], the insula has another role as part of the SN [23]. The main role of the SN is to detect salient sensory stimuli and modulate mental transitions between the TPN and DMN, directing focus internally or externally based on this detected sti-muli [23,25]. Using Granger causality, it has been suggested that the activity in the right ante-rior insula node of the SN precedes activity in the TPN and DMN supporting the notion that the SN modulates the activations and deactivations of the DMN and TPN [24]. The increased rs-FC between the DMN and regions associated with the SN in our patient population suggests an increased need of the SN to modulate activity of a disrupted DMN, leading us to postulate that this may be one of the causes for increased cognitive fatigue in these patients [60].
Cross Sectional ASL Perfusion
in mTBI [14]. The imbalance between these three networks at rest evolves over the course of recovery possibly contributing to the cognitive deficits and persistent symptoms experienced by a significant subset of mTBI patients.
Longitudinal ASL Analysis
While the results do not show longitudinal changes in resting state or perfusion measures for the mTBI group as a whole, to further assess the changes in regional CBF, the mTBI group was further divided into those with and without chronic PCS (defined here as those still experienc-ing significant symptoms at least 6 months followexperienc-ing injury.) While the primary goal was to see how the disruptions between the DMN and TPN affected patient symptoms and cognitive performance, a secondary goal was to investigate alterations in these networks in the acute stage in patients with and without persistent symptoms.
Similar to our findings in the chronic mTBI population as a whole, the mTBI patients experiencing chronic PCS failed to maintain the expected balance between perfusion to the DMN and the TPN (Fig 6B). The TPN nodes show greater perfusion compared to the DMN in the chronic stage in patients experiencing chronic PCS. Furthermore, this alteration in resting perfusion appears in mTBI patients with PCS at all three stages of injury, while those without PCS maintain a similar pattern of network perfusion as the control participants. This finding sug-gests that there may be a unique pattern of network perfusion in mTBI patients in the initial stages of injury, which may be predictive of whom may develop chronic PCS. However, given the difference in age between these two mTBI sub-groups, it is plausible that age has an influence on alterations in networks perfusion following injury. It has been previously reported that older TBI patients are more likely to develop persistent symptoms [63] and our data may suggest that the altered CBF ratio may contribute to this increased likelihood of PCS among older patients. Since this trend in network perfusion is seen across all stages of injury in mTBI patients with chronic PCS, further research is necessary to test and validate such CBF changes as a possible marker for predicting long-term outcome of mTBI patients. Future studies with larger sample size should be designed to separate the effect of age to understand pure mTBI related changes.
Limitations and Future Directions
functional connectivity based off of dynamic CBF measures [66,67] future work probing CBF based functional connectivity within the TBI population is needed to provide a more complete understanding of functional damage induced by this injury. However, in spite of the aforemen-tioned limitations, to our knowledge, this is the first longitudinal analysis across three time points that links the changes in resting state connectivity and an underlying altered resting state perfusion within these networks across multiple stages of injury.
Conclusion
In conclusion, our data indicates an inability of mTBI patients to modulate the balance between the DMN and TPN at rest, as evidenced by alterations in network interactions in rs-FC and network resting perfusion measures across the first 6 months following injury. Our results are novel in that they extend the notion of DMN Interference in a mTBI population to include not only increased rs-FC between the networks, but also alterations in resting network perfusion. While these alterations are present in mTBI patients in the chronic stages, alterations in perfu-sion are present earlier in the acute and sub-acute stages in mTBI patients who suffer from per-sistent symptoms suggestive of distinctive courses of functional recovery in those with and without persistent symptoms. These findings raise the possibility that these resting state mea-sures and altered perfusion may provide additional insight and aid clinicians in predicting the long-term outcomes of patients with mTBI.
Supporting Information
S1 Table. Individual Demographic and Clinical Characteristics.
(DOCX)
S2 Table. MNI coordinates for the Default Mode Network (DMN) and Task Positive Net-work (TPN) regions.
(DOCX)
S3 Table. DMN Clusters for each group.
(DOCX)
S4 Table. TPN Clusters for each group.
(DOCX)
Acknowledgments
The authors would like to thank Joshua Betz, Jacqueline Janowich, Teodora Stoica, and Joseph Rosenberg for their help with patient recruitment, and George Makris for his help with acquir-ing the data.
Author Contributions
Conceived and designed the experiments: CS RPG. Performed the experiments: CS SR JZ. Ana-lyzed the data: CS KS SR. Wrote the paper: CS SR JZ KS RPG.
References
1. Faul M, Xu L, Wald M, Coronado V. Traumatic brain injury in the united states: Emergency department visits, hospitalizations, and deaths. Center of Disease Control. Atlanta, GA. 2010.
3. Iverson GL, Lovell MR, Smith S, Franzen MD. Prevalence of abnormal CT-scans following mild head injury. Brain Inj. 2000; 14: 1057–1061. PMID:11147578
4. Lee H, Wintermark M, Gean A, Ghajar J, Manley G, Mukherjee P. Focal lesions in acute mild traumatic brain injury and neurocognitive outcome: CT versus 3T MRI. 2008; 25: 1049–1056. doi:10.1089/neu.
2008.0566PMID:18707244
5. Kwok FY, Lee TM, Leung CH, Poon WS. Changes of cognitive functioning following mild traumatic brain injury over a 3-month period. Brain Inj. 2008; 22: 740–751. doi:10.1080/02699050802336989
PMID:18787983
6. Williams WH, Potter S, Ryland H. Mild traumatic brain injury and postconcussion syndrome: A neuro-psychological perspective. J Neurol Neurosurg Psychiatry. 2010; 81: 1116–1122. doi:10.1136/jnnp.
2008.171298PMID:20802217
7. Ponsford J, Downing M, Olver J, Ponsford M, Acher R, Carty M, et al. Longitudinal follow-up of patients with traumatic brain injury: Outcome at 2, 5, and 10-years post-injury. J Neurotrauma. 2013.
8. Friston KJ, Frith CD, Liddle PF, Frackowiak RS. Functional connectivity: The principal-component anal-ysis of large (PET) data sets. J Cereb Blood Flow Metab. 1993; 13: 5–14. PMID:8417010
9. Raichle ME, MacLeod AM, Snyder AZ, Powers WJ, Gusnard DA, Shulman GL. A default mode of brain function. Proc Natl Acad Sci U S A. 2001; 98: 676–682. PMID:11209064
10. Gusnard DA, Akbudak E, Shulman GL, Raichle ME. Medial prefrontal cortex and self-referential mental activity: Relation to a default mode of brain function. Proc Natl Acad Sci U S A. 2001; 98: 4259–4264.
PMID:11259662
11. Greicius MD, Krasnow B, Reiss AL, Menon V. Functional connectivity in the resting brain: A network analysis of the default mode hypothesis. Proc Natl Acad Sci U S A. 2003; 100: 253–258. PMID:
12506194
12. Fox MD, Snyder AZ, Vincent JL, Corbetta M, Van Essen DC, Raichle ME. The human brain is intrinsi-cally organized into dynamic, anticorrelated functional networks. Proc Natl Acad Sci U S A. 2005; 102: 9673–9678. PMID:15976020
13. D'Esposito M. From cognitive to neural models of working memory. Philos Trans R Soc Lond B Biol Sci. 2007; 362: 761–772. PMID:17400538
14. Sonuga-Barke EJ, Castellanos FX. Spontaneous attentional fluctuations in impaired states and patho-logical conditions: A neurobiopatho-logical hypothesis. Neurosci Biobehav Rev. 2007; 31: 977–986. PMID:
17445893
15. Weissman DH, Roberts KC, Visscher KM, Woldorff MG. The neural bases of momentary lapses in attention. Nat Neurosci. 2006; 9: 971–978. PMID:16767087
16. Prakash RS, Heo S, Voss MW, Patterson B, Kramer AF. Age-related differences in cortical recruitment and suppression: Implications for cognitive performance. Behav Brain Res. 2012; 230: 192–200. doi:
10.1016/j.bbr.2012.01.058PMID:22348896
17. Sambataro F, Murty VP, Callicott JH, Tan HY, Das S, Weinberger DR, et al. Age-related alterations in default mode network: Impact on working memory performance. Neurobiol Aging. 2010; 31: 839–852.
doi:10.1016/j.neurobiolaging.2008.05.022PMID:18674847
18. De Havas JA, Parimal S, Soon CS, Chee MW. Sleep deprivation reduces default mode network con-nectivity and anti-correlation during rest and task performance. Neuroimage. 2012; 59: 1745–1751. doi:
10.1016/j.neuroimage.2011.08.026PMID:21872664
19. Woodward ND, Rogers B, Heckers S. Functional resting-state networks are differentially affected in schizophrenia. Schizophr Res. 2011; 130: 86–93. doi:10.1016/j.schres.2011.03.010PMID:21458238 20. Castellanos FX, Margulies DS, Kelly C, Uddin LQ, Ghaffari M, Kirsch A, et al. Cingulate-precuneus
interactions: A new locus of dysfunction in adult attention-deficit/hyperactivity disorder. Biol Psychiatry. 2008; 63: 332–337. PMID:17888409
21. Daniels JK, McFarlane AC, Bluhm RL, Moores KA, Clark CR, Shaw ME, et al. Switching between exec-utive and default mode networks in posttraumatic stress disorder: Alterations in functional connectivity. J Psychiatry Neurosci. 2010; 35: 258–266. PMID:20569651
22. Mayer AR, Yang Z, Yeo RA, Pena A, Ling JM, Mannell MV, et al. A functional MRI study of multimodal selective attention following mild traumatic brain injury. Brain Imaging Behav. 2012; 6: 343–354. doi:
10.1007/s11682-012-9178-zPMID:22673802
23. Seeley WW, Menon V, Schatzberg AF, Keller J, Glover GH, Kenna H, et al. Dissociable intrinsic con-nectivity networks for salience processing and executive control. J Neurosci. 2007; 27: 2349–2356.
PMID:17329432
24. Sridharan D, Levitin DJ, Menon V. A critical role for the right fronto-insular cortex in switching between central-executive and default-mode networks. Proc Natl Acad Sci U S A. 2008; 105: 12569–12574. doi:
25. Menon V, Uddin LQ. Saliency, switching, attention and control: A network model of insula function. Brain Struct Funct. 2010; 214: 655–667. doi:10.1007/s00429-010-0262-0PMID:20512370 26. Marquez de la Plata CD, Garces J, Shokri Kojori E, Grinnan J, Krishnan K, Pidikiti R, et al. Deficits in
functional connectivity of hippocampal and frontal lobe circuits after traumatic axonal injury. Arch Neu-rol. 2011; 68: 74–84. doi:10.1001/archneurol.2010.342PMID:21220676
27. Slobounov SM, Gay M, Zhang K, Johnson B, Pennell D, Sebastianelli W, et al. Alteration of brain func-tional network at rest and in response to YMCA physical stress test in concussed athletes: RsFMRI study. Neuroimage. 2011; 55: 1716–1727. doi:10.1016/j.neuroimage.2011.01.024PMID:21255654 28. Sours C, Rosenberg J, Kane R, Roys S, Zhuo J, Shanmuganathan K, et al. Associations between
inter-hemispheric functional connectivity and the automated neuropsychological assessment metrics (ANAM) in civilian mild TBI. Brain Imaging Behav. 2014.
29. Kasahara M, Menon DK, Salmond CH, Outtrim JG, Taylor Tavares JV, Carpenter TA, et al. Altered functional connectivity in the motor network after traumatic brain injury. Neurology. 2010; 75: 168–176.
doi:10.1212/WNL.0b013e3181e7ca58PMID:20625170
30. Mayer AR, Mannell MV, Ling J, Gasparovic C, Yeo RA. Functional connectivity in mild traumatic brain injury. Hum Brain Mapp. 2011; 32: 1825–1835. doi:10.1002/hbm.21151PMID:21259381
31. Shumskaya E, Andriessen TMJC, Norris DG, Vos PE. Abnormal whole-brain functional networks in homogeneous acute mild traumatic brain injury. Neurology. 2012; 79: 176–182.
32. Hillary FG, Slocomb J, Hills EC, Fitzpatrick NM, Medaglia JD, Wang J, et al. Changes in resting connec-tivity during recovery from severe traumatic brain injury. Int J Psychophysiol. 2011; 82: 115–123. doi:
10.1016/j.ijpsycho.2011.03.011PMID:21473890
33. Johnson B, Zhang K, Gay M, Horovitz S, Hallett M, Sebastianelli W, et al. Alteration of brain default net-work in subacute phase of injury in concussed individuals: Resting-state fMRI study. Neuroimage. 2012; 59: 511–518. doi:10.1016/j.neuroimage.2011.07.081PMID:21846504
34. Zhou Y, Milham MP, Lui YW, Miles L, Reaume J, Sodickson DK, et al. Default-mode network disruption in mild traumatic brain injury. Radiology. 2012; 265: 882–892. doi:10.1148/radiol.12120748PMID:
23175546
35. Sharp DJ, Beckmann CF, Greenwood R, Kinnunen KM, Bonnelle V, De Boissezon X, et al. Default mode network functional and structural connectivity after traumatic brain injury. Brain. 2011; 134: 2233–2247. doi:10.1093/brain/awr175PMID:21841202
36. Mayer AR, Ling JM, Allen EA, Klimaj SD, Yeo RA, Hanlon FM. Static and dynamic intrinsic connectivity following mild traumatic brain injury. J Neurotrauma. 2015. doi:10.1089/neu.2014.3542
37. Iraji A, Benson RR, Welch RD, O'Neil BJ, Woodard JL, Ayaz SI, et al. Resting state functional connec-tivity in mild traumatic brain injury at the acute stage: Independent component and seed based analy-ses. J Neurotrauma. 2014. doi:10.1089/neu.2014.3610
38. Sours C, Zhuo J, Janowich J, Aarabi B, Shanmuganathan K, Gullapalli RP. Default mode network inter-ference in mild traumatic brain injury—A pilot resting state study. Brain Res. 2013; 1537: 201–215. doi:
10.1016/j.brainres.2013.08.034PMID:23994210
39. Liu TT. Neurovascular factors in resting-state functional MRI. Neuroimage. 2013; 80: 339–348. doi:10.
1016/j.neuroimage.2013.04.071PMID:23644003
40. Pop V, Badaut J. A neurovascular perspective for long-term changes after brain trauma. Transl Stroke Res. 2011; 2: 533–545. doi:10.1007/s12975-011-0126-9PMID:22350620
41. Zhuo J, Xu S, Proctor JL, Mullins RJ, Simon JZ, Fiskum G, et al. Diffusion kurtosis as an in vivo imaging marker for reactive astrogliosis in traumatic brain injury. Neuroimage. 2012; 59: 467–477. doi:10.1016/
j.neuroimage.2011.07.050PMID:21835250
42. Bonne O, Gilboa A, Louzoun Y, Kempf-Sherf O, Katz M, Fishman Y, et al. Cerebral blood flow in chronic symptomatic mild traumatic brain injury. Psychiatry Res. 2003; 124: 141–152. PMID:14623066 43. Liu W, Wang B, Wolfowitz R, Yeh PH, Nathan DE, Graner J, et al. Perfusion deficits in patients with
mild traumatic brain injury characterized by dynamic susceptibility contrast MRI. NMR Biomed. 2013; 26: 651–663. doi:10.1002/nbm.2910PMID:23456696
44. Hayward NM, Immonen R, Tuunanen PI, Ndode-Ekane XE, Grohn O, Pitkanen A. Association of chronic vascular changes with functional outcome after traumatic brain injury in rats. J Neurotrauma. 2010; 27: 2203–2219. doi:10.1089/neu.2010.1448PMID:20839948
45. Kim J, Whyte J, Patel S, Avants B, Europa E, Wang J, et al. Resting cerebral blood flow alterations in chronic traumatic brain injury: An arterial spin labeling perfusion FMRI study. J Neurotrauma. 2010; 27: 1399–1411. doi:10.1089/neu.2009.1215PMID:20528163
47. Kane RL, Roebuck-Spencer T, Short P, Kabat M, Wilken J. Identifying and monitoring cognitive deficits in clinical populations using automated neuropsychological assessment metrics (ANAM) tests. Arch Clin Neuropsychol. 2007; 22 Suppl 1: S115–26. PMID:17101258
48. King NS, Crawford S, Wenden FJ, Moss NE, Wade DT. The rivermead post concussion symptoms questionnaire: A measure of symptoms commonly experienced after head injury and its reliability. J Neurol. 1995; 242: 587–592. PMID:8551320
49. World Health Organization. International classification of disease, 10th review. 2010.
50. McCrea M, Kelly J, Randolph C. Standardized assessment of concussion (SAC): Manual for adminstra-tion, scoring, and interpretaadminstra-tion, Comprehensive Neuropsychological Services. 2000; 2nd Eddition.
51. Deiner E, Emmons RA, Larsen RJ, Griffen S. The satisfaction with life scale. Journal of Personality Assessment. 1985; 49: 71–75. PMID:16367493
52. Teasdale GM, Pettigrew LE, Wilson JT, Murray G, Jennett B. Analyzing outcome of treatment of severe head injury: A review and update on advancing the use of the glasgow outcome scale. J Neurotrauma. 1998; 15: 587–597. PMID:9726258
53. Gouvier WD, Blanton PD, LaPorte KK, Nepomuceno C. Reliability and validity of the disability rating scale and the levels of cognitive functioning scale in monitoring recovery from severe head injury. Arch Phys Med Rehabil. 1987; 68: 94–97. PMID:3813863
54. Reeves DL, Bleiberg J, Roebuck-Spencer T, Cernich AN, Schwab K, Ivins B, et al. Reference values for performance on the automated neuropsychological assessment metrics V3.0 in an active duty mili-tary sample. Mil Med. 2006; 171: 982–994. PMID:17076451
55. Ivins BJ, Kane R, Schwab KA. Performance on the automated neuropsychological assessment metrics in a nonclinical sample of soldiers screened for mild TBI after returning from iraq and afghanistan: A descriptive analysis. J Head Trauma Rehabil. 2009; 24: 24–31. doi:10.1097/HTR.0b013e3181957042
PMID:19158593
56. Reich S, Short P, Kane R, Weiner W, Shulman L, Anderson K. Validation of the ANAM test battery in parkinson's disease. Ft. Belvoir: Defense Technical Information Center; 2005.
57. Sours C, Chen H, Roys S, Zhuo J, Varshney A, Gullapalli RP. Investigation of multiple frequency ranges using discrete wavelet decomposition of resting state functional connectivity in mild traumatic brain injury patients. Brain Connect. 2015. doi:10.1089/brain.2014.0333
58. Wang J, Licht DJ, Jahng GH, Liu CS, Rubin JT, Haselgrove J, et al. Pediatric perfusion imaging using pulsed arterial spin labeling. J Magn Reson Imaging. 2003; 18: 404–413. PMID:14508776
59. Bonnelle V, Leech R, Kinnunen KM, Ham TE, Beckmann CF, De Boissezon X, et al. Default mode net-work connectivity predicts sustained attention deficits after traumatic brain injury. J Neurosci. 2011; 31: 13442–13451. doi:10.1523/JNEUROSCI.1163-11.2011PMID:21940437
60. Ponsford J. Factors contributing to outcome following traumatic brain injury. NeuroRehabilitation. 2013; 32: 803–815. doi:10.3233/NRE-130904PMID:23867406
61. Maruishi M, Miyatani M, Nakao T, Muranaka H. Compensatory cortical activation during performance of an attention task by patients with diffuse axonal injury: A functional magnetic resonance imaging study. J Neurol Neurosurg Psychiatry. 2007; 78: 168–173. PMID:16952916
62. Bonnelle V, Ham TE, Leech R, Kinnunen KM, Mehta MA, Greenwood RJ, et al. Salience network integ-rity predicts default mode network function after traumatic brain injury. Proc Natl Acad Sci U S A. 2012; 109: 4690–4695. doi:10.1073/pnas.1113455109PMID:22393019
63. Schonberger M, Ponsford J, Reutens D, Beare R, O'Sullivan R. The relationship between age, injury severity, and MRI findings after traumatic brain injury. J Neurotrauma. 2009; 26: 2157–2167. doi:10.
1089/neu.2009.0939PMID:19624261
64. Franco AR, Mannell MV, Calhoun VD, Mayer AR. Impact of analysis methods on the reproducibility and reliability of resting-state networks. Brain Connect. 2013; 3: 363–374. doi:10.1089/brain.2012.0134
PMID:23705789
65. Mannfolk P, Nilsson M, Hansson H, Stahlberg F, Fransson P, Weibull A, et al. Can resting-state func-tional MRI serve as a complement to task-based mapping of sensorimotor function? A test-retest reli-ability study in healthy volunteers. J Magn Reson Imaging. 2011; 34: 511–517. doi:10.1002/jmri.22654
PMID:21761469
66. Kindler J, Jann K, Homan P, Hauf M, Walther S, Strik W, et al. Static and dynamic characteristics of cerebral blood flow during the resting state in schizophrenia. Schizophr Bull. 2013.
67. Jann K, Orosz A, Dierks T, Wang DJ, Wiest R, Federspiel A. Quantification of network perfusion in ASL cerebral blood flow data with seed based and ICA approaches. Brain Topogr. 2013; 26: 569–580. doi: