Cerebral Edema in Hepatic Encephalopathy
Wei-Che Lin1,2, Tun-Wei Hsu2,3, Chao-Long Chen4, Changwei W. Wu5, Cheng-Hsien Lu6, Hsiu-Ling Chen1,2, Shau-Hsuan Li7, Pin-Yang Yeh8,9, Yu-Fan Cheng1*., Ching-Po Lin2,10
*.
1Department of Diagnostic Radiology, Kaohsiung Chang Gung Memorial Hospital and Chang Gung University College of Medicine, Kaohsiung, Taiwan,2Department of Biomedical Imaging and Radiological Sciences, National Yang-Ming University, Taipei, Taiwan,3Department of Diagnostic Radiology, Taipei Veterans General Hospital, Taipei, Taiwan,4Department of Surgery, Kaohsiung Chang Gung Memorial Hospital and Chang Gung University College of Medicine, Kaohsiung, Taiwan,5Institute of Biomedical Engineering, National Central University, Taoyuan, Taiwan,6Department of Neurology, Kaohsiung Chang Gung Memorial Hospital and Chang Gung University College of Medicine, Kaohsiung, Taiwan,7Department of Internal Medicine, Kaohsiung Chang Gung Memorial Hospital and Chang Gung University College of Medicine, Kaohsiung, Taiwan,8Instiute of Allied Health Science, College of Medicine, National Cheng Kung University, Tainan, Taiwan,9Department of Psychiatry, Tsyr-Huey Mental Hospital, Kaohsiung, Taiwan,10Lab for Brain Connectivity, Institute of Neuroscience, National Yang-Ming University, Taipei, Taiwan
Abstract
Cerebral edema, a well-known feature of acute liver disease, can occur in cirrhotic patients regardless of hepatic encephalopathy (HE) and adversely affect prognosis. This study characterized and correlated functional HE abnormalities in the brain to cerebral edema using resting-state functional magnetic resonance imaging (rs-fMRI) and diffusion tensor imaging (DTI). Forty-one cirrhotic patients (16 without HE, 14 minimal HE, 11 overt HE) and 32 healthy controls were assessed. The HE grade in cirrhotic patients was evaluated by the West Haven criteria and neuro-psychological examinations. Functional connectivity correlation coefficient (fc-CC) of the default mode network (DMN) was determined by rs-fMRI, while the corresponding mean diffusivity (MD) was obtained from DTI. Correlations among inter-cortical fc-CC, DTI indices, Cognitive Ability Screening Instrument scores, and laboratory tests were also analyzed. Results showed that gradual reductions of HE-related consciousness levels, from ‘‘without HE’’ or ‘‘minimal HE’’ to ‘‘overt HE’’, correlated with decreased anterior-posterior fc-CC in DMN [F(4.415),p= 0.000)]. The MD values from regions with anterior-posterior fc-CC differences
in DMN revealed significant differences between the overt HE group and other groups. Increased MD in this network was inversely associated with decreased fc-CC in DMN and linearly correlated with poor cognitive performance. In conclusion, cerebral edema can be linked to altered cerebral temporal architecture that modifies both within- and between-network connectivity in HE. Reduced fc-CC in DMN is associated with behavior and consciousness deterioration. Through appropriate targets, rs-fMRI technology may provide relevant supplemental information for monitoring HE and serve as a new biomarker for clinical diagnosis.
Citation:Lin W-C, Hsu T-W, Chen C-L, Wu CW, Lu C-H, et al. (2012) Connectivity of Default-Mode Network Is Associated with Cerebral Edema in Hepatic Encephalopathy. PLoS ONE 7(5): e36986. doi:10.1371/journal.pone.0036986
Editor:Christopher P Hess, University of California San Francisco, United States of America
ReceivedDecember 14, 2011;AcceptedApril 11, 2012;PublishedMay 18, 2012
Copyright:ß2012 Lin et al. This is an open-access article distributed under the terms of the Creative Commons Attribution License, which permits unrestricted use, distribution, and reproduction in any medium, provided the original author and source are credited.
Funding:This study was supported by grants from the National Health Research Institute (NHRI-EX100-9813EC) and National Science Council (NSC 100-2628-E-010-002-MY3 and NSC 97-2314-B-182A-104-MY3). The funders had no role in study design, data collection and analysis, decision to publish, or preparation of the manuscript.
Competing Interests:The authors have declared that no competing interests exist. * E-mail: [email protected] (YFC); [email protected] (CPL)
.These authors contributed equally to this work.
Introduction
Cerebral edema is a well-known feature of acute liver disease that can occur in cirrhotic patients regardless of hepatic encephalopathy (HE) and adversely affect prognosis [1]. There is no effective treatment for HE except liver transplantation. Given the very limited therapeutic efficacy in the overt stage of cerebral edema, awareness of early signs is critical for timely intervention in cirrhotic patients [2]. Currently, diffusion-weighted images can shed light in HE diagnosis by showing that brain water content (mean diffusivity value) increases significantly, progressively affecting more regions as the HE grade increases [3]. However, the efficacy of diffusion techniques in differentiating sub-clinical HE categories remains uncertain.
Astrocyte edema is the phenotype of brain dysmetabolism. It is unlikely that a single mechanism underlies the whole syndrome of
HE in all of its various forms. Ammonia can contribute to chronic low-grade glial edema [4] and alter the glutamate-glutamine metabolism during detoxification. In turn, glutamine may affect some astrocytic cytoskeletal components that not only determine morphology but also localize astrocytic functional proteins [5]. Ammonia can further potentiate the effects of neuro-inhibitors on the central nervous system [6,7]. However, the considerable heterogeneity in etiology and disease severity increases the difficulty of establishing a gold standard for assessing the presence of HE. The role of ammonia also remains questionable.
network (DMN) has been negatively associated with attention during the performance of demanding externally cued tasks. Completing the DMN also correlates well with the exhibition of consciousness [9]. Recently, DMN derived from coherent spontaneous blood oxygen level-dependent (BOLD) fluctuations in resting state functional MRI (rs-fMRI) has been extensively evaluated and thought to represent the neural consciousness stream [10-12]. Decreased DMN, especially of the posterior cingulate cortex (PCC), is associated with different degrees of impaired cognition and consciousness [13–15]. Without requiring demanding tasks [16], rs-fMRI is suited for investigating cognitive and consciousness disorders in liver cirrhosis.
The DMN is different between normal controls and HE patients [17]. However, network alteration in patients without HE and those with minimal HE is unknown. The gap between cerebral edema, ammonia concentration, and functional network is still unsolved. The aim of the present study was to investigate connectivity in resting-state networks correlating with conscious-ness across several HE levels under the hypothesis that increased cerebral edema evaluated by DTI is associated with a loss of connectivity in DMN, as assessed by rs-fMRI functional connec-tivity.
Materials and Methods
Subjects
Between August 2008 and December 2009, patients with liver cirrhosis were enrolled from Chang Gung Memorial Hospital, a tertiary referral centre. From the initial 51 patients, two patients with alcoholism-related cirrhosis were excluded and only patients with viral liver cirrhosis were included because alcohol addiction could alter brain function even without liver cirrhosis [18] and in order to unify the patho-physiology of HE. Three patients due to technical reasons, five without qualified MRI studies, and those with a history of drug abuse, psychiatric or neurologic illness, and head injury were likewise excluded. Forty-one patients were finally included for data analysis, including 30 men and 11 women (mean age 54.7 years; range, 26–70 years).
Cirrhosis was diagnosed based on clinical data and imaging studies [3]. The patients’ functional status was assessed using the Child-Pugh score [19], and 22 were classified as Child B and 19 as Child C. Overt HE (OHE) was graded using the West Haven criteria [20]. Patients with grade IV encephalopathy and those requiring sedation for MRI were excluded. Neurologic and neuro-psychological (NP) examinations were performed in all patients. Laboratory screening was done on the same day as the MRI scans and NP tests.
Thirty-two healthy volunteers (23 men and 9 women, mean age 54.3 years; range, 26–70 years) without a history of neurologic and psychiatric illnesses, unrelated medications, or head injury were recruited as healthy controls. All underwent detailed clinical and neurologic examinations in the same day as the MRI scans.
The hospital’s institutional review board human research committee approved the study. Because the study re-analyzed MRI data from a previous research in which written consent was already given by the patients for their information to be stored and used for research, the ethics committee waived the need for informed consent. All data were analyzed anonymously.
Neuro-psychological Tests (NP Tests)
General cognitive ability was tested by the Cognitive Ability Screening Instrument (CASI) [21], Executive dysfunction by the Wisconsin Card Sorting Test (WCST) [22], and Visuo-perceptive, motor and memory functionby the Taiwan Wechsler Adult Intelligence
Scale III (Taiwan WAIS-III) sub-tests, including picture comple-tion, digit-symbol, digit span, and block design [23].
Patients were grouped into ‘‘no HE’’, ‘‘minimal HE’’ (mHE), and ‘‘OHE’’. Eleven OHE patients were HE grade 1 (n = 3), grade 2 (n = 4), and grade 3 (n = 4) based on the West Haven criteria. Only three OHE patients completed the NP tests.
All 30 patients without overt HE completed the NP tests. According to Ferenci’s report [24], minimal HE was evaluated by the Wechsler Adult Intelligence Scale III (WAIS-III) subtests, including digit-symbol and block design [23]. An abnormality in at least one of these two tests was sufficient to define a patient as mHE. Based on the NP tests, 30 non-OHE patients were grouped as mHE (n = 14) and no HE (n = 16).
Image Acquisition
The MR data were acquired on a 3.0T GE Signa MRI system (General Electric Healthcare, Milwaukee, WI, USA), while T1-weighted structural images were acquired using the 3D-FSPGR sequence (TR/TE 9.5/3.9 ms, flip angle 20u, field of view 24624 cm, matrix size 5126512, 110 continuous slices with the slice thickness of 1.3 mm and in-plane spatial resolution of 0.4760.47 mm).
DTI acquisition and analysis. The DTI were acquired using a single-shot echo-planar imaging sequence (TR/TE 15800/ 77 ms, number of excitation 3, matrix size 1286128, field of view 25.6 cm, voxel size 26262.5 mm3, 55 axial oblique slices without gaps, 13 non-collinear directions with b-value 1000 s/mm2, and a non-diffusion weighted image volume with b-value 0 s/mm2). The
total scanning time for each subject was 11 min and 35 sec. Fractional anisotropy (FA) maps for each subject were computed using the in-house program and registered to the ICBM 152 template (Montreal Neurological Institute, MNI). The Talairach space was then approximated using the following steps [25]. First, non-diffusion weighted (b = 0) images of an individual subject were co-registered to their T1W images based on normalized mutual information as the cost function. The registration parameters were subsequently applied on the FA maps that were inherently registered to mean diffusivity (MD) images during the acquisition. These FA maps were also skull-stripped to remove non-brain tissue and background noise using the Brain Extraction Tool (BET) compiled in the FSL library 4.1 (Oxford Centre for Functional Magnetic Resonance Imaging of the Brain, Oxford University, Oxford, UK). Second, each T1W image was spatially normalized to the ICBM 152 template using the optimum 12-parameter affine transformation. Third, the co-registered FA maps were then transformed to the same stereotactic space as the T1W image by applying an affine transformation with 12 degrees of freedom together with a series of non-linear warps characterized by a linear combination of three dimension discrete cosine transform (DCT) basis functions. The estimated transfor-mation parameters were also applied to rest-fMRI to register to the MNI space.
Resting-state fMRI Acquisition and Analysis
‘‘Resting state’’ fMRI scans were performed with the patients’ eyes closed using echo-planar imaging sequence (TR 2 s, TE 30 ms, FOV 240 mm, flip angle 80u, matrix size 64664, thickness 4 mm, 300 scans of 32 contiguous axial slices) for a total scanning time of 10 min per subject. The first 10 scans of functional datasets were discarded to reach steady-state magnetization and allow participants to adapt to the scanning noise. Pre-processing steps included: (1) slice-timing correction for inter-leaved acquisition and head motion correction (,2.0 mm maximum displacement or 2.5u of any angular motion during the scanning); (2) data
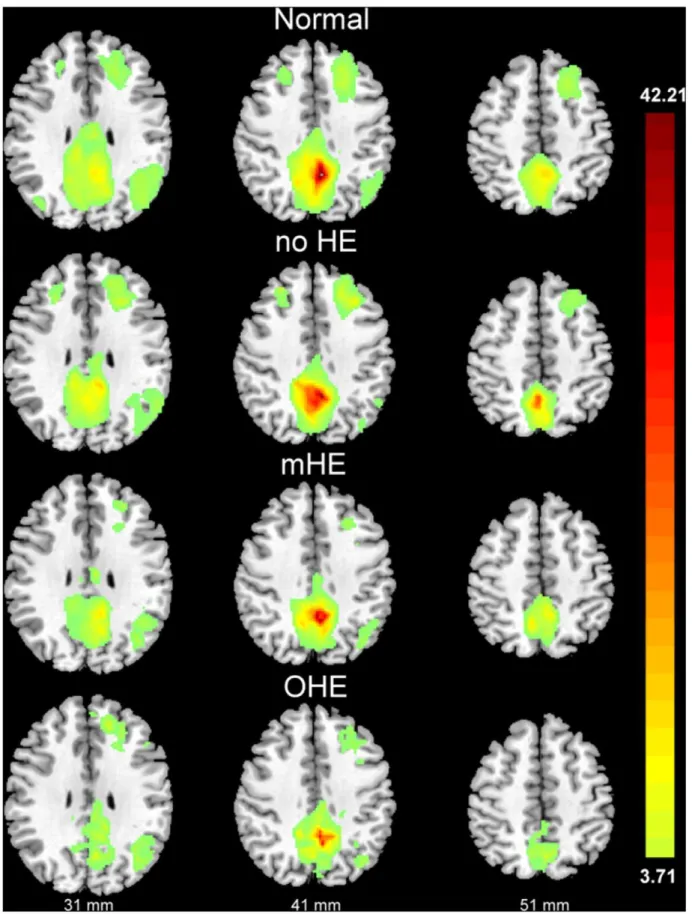
Figure 1. The fc-fMRI values relative to the PCC seed region.There were significant fc-fMRI values relative to the PCC seed region in the normal control, no hepatic encephalopathy (HE), minimal HE (mHE), and overt HE (OHE) groups atp,0.001 (corrected for multiple comparisons) using the mean T1-weighted structural images.
registration to the T1-weighted image of the same subject using an affine transformation; (3) normalization of co-registered functional images in the ICBM 152 template using the same transformation parameters as those in DTI post-processing, and further sub-sampling with a resolution of 26262 mm3and smoothened by a 6 mm full-width half maximum Gaussian kernel; and (4) linear de-trending to correct for signal drift and 0.01,0.08 Hz band-pass
filtering to reduce non-neuronal contributions to BOLD fluctua-tions [26,27].
To ensure that each rs-fMRI dataset represented regionally specific neural activities, several sources of spurious variances were minimized by regressing out with white matter (WM), CSF, global signal, and six motion parameters [28]. All image pre-processing and data analysis were performed using the SPM8 (Wellcome Department of Cognitive Neurology, London, UK) in MATLAB 7.8.0 (MathWorks, MA) and REST software (http://www. restfmri.net).
Generation of seed regions of interest and calculation of functional connectivity. The pre-processed images were ana-lyzed using seed-based connectivity analysis. The PCC was previously shown to be part of the DMN and reflected consciousness level [13–15]. The PCC seed described by Fox et al. [10], approximately spherical (volume 126 voxels, radius 6 mm) was used and located at (25249 40) Talairach space that was converted to MNI space with coordinates (25253 41). For each participant, this reference waveform was correlated with all other voxels to generate functional connectivity maps, while the r values were Fisher-transformed (z’) before further parametric statistical
analyses to ensure that the data approximated a normal distribution.
Group level analyses. Group analyses were performed in SPM8 for the correlation maps of the PCC seed. A random effect one-sample (Fig. 1; Table 1) was calculated to compare the functional connectivity within groups (i.e., healthy control, no HE, mHE, and OHE) (p,0.001, FDR corrected, a voxel-wise threshold of p,1024
was applied to the connectivity maps with a minimum cluster volume threshold of 536 mm3). In all subjects, the distribution of coherent PCC network activity was similar to that described in previous reports [29,30]. Network activity included the seed region and its surroundings (PCC/precuneus and anterior cingulated cortex [ACC], middle frontal cortex [MFC], inferior parietal cortices, and angular gyri).
Generation of ROIs. One-way analysis of variance (AN-OVA) was used to compare the maps of four groups with age and sex as covariates. To avoid detecting clusters that did not appear in either groups’ maps, a masking procedure was used in which a group map for all subjects (significant clusters defined as in single-group analyses) was generated to limit the search for clusters that differed between the groups to this combined group map [31]. Significant clusters of activation were set atp,0.05, as determined by the AlphaSim program in the Analysis of Functional NeuroImages (AFNI) software [32]. Threshold was a combination ofp,0.05 for voxel level and a minimum cluster size of 127 voxels with the mask file.
The contrast of functional connectivity maps among groups exhibited the three biggest cluster areas in the PCC functional connectivity map, including the left precuneus, right ACC and left
Table 1.Significant fc-fMRI values relative to the PCC seed region in normal control, no hepatic encephalopathy (HE), minimal HE (mHE), and overt HE (OHE) groups.
Peak MNI coordinate
Group Seeds/Brain regions BA Peak T-value Cluster Size x y z
Normal PCC
L Precuneus 7 42.21 10612 24 254 40
L Middle frontal cortex 8 8.35 3941 222 22 46
L Angular cortex 39 7.33 2838 244 272 34
R Middle frontal cortex 8 5.79 280 24 30 42
R Angular cortex 39 5.19 95 38 276 30
No HE PCC
L Precuneus 7 34.51 3811 22 252 38
L Middle frontal cortex 8 10.29 2447 232 24 42
L Middle temporal cortex 39 9.11 1581 250 268 20
R Middle frontal cortex 8 7.61 326 28 36 40
mHE PCC
L Precuneus 7 30.12 5494 24 250 40
L Angular cortex 39 6.22 844 242 256 36
L Middle frontal cortex 8 5.92 212 224 22 40
OHE PCC
L Precuneus 7 34.81 4436 28 250 40
L Superior frontal cortex 9 10.36 657 216 44 24
L Angular cortex 39 8.01 686 240 272 38
Statistical threshold was setp,0.001, FDR corrected, voxel-wise threshold ofp,1024was applied to the connectivity maps, with a minimum cluster size threshold of
67 = 576 mm3.
Abbreviations: BA, Brodmann area; PCC, posterior cingulate cortex; R, right; L, left. doi:10.1371/journal.pone.0036986.t001
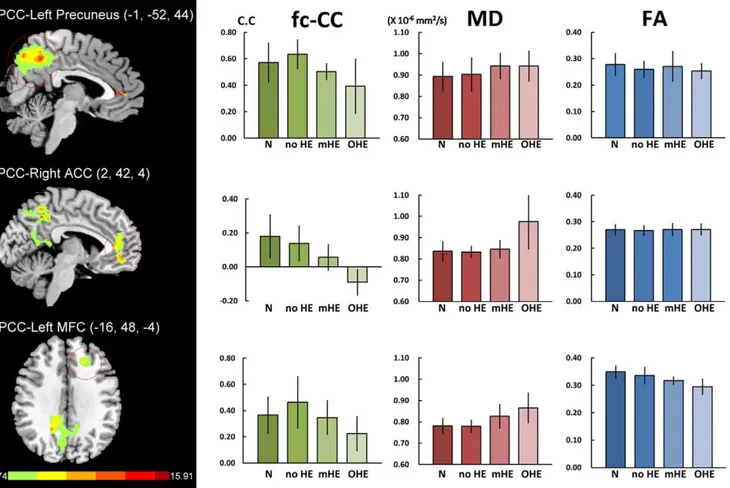
MFC (Fig. 2; Table 2). To examine differences among each patient group and healthy controls, the correlation coefficient of function connectivity (fc-CC) in these three ROIs was extracted. To evaluate the relationship with fc-CC, the corresponding MD and FA values were calculated within three previous ROI masks identified as the difference among group comparison procedures.
Statistical Analysis
Demographic data and clinical variables among healthy subjects, no HE, mHE, and OHE groups were analyzed using ANOVA. The NP results among groups were analyzed by analysis of co-variance (ANCOVA) with age, sex, and educational level as covariates. Comparison of fc-CC, MD, and FA in each ROI among groups were assessed using multiple analyses of variance (MANCOVA) with age and sex as covariates. Post-hoc univariate
Figure 2. Differences of default model network between health subjects and liver cirrhosis and their corresponding MD and FA values.There were three biggest cluster areas in the PCC functional connectivity map, including the left precuneus, right ACC and left middle frontal cortex (MFC). MANCOVA revealed significant fc-CC [F = 4.415,p= 0.000] and MD [F = 3.944,p= 0.000] differences among the four groups, but not in
FA [F = 0.859,p= 0.063].
doi:10.1371/journal.pone.0036986.g002
Table 2.Regions showing differences in fc-fMRI between normal subjects and cirrhotic patients in the PCC functional connectivity map.
Peak MNI coordinate
Seeds Brain regions BA Peak F-value Cluster Size x y z
PCC (ANOVA)
Left Precuneus 7 15.91 3058 21 252 44
Right Anterior cingulate cortex 32 12.78 581 2 42 4
Left Middle frontal cortex 10 6.49 139 216 48 24
The corrected statistical threshold was set atp,0.05, as determined by the AlphaSim program in Analysis of Functional NeuroImages (AFNI) software. Threshold was a combination ofp,0.05 for a voxel level and a minimum cluster size of 127 voxels with the mask file. BA, Brodmann area.
Table 3.Demographics, clinical characteristics and neuro-psychiatric tests of liver cirrhosis patients and healthy controls.
Control No HE mHE OHE F or X2 pvalue
#of subjects 32 16 14 11
Age (years) 54.31610.34 50.1369.19 56.7964.68 58.7367.11 2.472 0.069
Gender 9F/23M 2F/14M 5F/9M 4F/7M 2.725 0.436
Education (years) 12.1064.18 10.8663.51 8.9063.54 6.0064.24 5.745 0.002*
Creatinine (mg/dL) – 0.7460.36 0.7860.18 1.0161.07 0.759 0.475
GOT (IU/L) – 64.13649.79 83.71623.39 413.16970.39 1.729 0.192
Bilirubin (mg/dL) – 1.8161.41 2.8362.49 15.45617.40 8.480 0.001*
Venous ammonia (mg/dL) – 120.38652.76 126.71668.74 158.186107.67 0.874 0.426
Albumin (mg/dL) – 3.4460.64 3.0660.65 2.9260.38 2.802 0.074
International Normalized Ratio (INR) – 1.1760.13 1.2960.27 3.2064.16 3.181 0.053
General cognitive ability
CASI 93.2865.32 82.96614.60 80.37613.45 48.23629.74 (8) 6.445 0.001* Executive function
Perseverative response 11.2764.79 12.1962.35 17.28611.33 17.0064.36 (3) 3.522 0.022
Perseverative errors 10.9064.65 11.7662.41 13.4268.90 15.0063.60 (3) 0.684 0.566
Non-perseverative errors 14.5369.81 9.8664.64 22.14613.14 15.67619.40 (3) 1.378 0.261
Conceptual level response 48.02624.06 52.16623.96 25.89622.73 39.58628.40 (3) 1.908 0.141
Number of categories completed 2.3361.52 2.1661.48 0.7160.76 1.6761.53 (3) 2.508 0.070
Visuo-perceptive, motor and memory function
–
Picture completion# 14.7365.37 13.7765.21 9.7565.60 – 2.103 0.113
Digit-symbol 67.00622.50 52.56622.94 41.86624.59 – 3.492 0.023*
Digit span 21.9064.61 17.5265.94 16.2865.79 – 2.824 0.049*
Block design 39.47613.52 36.88612.60 31.2566.87 – 4.656 0.007*
Results were mean6standard deviation.
Abbreviations: mHE, minimal hepatic encephalopathy; OHE, overt hepatic encephalopathy; CASI, Cognitive Ability Screening Instrument. Statistical.
Threshold was set atp,0.05 (Boldface). doi:10.1371/journal.pone.0036986.t003
Table 4.Functional connectivity correlation coefficient, mean diffusivity and fractional anisotropy of healthy controls and patients with liver cirrhosis.
N A B C
Mean ROI Health, n = 32 no HE, n = 16 mHE, n = 14 OHE, n = 11 MANCOVA Post hoc comparison Functional connectivity correlation coefficient(z-value) F(4.415)p= 0.000
PCC-Left Precuneus 0.572 (0.146) 0.635 (0.109) 0.503 (0.205) 0.393 (0.061) 4.608 0.006* C,A
PCC-Right ACC 0.180 (0.127) 0.138 (0.102) 0.056 (0.075) 20.091 (0.074) 11.101 0.000* C,N; C,A; C,B; B,N
PCC-Left MFC 0.366 (0.138) 0.463 (0.196) 0.225 (0.129) 0.347 (0.129) 2.815 0.057
Mean diffusivity(61023mm2/s) F(3.944)p= 0.000
PCC-Left Precuneus 0.893 (0.066) 0.903 (0.077) 0.943 (0.059) 0.942 (0.070) 0.545 0.654
PCC-Right ACC 0.837 (0.044) 0.833 (0.026) 0.846 (0.041) 0.976 (0.129) 8.689 0.000* C,N; C,A; C,B
PCC- Left MFC 0.781 (0.035) 0.779 (0.029) 0.826 (0.055) 0.865 (0.069) 5.288 0.003* C,N; C,A Fractional anisotropyF(1.859)p= 0.063
PCC-Left Precuneus 0.278 (0.041) 0.260 (0.030) 0.271 (0.056) 0.253 (0.028) 0.459 0.712
PCC-Right ACC 0.270 (0.019) 0.267 (0.018) 0.271 (0.023) 0.271 (0.021) 0.295 0.829
PCC- Left MFC 0.349 (0.022) 0.336 (0.030) 0.317 (0.014) 0.295 (0.028) 6.044 0.001
Abbreviations: ACC, anterior cingulate cortex; MFC, middle frontal cortex. Statistical threshold was set atp,0.05 (Boldface).
doi:10.1371/journal.pone.0036986.t004
tests with Bonferroni’s correction were performed to follow-up significant main effects yielded by MANCOVA. Partial correlation test was used to examine the relationship between fc-CC, MD values in the three ROIs, clinical laboratory data, and CASI test, regressing out covariates of age and sex (and education for CASI tests). Statistical significance was defined atp,0.05. All analyses were done using the SPSS, Version 17 (SPSS Inc., Chicago, IL, USA).
Results
Progressive fc-CC Reduction and MD Elevation in Chronic Liver Disease with HE
The demographic features and NP tests were presented in Table 3. MANCOVA revealed significant fc-CC differences among the four groups (F = 4.415;p,0.001) (Fig. 2, Table 4). In the PCC map, decreased fc-CC in the left precuneus and right ACC was associated with increased HE severity. In the mHE groups, PCC exhibited decreased connectivity with the right ACC compared to the normal groups.
The MD values were derived from ROIs of the left precuneus, right ACC and left MFC in the PCC functional connectivity map. Using MANCOVA (Fig. 2, Table 4), the main effect of MD value had significant groups difference (F = 3.994,p,0.000). Follow-up one-way ANCOVAs revealed significant differences between overt HE and the other groups. There was also a trend of increased MD values from normal controls and no ME to the mHE group, but without significant difference among each other. There were also no significant FA differences among the groups in all ROIs.
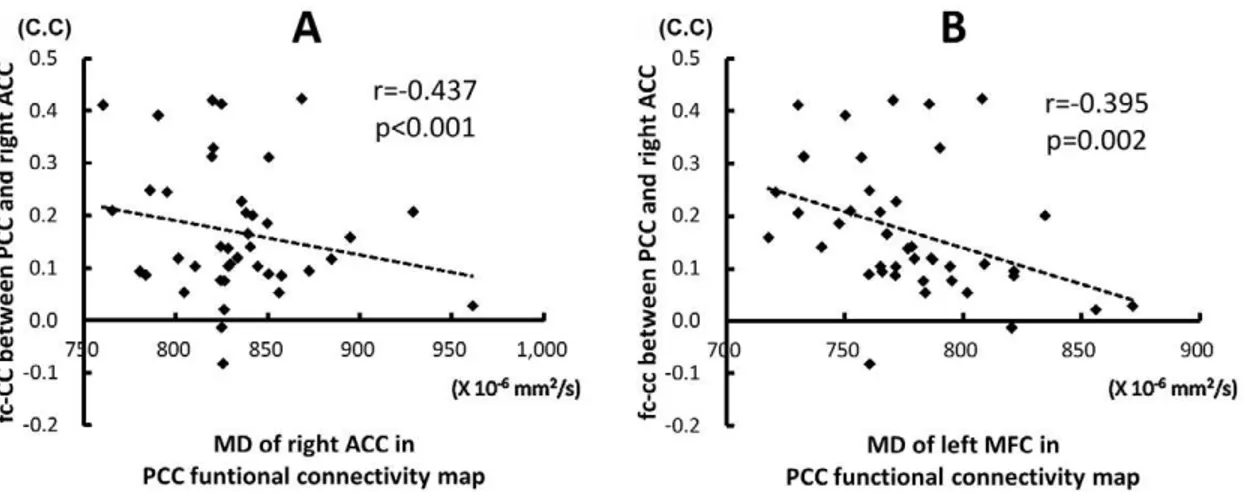
Association of fc-CC and Diffusion Indices in DMN Increased MD value in the right ACC inversely correlated with decreased fc-CC strength between PCC and the right ACC (r =20.437,p,0.000). Increased MD value in the left MFC also inversely correlated with decreased fc-CC strength between PCC and the right ACC (r =20.395,p= 0.002) (Fig. 3).
Correlation between fc-CC of DMN and Laboratory and Cognitive Tests
There was no significant correlation between the three ROIs -DMN fc-CC and the laboratory data. The decreased strength of inter-cortical fc-CC in the PCC-left Precuneus (r = 0.367,
p= 0.006) and in the PCC-right ACC (r = 0.489, p,0.000) positively correlated with low CASI scores. Moreover, decreased fc-CCs in the PCC-left Precuneus and PCC-right ACC were also associated with lower CASI sub-tests (Table 5).
Discussion
The BOLD signal from rs-fMRI is not a direct measure of neuronal activity but reflects local variations in de-oxyhemoglobin concentration from a combination of blood flow, blood volume, and oxygen metabolism [29]. The results are consistent with a previous PET study with impaired blood flow and oxygen metabolism in the frontal cortices and anterior cingulate gyrus in liver cirrhosis [33]. Changes in BOLD signal have been linked to synaptic activity of glutamate and its recycling through astrocytes from evidence on cell biology [34]. By using rs-fMRI,
Figure 3. The relationship between fc-CC strength of the PCC-ACC and MD value.The decrease connectivity between PCC and ACC were associated with increase MD values derived from ROIs of the right ACC (A) and left middle frontal cortex (B) in the PCC functional connectivity map. C.C, correlation coefficient.
doi:10.1371/journal.pone.0036986.g003
Table 5.Correlation between strength of inter-cortical fc-CC and cognitive variables after adjustments for age, gender and education.
fc-CC in ROIs Clinical variable Correlation (r)pvalue
PCC-Left Precuneus CASI total score 0.367 0.006 Mental control 0.403 0.002
Orientation 0.464 0.000
Drawing 0.377 0.005
Verbal fluency 0.305 0.023
PCC-Right ACC CASI total score 0.489 0.000
Mental control 0.421 0.001 Attention 0.332 0.013
Orientation 0.478 0.000
Short term memory 0.481 0.000 Abstraction 0.423 0.001
Drawing 0.327 0.015
Verbal fluency 0.404 0.002
Abbreviations: CASI, Cognitive Abilities Screening Instrument; fc-CC, functional connectivity correlation coefficient; PCC, posterior cingulate cortex; ACC, anterior cingulate cortex.
disconnection of BOLD signal coherence was proved to correlate with the disease progression.
Decreased fc-CC derived from the BOLD signal between inter-cortical regions may cause the underlying desynchronized neural activity of glutamate. Glutamate is the major metabolism of ammonia detoxification. However, we did not find significant association between venous ammonia level and functional connectivity in this study. Intervention for HE by lessening the ammonia concentration might alter results interpretation since ammonia level decrease can precede consciousness recovery. The altered glutamine-glutamate cycle can mediate many vital processes, including information encoding, memory formation and retrieval, spatial recognition, and consciousness maintenance [35]. Further animal studies should be conducted to validate these findings.
The main neuro-pathologic findings in HE is astrocyte swelling and intra-cranial hypertension [2]. Using DTI, interstitial edema is shown in HE in vivo [3]. Altering glutamate re-uptake during ammonia metabolism may result in the intracellular depletion of myo-inositol [36], an organic osmolyte that can trigger macro-molecule migration to the extracellular space, resulting in increased extracellular fluid accumulation. This accounts for the increased MD value [3].
Another explanation for the elevated MD value may be the increased interstitial space from cell loss [37,38]. The persistence of modified extra- and intra-cellular glutamate concentrations also alters the surrounding glial processes, while the associated mitochondrial dysfunction with oxidative stress may represent possible apoptosis with subsequent change in the brain network. However, the subtle FA decrease in the present study may only partially explain the hypothesis of cell loss.
The correlation between brain edema and network changes in HE has been documented by imaging modalities. However, the causal-relationship between morphology and function in cell level has not been demonstrated. In an animal study, hyper-ammone-mia results in increased numbers of swollen astrocytes, increased immuno-reactivity of glutamine synthetase (GS), and some cytoskeletal proteins like the intermediate filament glial fibrillary acidic protein (GFAP) [39]. These increases in swollen astrocytes and GFAP immuno-reactivity can be reduced by GS inhibition [39].
The GFAP is expressed in astrocytes and is involved in cell structure maintenance, cell communication, and functioning of the blood brain barrier. It is also proposed to play a role in astrocyte-neuron interactions, which may explain the alteration of astrocyte morphology and function [40]. However, the limited correlation between decreased DMN integrity and ammonia level in this and another small sample-sized studies [17] also imply a more complicated process in HE development or an adaptive change of functional network that exists in each individual subject with a diverse clinical profile.
Our results reveal significant antero-posterior functional disconnection in the PCC functional maps (Fig. 2). Similar results have been suggested in subjects with increasing depth of sleep [14],
wherein the posterior areas (bilateral inferior parietal cortex and PCC) strengthen their connectivity, while connections between the frontal and posterior regions are lost.
Functional uncoupling between the PCC and ACC and MFC may impair the brain’s ability to integrate information [16,29]. Results of the present study suggest that integrated DMN activity may reflect ongoing conscious mental activity. In addition, increased MD, especially in the ACC, has good correlation with the disruption of the antero-posterior functional network, which further supports the notion that the PCC/precuneus are the central core within the DMN [41].
Early hepatic encephalopathy is not identified by structural abnormalities. Instead, a comprehensive neurologic examination is usually required. Revealing the subtle functional alteration in ‘‘sub-clinical HE’’ is even more difficult. In an FDG-PET study, mHE is associated with decreased glucose uptake and blood flow in the ACC, medial frontal region, and precuneus [33]. These indicate that brain regions involved in controlling the ‘‘attention system’’ responsible for monitoring is less active in mHE patients than in normal subjects. The NP tests, especially the block design and digit-symbol tests, are attention-demanding. Taken together, these findings support the hypothesis that a part of DMN connectivity fluctuates as it is more closely related to the presence of cognitive processes [15] and can be altered earlier in liver cirrhosis.
This study has some limitations. In subject recruitment, significantly ill patients were excluded from MRI study for safety concerns. As such, the preservation of DMN in comatose patients is unknown. Moreover, cirrhotic patients with altered conscious-ness are difficult to hold motionless during MRI scanning. Since the sample size is small, a relative low threshold for head motion criteria in data analysis (2.0 mm in translation and 2.5urotation) has been applied, which might affect the results. Further studies with larger sample populations are warranted to assess the effect of therapy on functional network. Further validation of this diagnostic value on mHE by rs-fMRI is also required.
In conclusion, HE patients show connectivity de-coupling between the fronto-posterior areas of DMN, which is associated with the degree of HE and brain oedema. Rs-fMRI can be used to investigate variability among patients with differing symptom profiles, including sub-clinical states. Resting-state functional MRI may provide relevant supplemental information for monitoring HE patients and serve as a new biomarker for clinical diagnosis. Future studies that correlate rs-fMRI connectivity and metabolic alteration by MR spectroscopy, and those that investigate small-world topologic analysis by graphic theory and reversibility in post-treatment cirrhotic patients are recommended.
Author Contributions
Conceived and designed the experiments: WCL CLC YFC CPL. Performed the experiments: WCL CHL HLC SHL PYY. Analyzed the data: WCL TWH CWW. Contributed reagents/materials/analysis tools: WCL TWH CLC. Wrote the paper: WCL TWH YFC CPL.
References
1. Haussinger D, Kircheis G, Fischer R, Schliess F, vom Dahl S (2000) Hepatic encephalopathy in chronic liver disease: a clinical manifestation of astrocyte swelling and low-grade cerebral edema? J Hepatol 32: 1035–1038.
2. Donovan JP, Schafer DF, Shaw BW Jr., Sorrell MF (1998) Cerebral oedema and increased intracranial pressure in chronic liver disease. Lancet 351: 719–721. 3. Kale RA, Gupta RK, Saraswat VA, Hasan KM, Trivedi R, et al. (2006)
Demonstration of interstitial cerebral edema with diffusion tensor MR imaging in type C hepatic encephalopathy. Hepatology 43: 698–706.
4. Haussinger D, Schliess F, Kircheis G (2002) Pathogenesis of hepatic encephalopathy. J Gastroenterol Hepatol 17 Suppl 3: S256–S259.
5. Eng LF, Ghirnikar RS, Lee YL (2000) Glial fibrillary acidic protein: GFAP-thirty-one years (1969–2000). Neurochem Res 25: 1439–1451.
6. Jones EA, Weissenborn K (1997) Neurology and the liver. J Neurol Neurosurg Psychiatry 63: 279–293.
7. Albrecht J, Jones EA (1999) Hepatic encephalopathy: molecular mechanisms underlying the clinical syndrome. J Neurol Sci 170: 138–146.
8. Lin WC, Chou KH, Chen CL, Chen CH, Chen HL, et al. (2012) Significant Volume Reduction and Shape Abnormalities of the Basal Ganglia in Cases of Chronic Liver Cirrhosis. AJNR Am J Neuroradiol 33: 239–45.
9. Raichle ME, MacLeod AM, Snyder AZ, Powers WJ, Gusnard DA, et al. (2001) A default mode of brain function. Proc Natl Acad Sci USA 98: 676–682. 10. Fox MD, Snyder AZ, Vincent JL, Corbetta M, Van Essen DC, et al. (2005) The
human brain is intrinsically organized into dynamic, anti-correlated functional networks. Proc Natl Acad Sci USA 102: 9673–9678.
11. McKiernan KA, D’Angelo BR, Kaufman JN, Binder JR (2006) Interrupting the ‘‘stream of consciousness’’: an fMRI investigation. Neuroimage 29: 1185–1191. 12. Morcom AM, Fletcher PC (2007) Does the brain have a baseline? Why we
should be resisting a rest. Neuroimage 37: 1073–1082.
13. Greicius MD, Kiviniemi V, Tervonen O, Vainionpaa V, Alahuhta S, et al. (2008) Persistent default-mode network connectivity during light sedation. Hum Brain Ma 29: 839–847.
14. Horovitz SG, Braun AR, Carr WS, Picchioni D, Balkin TJ, et al. (2009) Decoupling of the brain’s default mode network during deep sleep. Proc Natl Acad Sci USA 106: 11376–11381.
15. Vanhaudenhuyse A, Noirhomme Q, Tshibanda LJ, Bruno MA, Boveroux P, et al. (2010) Default network connectivity reflects the level of consciousness in non-communicative brain-damaged patients. Brain 133: 161–171.
16. Damoiseaux JS, Rombouts SA, Barkhof F, Scheltens P, Stam CJ, et al. (2006) Consistent resting-state networks across healthy subjects. Proc Natl Acad Sci USA 103: 13848–13853.
17. Zhang L, Qi R, Wu S, Zhong J, Zhong Y, et al. (2011) Brain default-mode network abnormalities in hepatic encephalopathy: A resting-state functional MRI study. Hum Brain Mapp doi: 10.1002/hbm.21295.
18. Tapert SF, Brown GG, Baratta MV, Brown SA (2004) fMRI BOLD response to alcohol stimuli in alcohol dependent young women. Addict Behav 29: 33–50. 19. Pugh RN, Murray-Lyon IM, Dawson JL, Pietroni MC, Williams R (1973)
Transection of the oesophagus for bleeding oesophageal varices. Br J Surg 60: 646–649.
20. Atterbury CE, Maddrey WC, Conn HO (1978) Neomycin-sorbitol and lactulose in the treatment of acute portal-systemic encephalopathy. A controlled, double-blind clinical trial. Am J Dig Dis 23: 398–406.
21. Teng EL, Hasegawa K, Homma A, Imai Y, Larson E, et al. (1994) The Cognitive Abilities Screening Instrument (CASI): a practical test for cross-cultural epidemiological studies of dementia. Int Psychogeriatr 6: 45–58; discussion 62.
22. Amodio P, Montagnese S, Gatta A, Morgan MY (2004) Characteristics of minimal hepatic encephalopathy. Metab Brain Dis 19: 253–267.
23. Das A, Dhiman RK, Saraswat VA, Verma M, Naik SR (2001) Prevalence and natural history of sub-clinical hepatic encephalopathy in cirrhosis. J Gastroenterol Hepatol 16: 531–535.
24. Ferenci P, Lockwood A, Mullen K, Tarter R, Weissenborn K, et al. (2002) Hepatic encephalopathy – definition, nomenclature, diagnosis, and quantifica-tion: final report of the working party at the 11th World Congresses of Gastroenterology, Vienna, 1998. Hepatology 35: 716–721.
25. Bai YM, Chou KH, Lin CP, Chen IY, Li CT, et al. (2009) White matter abnormalities in schizophrenia patients with tardive dyskinesia: a diffusion tensor image study. Schizophr Res 109: 167–181.
26. Biswal B, Yetkin FZ, Haughton VM, Hyde JS (1995) Functional connectivity in the motor cortex of resting human brain using echo-planar MRI. Magn Reson Med 34: 537–541.
27. Lowe M, Mock B, Sorenson J (1998) Functional connectivity in single and multi-slice echoplanar imaging using resting-state fluctuations. Neuroimage 7: 119–132.
28. Birn RM, Diamond JB, Smith MA, Bandettini PA (2006) Separating respiratory-variation-related fluctuations from neuronal-activity-related fluctuations in fMRI. Neuroimage 31: 1536–1548.
29. Fox MD, Raichle ME (2007) Spontaneous fluctuations in brain activity observed with functional magnetic resonance imaging. Nat Rev Neurosci 8: 700–711. 30. Greicius MD, Krasnow B, Reiss AL, Menon V (2003) Functional connectivity in
the resting brain: a network analysis of the default mode hypothesis. Proc Natl Acad Sci USA 100: 253–258.
31. Greicius MD, Srivastava G, Reiss AL, Menon V (2004) Default-mode network activity distinguishes Alzheimer’s disease from healthy aging: evidence from functional MRI. Proc Natl Acad Sci USA 101: 4637–4642.
32. Cox RW (1996) AFNI: software for analysis and visualization of functional magnetic resonance neuroimages. Comput Biomed Res 29: 162–173. 33. Lockwood AH, Weissenborn K, Bokemeyer M, Tietge U, Burchert W (2002)
Correlations between cerebral glucose metabolism and neuropsychological test performance in non-alcoholic cirrhotics. Metab Brain Dis 17: 29–40. 34. Logothetis NK, Pauls J, Augath M, Trinath T, Oeltermann A (2001)
Neuro-physiological investigation of the basis of the fMRI signal. Nature 412: 150–157. 35. McEntee WJ, Crook TH (1993) Glutamate: its role in learning, memory, and the
aging brain. Psychopharmacology (Berl) 111: 391–401.
36. Gupta RK, Saraswat VA, Poptani H, Dhiman RK, Kohli A, et al. (1993) Magnetic resonance imaging and localizedin vivoproton spectroscopy in patients with fulminant hepatic failure. Am J Gastroenterol 88: 670–674.
37. Lin WC, Lu CH, Lee YC, Wang HC, Lui CC, et al. (2009) White matter damage in carbon monoxide intoxication assessed in vivo using diffusion tensor MR imaging. AJNR Am J Neuroradiol 30: 1248–1255.
38. Lu CH, Chen HL, Chang WN, Tsai NW, Wang HC, et al. (2011) Assessing the chronic neuropsychologic sequelae of human immunodeficiency virus-negative cryptococcal meningitis by using diffusion tensor imaging. AJNR Am J Neuroradiol 32: 1333–1339.
39. Tanigami H, Rebel A, Martin LJ, Chen TY, Brusilow SW, et al. (2005) Effect of glutamine synthetase inhibition on astrocyte swelling and altered astroglial protein expression during hyper-ammonemia in rats. Neuroscience 131: 437–449.
40. Hagemann TL, Gaeta SA, Smith MA, Johnson DA, Johnson JA, et al. (2005) Gene expression analysis in mice with elevated glial fibrillary acidic protein and Rosenthal fibers reveals a stress response followed by glial activation and neuronal dysfunction. Hum Mol Genet 14: 2443–2458.