Class Cohesion Metrics for Software
Engineering: A Critical Review
∗Habib Izadkhah, Maryam Hooshyar
Abstract
Class cohesion or degree of the relations of class members is considered as one of the crucial quality criteria. A class with a high cohesion improves understandability, maintainability and reusability. The class cohesion metrics can be measured quantita-tively and therefore can be used as a base for assessing the quality of design. The main objective of this paper is to identify impor-tant research directions in the area of class cohesion metrics that require further attention in order to develop more effective and efficient class cohesion metrics for software engineering. In this paper, we discuss the class cohesion assessing metrics (thirty-two metrics) that have received the most attention in the research community and compare them from different aspects. We also present desirable properties of cohesion metrics to validate class cohesion metrics.
Keywords: Cohesion, Class cohesion metrics, Software en-gineering.
1
Introduction
Producing high quality software systems has always been one of the main goals of software designers and developers. Many software fea-tures have been identified that influence the quality of software, for example complexity, coupling and cohesion. Cohesion is an important software quality attribute and high cohesion is one of characteristics of well-structured software design. In overall, module cohesion indicates
∗Corresponding author email addresses: [email protected]
c
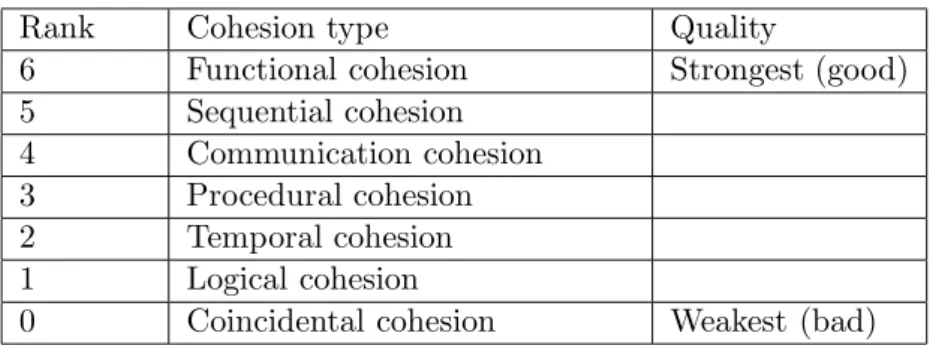
relatedness in the functionality of a software module [1]. It shows to which degree the elements within that module belong together or are related to each other. Modules with high cohesion are usually robust, reliable, reusable, and understandable while modules with low cohe-sion are allied with undesirable characteristics such as being difficult to understand, test, maintain, and reuse. Cohesion is usually expressed as high cohesion or low cohesion. There are different types of module cohesion; we can, therefore, create a nominal scale for cohesion mea-surement. Table 1 shows an ordinal scale for cohesion measurement [1].
Table 1. An ordinal scale for cohesion measurement
Rank Cohesion type Quality
6 Functional cohesion Strongest (good)
5 Sequential cohesion 4 Communication cohesion 3 Procedural cohesion 2 Temporal cohesion 1 Logical cohesion
0 Coincidental cohesion Weakest (bad)
In Table 1, functional cohesion is judged to provide a strongest relationship because all of the elements contribute to a single task. Functional cohesion corresponds to single responsibility principle. Co-incidental cohesion takes place when a module performs different and unrelated tasks. The serious problem with these methods is that it depends on subjective human assessment. It means that these metrics specify that the module is cohesive or not cohesive, and do not capture varying strengths of cohesion.
object-hesion of object-oriented programs such as classes. Class coobject-hesion can be defined as a measure of the degree to which members (i.e., meth-ods and attributes) of a class belong together. Cohesion is usually measured on structural information extracted entirely from the source code (e.g., attribute references in methods and method calls).
In this paper, most class cohesion assessing metrics that have been presented in the literature are reviewed and categorized in both syntac-tic and semansyntac-tic relationships. We also outline directions for further research in class cohesion assessing metrics, such as to define of better class cohesion assessing metrics or the improvement and evaluation of existing ones.
The structure of the paper is as follows. Section 2 presents three different applications of existing class cohesion metrics in order to mo-tivate the need for assessing class cohesion. An overview of the state of the art for assessing class cohesion metrics is presented in Section 3. In section 4, the class cohesion metrics are evaluated from theoretical validation aspects. Section 5 introduces lack of discrimination anomaly problem, so that this problem is addressed on some class cohesion met-rics. Section 6 presents some desirable properties of cohesion assessing metrics. Finally, Section 7 concludes the paper and open research chal-lenges related to class cohesion are discussed in this section.
2
Class Cohesion Assessing Applications
Principle: The Single Responsibility Principle (SRP) -A class should have one, and only one, reason to change.
The SRP indicates high cohesion for a class, in other words highly related, single responsibility, and strongly focused functionality for a class; where a responsibility [2] is defined as “a reason for change”. For addressing class cohesion assessing applications, the following classes are considered: Class A performs three distinct operations (i.e., three responsibilities) while Class B performs only one operation (i.e., single responsibility); the cohesion of class B is higher than the class A. Class A {
1. Init disk(){...}
2. Apply to college(){...}
3. Circle Area Calculation (){...} }
Class B{
1. Method A part 1(){...}
2. Method A part 2 (){...}
3. Method A part 3 (){...} }
2.1 Software Maintainability
a change. Class cohesion assessing metrics evaluate the cohesion of a class for determining the level of maintainability of a class.
2.2 Program Understandability
From Eighty-Twenty Rule, 20% of the time is spent creating, and 80% of the time is spent maintaining. Of the maintenance time, 20% is spent changing, while 80% of the time is spent just trying to understand the code. Therefore, understandability or program comprehension is one of the important characteristics of software quality, because it concerns the ways software engineers maintain the existing source code. In order to maintain the software, the programmers need to comprehend the source code. The understandability of the source code depends upon the cohesion, coupling and complexity of the program. A class with single responsibility is easier to understand compared to a class with multiple responsibilities. Class cohesion assessing metrics evaluate the cohesion of a class for determining the level of understandability of a class; a class with higher cohesion is more understandable than a class with low cohesion. For example, in our designed classes, since the class B only does “one thing,” its interface usually has a small number of methods that are fairly self explanatory. It should also have a small number of member variables, thus it is more understandable than class A.
2.3 Software Reusability
3
Class Cohesion Assessing Metrics
Using ordinal scale for cohesion measurement, comparing two cohesive or two non-cohesive classes, or to know whether a code modification increased or reduced the degree of cohesiveness is hard. In this paper, we review the metrics for determining whether a module (class) is cohe-sive or not cohecohe-sive and also the degree of its cohecohe-siveness. Also, these metrics would allow us to judge which module is better designed and more cohesive. These metrics compute class cohesion using manipula-tions of class elements. The key elements of a class C are its attributes A1, ..., Aa, methods M1, ..., Mm, and the list of p parameter (or,
argu-ment) types of the methods P1, ..., Pm. Using class cohesion assessing
metrics for computing class cohesion, we need to show a class with corresponding graph. Let a, b, c, d denote attributes and m1, m2, m3 show methods. Figure 1 shows a sample class with its corresponding graph.
Figure 1. Class with corresponding graph
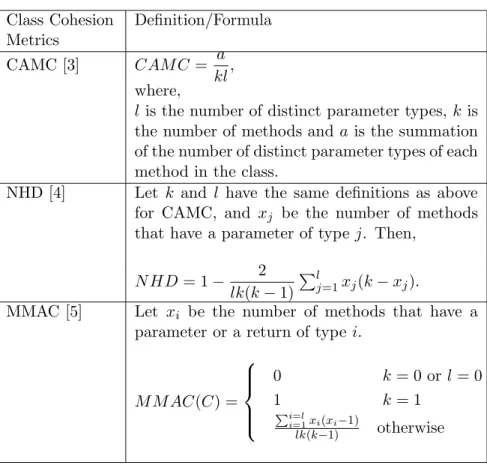
Class cohesion metrics can be broadly classified into two groups: 1. Interface-based metrics compute class cohesion from informa-tion in method signatures. Table 2 shows most interface-based met-rics. Advantage of these metrics is that they can be calculated early in the design stage. Disadvantage of them can be concluded as from only design model, it is impossible to determine what exactly a method is doing (e.g., it may be using class attributes, or calling other methods on its class);
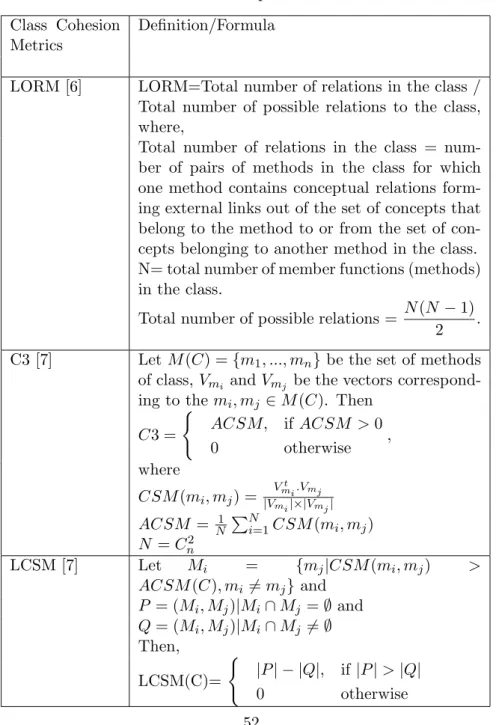
con-retrieval methods are based on the extraction the concepts of source code. In conceptual cohesion if methods of one class are conceptually related, then class is considered cohesive. Conceptual metrics of co-hesion are introduced in the Tables 3 and 4. Many structural metrics have been proposed for cohesion measurement from research commu-nity. These metrics use the structural data that are extracted from the source code. The differences among structural metrics are based on the definition of the relationships between methods. Structural met-rics compute class cohesion (method-method invocation) in terms of attribute accesses by methods (operations sharing attributes) and op-erations invocating other opop-erations. The latter have the strongest cohesion compared to the former ones. We can further classify struc-tural base cohesion metrics into four sub-types based on the methods of quantification of cohesion:
• Disjoint component-based metrics count the number of disjoint sets of methods or attributes in a given class. These metrics are addressed in Table 5.
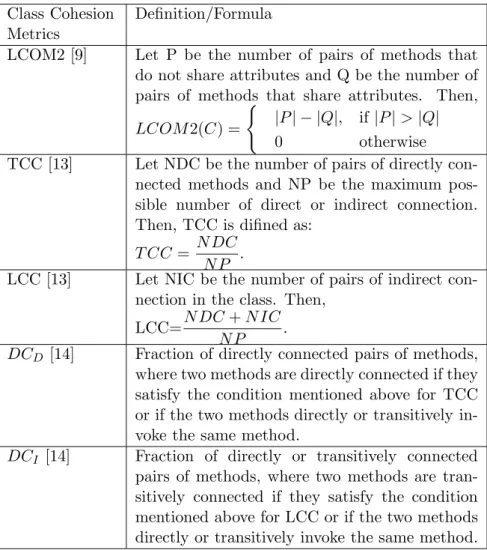
• Pairwise connection-based metrics compute cohesion as a func-tion of number of connected and disjoint method pairs. These metrics are addressed in Tables 6 and 7.
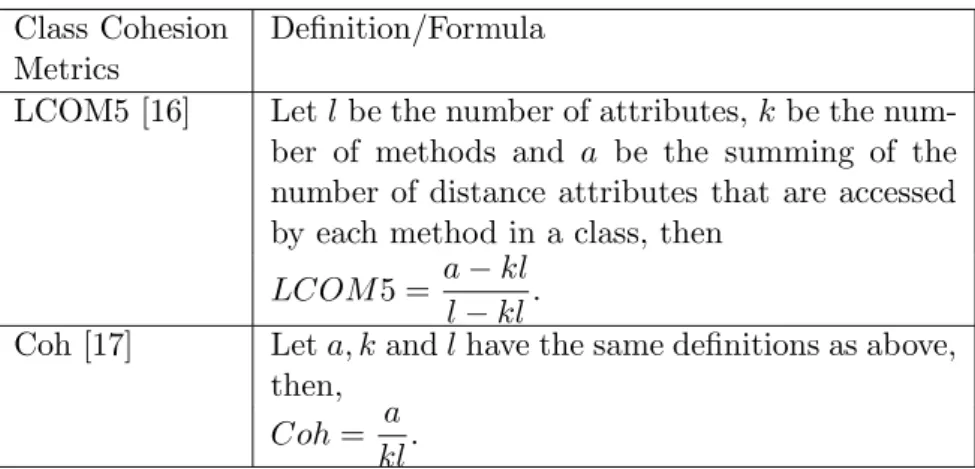
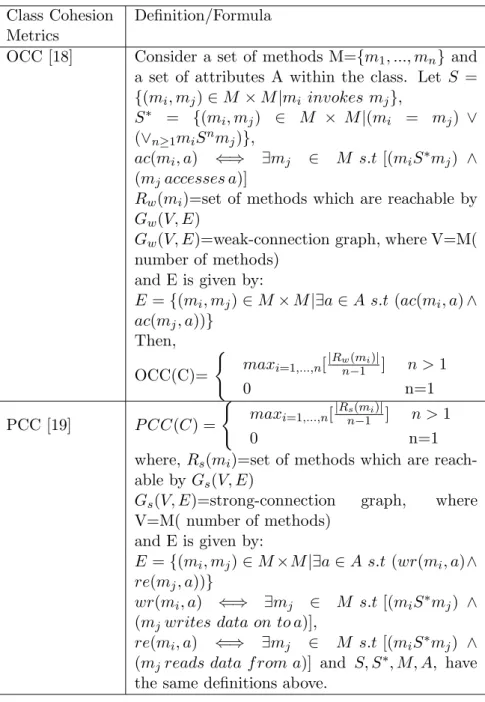
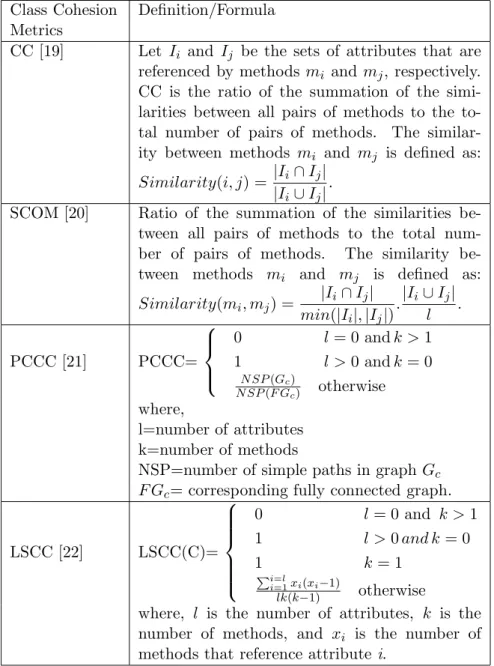
• Connection magnitude-based metrics count the accessing meth-ods per attribute and indirectly find an attribute-sharing index in terms of the count (instead of computing direct attribute-sharing between methods). These metrics are addressed in Tables 8-11.
Table 2. Interface-based metrics Class Cohesion Definition/Formula
Metrics
CAMC [3] CAM C = a
kl, where,
l is the number of distinct parameter types, kis the number of methods and ais the summation of the number of distinct parameter types of each method in the class.
NHD [4] Let k and l have the same definitions as above for CAMC, and xj be the number of methods
that have a parameter of type j. Then,
N HD = 1− 2
lk(k−1) Pl
j=1xj(k−xj).
MMAC [5] Let xi be the number of methods that have a
parameter or a return of type i.
M M AC(C) =
0 k= 0 or l= 0
1 k= 1
Pi=l
i=1xi(xi−1)
Table 3. Conceptual metrics Class Cohesion
Metrics
Definition/Formula
LORM [6] LORM=Total number of relations in the class / Total number of possible relations to the class, where,
Total number of relations in the class = num-ber of pairs of methods in the class for which one method contains conceptual relations form-ing external links out of the set of concepts that belong to the method to or from the set of con-cepts belonging to another method in the class. N= total number of member functions (methods) in the class.
Total number of possible relations = N(N −1)
2 .
C3 [7] Let M(C) ={m1, ..., mn}be the set of methods
of class, Vmi and Vmj be the vectors
correspond-ing to the mi, mj ∈M(C). Then
C3 = (
ACSM, if ACSM >0
0 otherwise ,
where
CSM(mi, mj) = Vt
mi.Vmj
|Vmi|×|Vmj|
ACSM = N1 PN
i=1CSM(mi, mj)
N =Cn2
LCSM [7] Let Mi = {mj|CSM(mi, mj) >
ACSM(C), mi 6=mj} and
P = (Mi, Mj)|Mi∩Mj =∅ and
Q= (Mi, Mj)|Mi∩Mj 6=∅
Then, LCSM(C)=
(
|P| − |Q|, if |P|>|Q|
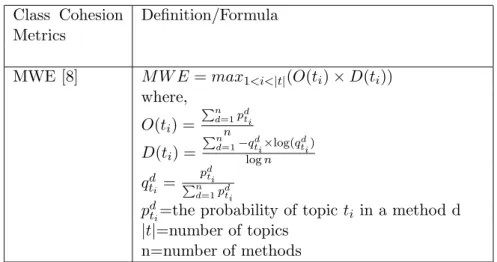
Table 4. Conceptual metrics (continuation of Table 3) Class Cohesion
Metrics
Definition/Formula
MWE [8] M W E=max1<i<|t|(O(ti)×D(ti))
where, O(ti) =
Pn d=1pdti
n
D(ti) =
Pn
d=1−qtid×log(qdti)
logn
qdti = p
d ti
Pn d=1pdti
pdti=the probability of topicti in a method d
|t|=number of topics n=number of methods
Table 5. Disjoint component-based metrics Class Cohesion
Metrics
Definition/Formula
LCOM1 [9] Number of pairs of methods that do not share attributes.
TLCOM [10] Number of method pairs that do not directly or transitively share a common attribute.
LC0M3 [11] Number of connected components in the graph that represents each method as a node and the sharing of at least one attribute as an edge. LCOM4 [12] Similar to LCOM3, where graph G additionally
Table 6. Pairwise connection-based metrics Class Cohesion Definition/Formula
Metrics
LCOM2 [9] Let P be the number of pairs of methods that do not share attributes and Q be the number of pairs of methods that share attributes. Then, LCOM2(C) =
(
|P| − |Q|, if |P|>|Q|
0 otherwise
TCC [13] Let NDC be the number of pairs of directly con-nected methods and NP be the maximum pos-sible number of direct or indirect connection. Then, TCC is difined as:
T CC = N DC N P .
LCC [13] Let NIC be the number of pairs of indirect con-nection in the class. Then,
LCC=N DC+N IC N P .
DCD [14] Fraction of directly connected pairs of methods,
where two methods are directly connected if they satisfy the condition mentioned above for TCC or if the two methods directly or transitively in-voke the same method.
DCI [14] Fraction of directly or transitively connected
Table 7. Pairwise connection-based metrics (continuation of Table 6) Class Cohesion Definition/Formula
Metrics
CCM [15] CCM(C) = N M PN C(C)(.N CCC) (C),
where NC(C) is the number of actual connec-tions among the methods of class, NMP(C) is the number of the maximum possible connections among the methods of the class C, NCC(C) is the number of connected components of the con-nection graphGcthat represents each method as
a node and two methods A and B are connected in the connection graph if A and B access one or more attributes in common or method A in-vokes method B or vice versa or methods A and B invoke one or more methods in common.
Table 8. Connection magnitude-based metrics Class Cohesion Definition/Formula
Metrics
LCOM5 [16] Letlbe the number of attributes, kbe the num-ber of methods and a be the summing of the number of distance attributes that are accessed by each method in a class, then
LCOM5 = a−kl l−kl.
Coh [17] Leta, kandlhave the same definitions as above, then,
Table 9. Connection magnitude-based metrics Class Cohesion Definition/Formula
Metrics
OCC [18] Consider a set of methods M={m1, ..., mn} and
a set of attributes A within the class. Let S =
{(mi, mj)∈M×M|mi invokes mj},
S∗ = {(mi, mj) ∈ M × M|(mi = mj) ∨
(∨n≥1miSnmj)},
ac(mi, a) ⇐⇒ ∃mj ∈ M s.t [(miS∗mj) ∧
(mjaccesses a)]
Rw(mi)=set of methods which are reachable by
Gw(V, E)
Gw(V, E)=weak-connection graph, where V=M(
number of methods) and E is given by:
E ={(mi, mj)∈M×M|∃a∈A s.t (ac(mi, a)∧
ac(mj, a))}
Then, OCC(C)=
(
maxi=1,...,n[|Rwn−(mi1 )|] n >1
0 n=1
PCC [19] P CC(C) = (
maxi=1,...,n[|Rsn(−mi1)|] n >1
0 n=1
where, Rs(mi)=set of methods which are
reach-able by Gs(V, E)
Gs(V, E)=strong-connection graph, where
V=M( number of methods) and E is given by:
E ={(mi, mj)∈M×M|∃a∈A s.t (wr(mi, a)∧
re(mj, a))}
wr(mi, a) ⇐⇒ ∃mj ∈ M s.t[(miS∗mj) ∧
(mjwrites data on to a)],
re(mi, a) ⇐⇒ ∃mj ∈ M s.t [(miS∗mj) ∧
(mjreads data f rom a)] and S, S∗, M, A, have
Table 10. Connection magnitude-based metrics Class Cohesion Definition/Formula
Metrics
CC [19] Let Ii and Ij be the sets of attributes that are
referenced by methods mi and mj, respectively.
CC is the ratio of the summation of the simi-larities between all pairs of methods to the to-tal number of pairs of methods. The similar-ity between methods mi and mj is defined as:
Similarity(i, j) = |Ii∩Ij|
|Ii∪Ij|
.
SCOM [20] Ratio of the summation of the similarities be-tween all pairs of methods to the total num-ber of pairs of methods. The similarity be-tween methods mi and mj is defined as:
Similarity(mi, mj) =
|Ii∩Ij|
min(|Ii|,|Ij|)
.|Ii∪Ij| l .
PCCC [21] PCCC=
0 l= 0 andk >1 1 l >0 andk= 0
N SP(Gc)
N SP(F Gc) otherwise where,
l=number of attributes k=number of methods
NSP=number of simple paths in graph Gc
F Gc= corresponding fully connected graph.
LSCC [22] LSCC(C)=
0 l= 0 and k >1 1 l >0and k = 0
1 k= 1
Pi=l
i=1xi(xi−1)
lk(k−1) otherwise
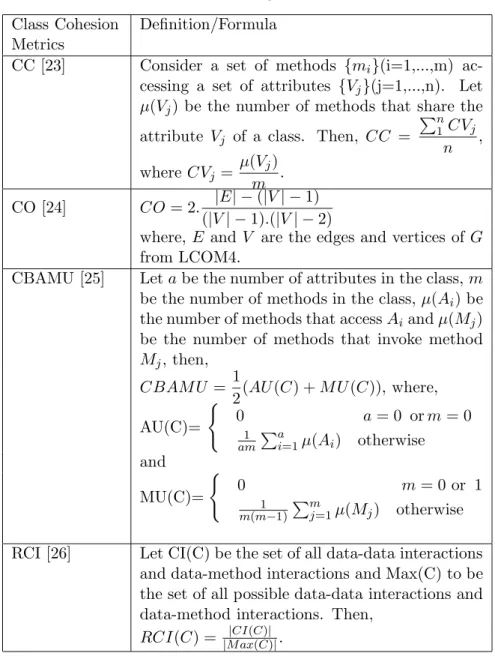
Table 11. Connection magnitude-based metrics Class Cohesion Definition/Formula
Metrics
CC [23] Consider a set of methods {mi}(i=1,...,m)
ac-cessing a set of attributes {Vj}(j=1,...,n). Let
µ(Vj) be the number of methods that share the
attribute Vj of a class. Then, CC =
Pn
1CVj
n , where CVj =
µ(Vj)
m . CO [24] CO = 2. |E| −(|V| −1)
(|V| −1).(|V| −2)
where, E and V are the edges and vertices ofG from LCOM4.
CBAMU [25] Letabe the number of attributes in the class,m be the number of methods in the class,µ(Ai) be
the number of methods that accessAiandµ(Mj)
be the number of methods that invoke method Mj, then,
CBAM U = 1
2(AU(C) +M U(C)), where, AU(C)=
(
0 a= 0 orm= 0
1
am
Pa
i=1µ(Ai) otherwise
and MU(C)=
(
0 m= 0 or 1
1
m(m−1)
Pm
j=1µ(Mj) otherwise
RCI [26] Let CI(C) be the set of all data-data interactions and data-method interactions and Max(C) to be the set of all possible data-data interactions and data-method interactions. Then,
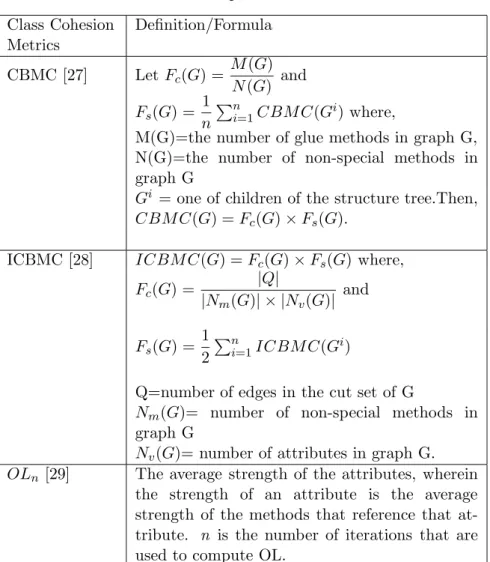
Table 12. Decomposition-based metrics Class Cohesion Definition/Formula
Metrics
CBMC [27] Let Fc(G) =
M(G) N(G) and Fs(G) =
1 n
Pn
i=1CBM C(Gi) where,
M(G)=the number of glue methods in graph G, N(G)=the number of non-special methods in graph G
Gi = one of children of the structure tree.Then, CBM C(G) =Fc(G)×Fs(G).
ICBMC [28] ICBM C(G) =Fc(G)×Fs(G) where,
Fc(G) = |
Q|
|Nm(G)| × |Nv(G)|
and
Fs(G) =
1 2
Pn
i=1ICBM C(Gi)
Q=number of edges in the cut set of G
Nm(G)= number of non-special methods in
graph G
Nv(G)= number of attributes in graph G.
OLn [29] The average strength of the attributes, wherein
Now, we evaluate these metrics and compare them through three given examples. Letai andmi denote attributes and methods,
respec-tively, the first example (Fig. 2) shows four sample classes including linking methods of a class with their attributes. The cohesion of these classes increase from C1 to C4, indeed class C1 has the lowest cohesion and class C2 has the highest cohesion. Table 13 shows the cohesion value for some these metrics.
Figure 2. Example cases for capturing degree of cohesion In Table 13, in the last column, sign (-) means that its correspond-ing metrics does not give the correct result about cohesion and sign (+) means that the result is acceptable. As it can be seen in Table 13, only LCOM4, TCC, DCD, DCI and CBAMU metrics can find the class cohesion correctly.
Table 13. Cohesion values for Fig. 2
Metric C1 C2 C3 C4
LCOM1 5 4 4 5
-LCOM2 4 2 2 4
-LCOM3 3 2 2 3
-LCOM4 3 2 2 1 +
LCOM5 0.91 0.83 0.83 0.91
-Coh 0.31 0.37 0.37 0.31
-TCC 0.16 0.33 0.33 0.5 +
LCC 0.16 0.33 0.5 0.5
-DCD 0.16 0.33 0.33 0.66 +
DCI 0.16 0.33 0.5 0.66 +
CC 0.5 1 1 0.5
-SCOM 0.5 1 1 0.5
-LSCC 0.04 0.08 0.08 0.04
-CC 0.31 0.37 0.37 0.31
Table 14. Cohesion values for Fig. 3
Metric C1 C2 C3
LCOM1 7 6 0 +
LCOM2 3 2 0 +
LCOM3 2 1 1
-LCOM4 2 1 1
-LCOM5 0.81 0 .75 0.43 +
CCM 1 0.4 1 +
OCC 0.75 1 1
-DCD 0.3 0.4 0.4
-DCI 0.6 1 1
-Co 0 1
-CC 1.33 1.66 5.33 +
SCOM 1.37 1.75 6.08 +
Coh 0.35 0.4 0.65 +
LSCC 0.75 0.1 0.42 +
TCC 0.3 0.4 1 +
CC 0.35 0.4 0.65 +
LCC 0.6 1 1
-CBAMU 0.17 0.2 0.32 +
For the third example, consider classes in Fig. 4. In this figure, class C1 has the highest cohesion and class C4 has the lowest cohesion. The cohesion values for some of the metrics are shown in Table 15. As it can be seen in Table 15, only SCOM metrics can find the class cohe-sion correctly. Note that the SCOM metrics cannot find right cohecohe-sion for classes in Fig. 2.
Figure 4. Examples for capturing degree of cohesion
Table 15. Cohesion values for Fig. 4
Metric C1 C2 C3 C4
TLCOM 0 0 0 1
-LCOM2 0 0 0 0
-TCC 1 1 1 0.67
-SCOM 1 0.89 0.61 0.39 +
CBAMU 0.5 033. 0.27 0.27
-CBMC 1 0.67 0.67 0.33
-ICBMC 0.33 0.139 0.069 0.069
-From our designed different eleven classes with different cohesion, our experiment (Tables 13-15) shows that the described cohesion as-sessing metrics for all our designed classes in these examples do not show the right cohesion. Indeed, these metrics cannot calculate class cohesion on some classes correctly.
4
Theoretical Validations of Cohesion Metrics
For theoretical validation of the class cohesion assessing metrics a framework proposed in [17]. At this framework, four properties are presented for validation of metrics that measure cohesion values. If cohesion metrics is a true metrics, it should satisfy these properties. These four properties are:
Property 1: non-negativity and normalization: non-negative in-dicates that the measured class cohesion fits to a specific interval [0, Max], and using normalization the designer can compare the cohesion of different classes.
Property 2: null value and maximum value: the cohesion of a class is equal to 0 if the class has no cohesive interactions; the cohesion is equal to Max if all possible interactions within the class are present. Property 3: monotonicity: adding cohesive interactions to the mod-ule cannot decrease its cohesion.
Property 4: cohesive modules: merging two unrelated modules into one module does not increase the individual modules cohesion. Therefore, given two classes, C1 and C2, the cohesion of the merged class C must satisfy the following condition:
cohesion(C)≤max{cohesion(C1), cohesion(C2)}
Table 16. Theoretical validation results of cohesion metrics Metric P1 P2 P3 P4 Metric P1 P2 P3 P4 LCOM1 - + + + PCC + + + + T LCOM - + + + DCI + + + +
LCOM2 - + + + CC + + - + LCOM3 - - + + MMAC + + + + LCOM4 - - + + SCOM + + - +
CO - - + + LSCC + + + +
LCOM5 - + + - CC + + + +
Coh + + + + CAMC - + +
TCC + + + + NHD - -
-LCC + + + + CBAMU + + + +
DCD + + + + ICBMC + + + +
CBMC + + - + PCCC + + + +
CCM + + + + RCI + + + +
OCC + + + + OLn + + + +
5
Lack of Discrimination Anomaly
Table 17. Some class cohesion metrics and their LDA problems Metrics When LDA problem occur?
LCOM1 1. when the number of method pairs that share common attributes is the same in both classes, regardless of the number of shared attributes. 2. when the number of method pairs that share common attributes is the same in both classes, regardless of which attributes are shared. LCOM2 1. same two LDA cases indicated for LCOM1
2. the two classes will have the same LCOM2 value, if P ≤ Q. In this case, the value of LCOM2 is zero, regardless of the magnitude of the difference between P and Q in each of the two classes.
LCOM3 and 1. same first LDA indicated for LCOM1
LCOM4 2. if the number of disjoint components is the same in both classes regardless of the interac-tions of each of the disjoint components.
LCOM5 and Coh
- two classes have the same number of attributes referenced by methods, regardless of the distri-bution of these references.
CAMC - if the two classes have the same number of dis-tinct types of parameters in their methods, re-gardless of the distribution of these cohesive in-teractions.
TCC and
DCD
- same two LDA cases indicated for LCOM1
LCC and
DCI
Table 18. Some class cohesion metrics and their LDA problems (con-tinuation of Table 17)
Metrics When LDA problem occur?
CC - if the ratio of shared attributes between each pair of methods to the distinct number of at-tributes referenced by each of the corresponding pair of methods is the same, regardless of the number of shared attributes.
LSCC 1. when each attribute in Class C1 is refer-enced by the same number of methods that ref-erence the corresponding attributes in Class C2, regardless of the distribution of these methods and their connectivity with other methods. 2. if the result ofPn
i=1xi(xi−1) is the same for
both classes, wherenis the number of attributes and xi is the number of methods that reference
attributei, regardless of the distributions or the number of references.
NHD 1. same first LDA indicated for LSCC 2. if the result ofPn
i=1xi(n−xi) is the same for
both classes, where n is the number of distinct parameter types andxiis the number of methods
6
Desirable Properties of Cohesion Metrics
The addressed class cohesion metrics can be evaluated both empiri-cally and theoretiempiri-cally. In the empirical validation it is determined whether the predicted value is consistent with the measured value. In [21], [26], [31]–[38] several methods are proposed to empirically vali-date class cohesion metrics.
In the theoretical validation it is determined whether the metrics holds the required properties. In addition to the four main properties proposed in [17] (see section 4), in literature, several properties are introduced to validate software metrics theoretically, as summarized below.
I. Monotonicity: adding interactions to the class must not decrease its cohesion. It means that after adding an interaction to the class, the modified class cohesion value will be the same as or higher than the cohesion value of the original class.
II. Representation condition of measurement theory: The metrics obtains a value that yields the same order as intuition. It means there should not be inconsistencies between empirical relations and numerical relations such that the empirical relations preserve and are preserved by the numerical relations.
III. Lack of discrimination anomaly: as described in section 5. IV. Sensitivity: adding or removing interactions to a class should change the cohesion of the class. Sensitivity is expected to increase as: 1) the number of distinct cohesion values increases and
2) the number of classes with repeated cohesion values decreases V. Normalization: allows for easy comparison of the cohesion of different classes
VI. Prescription: The metrics indicates how to enhance the mea-sured element.
The class cohesion metrics that does not have LDA problem and satisfies the other properties is expected to be a well-defined metrics. We suggest the newly introduced metrics that, first, is evaluated from LDA problem point of view. If the metrics is found to have LDA prob-lem, the researcher may decide to revise the metrics formula to solve the LDA problem. Software developers are advised to apply cohesion metrics that does not have LDA problem because such metrics is ex-pected to be more reliable in indicating cohesion.
7
Conclusion and open research problem
This paper presented the state of the art in the development and evalu-ation of class cohesion metrics. Most existing structural class cohesion metrics is addressed and evaluated from different aspects such as on our eleven designed classes, theoretical validations, and LDA problem. Our experimental results showed that whereas important progresses have already taken place, but there is no comprehensive and reliable class cohesion metrics. Therefore, there are still many possibilities for further research that will benefit software engineers everywhere. Fol-lowing cases can be considered as a research problem:
1. There are no standard benchmarks for evaluating the class cohesion metrics. Researcher needs comprehensive benchmarks for evaluating the new designed metrics and comparing it with other metrics.
2. We believe the four properties described in section 4 should be re-vised. For example, due to LDA problem, using the normalization and monotonicity properties, a designer necessarily cannot distinguish the cohesion level of different classes.
3. Information theory based formulas are not addressed in this area. We think that class cohesion can be assessed in terms of information loss. It seems a class with low information loss to have high cohesion. However, this is a research question.
References
[1] R. S. Pressman, Software engineering: a practitioner’s approach. Palgrave Macmillan, 2005.
[2] R. C. Martin, Agile software development: principles, patterns, and practices. Prentice Hall PTR, 2003.
[3] J. Bansiya, L. Etzkorn, C. Davis, and W. Li, “A class cohesion metric for object-oriented designs,” Journal of Object-Oriented Programming, vol. 11, no. 8, pp. 47–52, 1999.
[4] S. Counsell, S. Swift, and J. Crampton, “The interpretation and utility of three cohesion metrics for object-oriented design,”
ACM Transactions on Software Engineering and Methodology (TOSEM), vol. 15, no. 2, pp. 123–149, 2006.
[5] J. Al Dallal and L. C. Briand, “An object-oriented high-level design-based class cohesion metric,” Information and software technology, vol. 52, no. 12, pp. 1346–1361, 2010.
[6] L. Etzkorn and H. Delugach, “Towards a semantic metrics suite for object-oriented design,” inTechnology of Object-Oriented Lan-guages and Systems, 2000. TOOLS 34. Proceedings. 34th Interna-tional Conference on. IEEE, 2000, pp. 71–80.
[7] A. Marcus and D. Poshyvanyk, “The conceptual cohesion of classes,” in21st IEEE International Conference on Software Main-tenance (ICSM’05). IEEE, 2005, pp. 133–142.
[8] Y. Liu, D. Poshyvanyk, R. Ferenc, T. Gyim´othy, and N. Chriso-choides, “Modeling class cohesion as mixtures of latent topics,”
inSoftware Maintenance, 2009. ICSM 2009. IEEE International
Conference on. IEEE, 2009, pp. 233–242.
[10] J. Al Dallal, “Transitive-based object-oriented lack-of-cohesion metric,”Procedia computer science, vol. 3, pp. 1581–1587, 2011. [11] E. Wigner, “On a modification of the rayleigh-schr¨odinger
pertur-bation theory,” inPart I: Physical Chemistry. Part II: Solid State Physics. Springer, 1997, pp. 131–136.
[12] M. Hitz and B. Montazeri, Measuring coupling and cohesion in object-oriented systems. Citeseer, 1995.
[13] J. M. Bieman and B.-K. Kang, “Cohesion and reuse in an object-oriented system,” inACM SIGSOFT Software Engineering Notes, vol. 20, no. SI. ACM, 1995, pp. 259–262.
[14] L. Badri and M. Badri, “A proposal of a new class cohesion cri-terion: an empirical study,”Journal of Object Technology, vol. 3, no. 4, pp. 145–159, 2004.
[15] A. Jarallah, M. Wasiq, and M. Ahmed, “Principle and metrics for cohesion-based object-oriented component assessment,” 2001, confidential Draft Copy.
[16] B. Henderson-Sellers, L. L. Constantine, and I. M. Graham, “Cou-pling and cohesion (towards a valid metrics suite for object-oriented analysis and design),” Object Oriented Systems, vol. 3, no. 3, pp. 143–158, 1996.
[17] L. C. Briand, J. W. Daly, and J. W¨ust, “A unified framework for cohesion measurement in object-oriented systems,” Empirical Software Engineering, vol. 3, no. 1, pp. 65–117, 1998.
[18] H. Aman, K. Yamasaki, H. Yamada, and M.-T. Noda, “A proposal of class cohesion metrics using sizes of cohesive parts,” inProc. of Fifth Joint Conference on Knowledge-based Software Engineering, 2002, pp. 102–107.
[20] L. Fern´andez and R. Pe˜na, “A sensitive metric of class cohesion,” vol. 13, pp. 82–91, 2006.
[21] J. Al Dallal, “Fault prediction and the discriminative powers of connectivity-based object-oriented class cohesion metrics,” Infor-mation and Software Technology, vol. 54, no. 4, pp. 396–416, 2012. [22] J. Al Dallal and L. C. Briand, “A precise method-method interaction-based cohesion metric for object-oriented classes,”
ACM Transactions on Software Engineering and Methodology (TOSEM), vol. 21, no. 2, p. 8, 2012.
[23] S. Mal and K. Rajnish, “New class cohesion metric: An empirical view,”International Journal of Multimedia and Ubiquitous Engi-neering, vol. 9, no. 6, pp. 367–376, 2014.
[24] M. Hitz and B. Montazeri, “Chidamber and kemerer’s metrics suite: a measurement theory perspective,”IEEE Transactions on Software Engineering, vol. 22, no. 4, pp. 267–271, 1996.
[25] A. Adam, “Implementation and validation of object-oriented design-level cohesion metrics,” Ph.D. dissertation, King Fahd Uni-versity of Petroleum and Minerals, 2005.
[26] L. Briand, S. Morasca, and V. R. Basili, “Defining and validating high-level design metrics,” University of Maryland at College Park, Tech. Rep.
[27] H. S. Chae, Y. R. Kwon, and D.-H. Bae, “A cohesion mea-sure for object-oriented classes,” Software-Practice and Experi-ence, vol. 30, no. 12, pp. 1405–1432, 2000.
[28] Y. Zhou, B. Xu, J. Zhao, and H. Yang, “Icbmc: an improved co-hesion measure for classes,” inSoftware Maintenance, 2002. Pro-ceedings. International Conference on. IEEE, 2002, pp. 44–53. [29] X. Yang, “Research on class cohesion measures,” Ph.D.
[30] J. Al Dallal, “Measuring the discriminative power of object-oriented class cohesion metrics,” IEEE Transactions on Software Engineering, vol. 37, no. 6, pp. 788–804, 2011.
[31] I. Hermadi, K. El-Badawi, and J. Al-Ghamdi, “Theoretical vali-dation of cohesion metrics in object oriented systems,” in Inter-national Arab Conference on Information Technology, 2002, pp. 16–19.
[32] L. C. Briand, J. W¨ust, J. W. Daly, and D. V. Porter, “Exploring the relationships between design measures and software quality in object-oriented systems,”Journal of systems and software, vol. 51, no. 3, pp. 245–273, 2000.
[33] L. C. Briand, J. W¨ust, and H. Lounis, “Replicated case studies for investigating quality factors in object-oriented designs,”Empirical software engineering, vol. 6, no. 1, pp. 11–58, 2001.
[34] L. C. Briand and J. W¨ust, “Empirical studies of quality models in object-oriented systems,” Advances in computers, vol. 56, pp. 97–166, 2002.
[35] M. Alshayeb and W. Li, “An empirical validation of object-oriented metrics in two different iterative software processes,”
IEEE Transactions on software engineering, vol. 29, no. 11, pp. 1043–1049, 2003.
[36] T. Gyimothy, R. Ferenc, and I. Siket, “Empirical validation of object-oriented metrics on open source software for fault predic-tion,”IEEE Transactions on Software engineering, vol. 31, no. 10, pp. 897–910, 2005.
sys-[38] A. Marcus, D. Poshyvanyk, and R. Ferenc, “Using the conceptual cohesion of classes for fault prediction in object-oriented systems,”
IEEE Transactions on Software Engineering, vol. 34, no. 2, pp. 287–300, 2008.
Habib Izadkhah, Maryam Hooshyar, Received August 25, 2016
Habib Izadkhah
Department of Computer Science, Faculty of Mathematical Sciences, University of Tabriz, Tabriz, Iran E–mail: [email protected]
Maryam Hooshyar