MARCOS SOARES LOPES
NUMBER OF SNP MARKERS FOR PARENTAL IDENTIFICATION, KINSHIP AND INBREEDING ESTIMATION IN PIGS
Dissertation presented to the Animal Science Graduate Program of the Universidade Federal de Viçosa, in partial fulfillment of the requirements for degree of Master Scientiae.
VIÇOSA
ii AKNOWLEDGEMENTS
Firstly, I would like to thank God for the care and comfort in every moment and for giving me strength to finish this study.
Sincere thanks also to:
The most important people in my life, my parents Raimundo and Maria, that always supported me and believed in me;
My brothers and sisters for giving me all support and friendship; My uncle Nininho and my aunt Maria for taking care of me as a son;
República Fim do Mundo (Paulo, João, Lucas, Sussu and “agregados”: Pedro, Mateus, Gustavo, Jana, Emília, Vítor, Quequé, etc.) and Cataputas House (Paulinho, Xuxu e Gui) for providing me the best years of my life;
My friends Letícia, Tiago, Sílvia, Elba and Cris for all care, patience, for believing in me and for our frindship friendship;
My friends from LABTEC (Animal Biotechnology Laboratory), Carlos, Kleibe, Lucas, Nicola, Mayara, Priscila, Renata and my bosses Ana Paula, Kati, Bruna and Débora for continuous knowledge, learning exchange and pleasant workplace;
Federal University of Viçosa (UFV), in special to the Animal Science Department (DZO), for the opportunity of carrying out the course;
Professor Simone Eliza Facioni Guimarães, my adviser, for her excellent supervision, competence, teachings, friendship and opportunities given to me;
Professor Paulo Sávio Lopes, my first adviser during my bachelor, for his valuable teachings, patience and friendship;
Professor Fabyano Fonseca for all patience, his help during analyses and R lessons;
IPG team, especially Bruno, Naomi, Jascha, Egbert, Hanneke, Pramod, Barbara and Jan Merks for the friendship, learning exchange and pleasant workplace during my training time;
Foundation for the Coordination of High Education and Graduate Training (CAPES) for the financial support;
iii TABLE OF CONTENTS
RESUMO ... iv
ABSTRACT ... vi
Chapter 1
GENERAL INTRODUCTION ... 1
Chapter 2
A SNP SET FOR PATERNAL IDENTIFICATION TO REDUCE THE COSTS OF TRAIT RECORDING IN COMMERCIAL PIG BREEDING ... 6
Chapter 3
NUMBER OF INFORMATIVE SNPS NEEDED FOR INBREEDING AND KINSHIP ESTIMATION IN COMMERCIAL PIGS ... 24
Chapter 4
iv RESUMO
LOPES, Marcos Soares, M.Sc., Universidade Federal de Viçosa, Fevereiro, 2011. Número de marcadores SNP para estimação de consangüinidade, parentesco e identificação de paternidade em suínos. Orientadora: Simone Eliza Facioni Guimarães. Co-orientadores: Egbert Frank Knol e Fabyano Fonseca e Silva.
vi ABSTRACT
LOPES, Marcos Soares, M.Sc., Universidade Federal de Viçosa, February, 2011. Number of SNP markers for parental identification, kinship and inbreeding estimation in pigs. Adviser: Simone Eliza Facioni Guimarães. Co-Advisers: Egbert Frank Knol and Fabyano Fonseca e Silva.
1 Chapter 1
GENERAL INTRODUCTION
DNA is a useful tool for animal identification, remaining intact even after slaughter. Consequently, molecular markers are very attractive for relationship identification between individuals in absence of on-farm pedigree information. From a piece of meat the breed, parents and farm of origin of the animal can be traced back (Hayes et al., 2005).
Molecular biology has reached great advances in the last decades with the development of dense maps of single nucleotide polymorphisms (SNPs) and high-throughput sequencing. SNPs are polymorphisms resulting from changes in a single base of the genome differing between members of the same species or paired chromosomes in an individual. In order to be considered as a SNP, the mutation has to show an alternative allele frequency ≥ 1% in the population evaluated (Brookes, 1999, Vignal et al., 2002). Moreover, in the human genome it was observed that 90% of total polymorphisms were SNPs, being an estimative of one marker every 1,000 bases or less (Dawson, 1999; Weiner and Hudson, 2002).
Compared with microsatellite markers, SNPs are more abundant in the genome, present lower error rate and costs in the genotyping process, and are genetically more stable due to lower mutation rate. The availability of markers and reduced genotyping costs are the main appeals of SNPs for the study of relationship between animals.
In animal breeding, complete and reliable pedigree information are essential to achieve genetic progress, while pedigree mistakes can reduce the expected gain (Long et al., 1990, Visscher et al., 2002, Senneke et al., 2004). Traditional relationship matrix built based on paper pedigree shows two reasons for accuracy losses: 1) pedigree errors and 2) inbreeding and relationship coefficients are, almost by definition, over or underestimated. By using a reduced set of markers, it is possible to investigate or identify the relationship between animals in absence of traditional pedigree, the mentioned problems will be largely solved and more accurate genetic values will be estimated.
2 Therefore, proposals of research focused on the practical application of these tools have gotten attention of breeding companies and researchers in general.
Paternity testing
Efficiency of molecular markers have been proven for the verification of information inserted in conventional pedigree (parental verification), but also to identify the parents of animals which had no pedigree information collected (parental identification). Breeding programs have great interest on parental identification, since for the study of traits of low incidence such as disease, genetic defects and mortality, a large number of animals with pedigree records is required. However, finishing pigs are not individually identified, being a barrier for the study of such traits. Moreover, the cost for individual identification of many animals is high. Therefore, the identification of paternity performed using molecular markers allows the study of characteristics of low incidence with reduced costs if only affected animals can be genotyped.
Studies evaluating the power of highly polymorphic microsatellite markers for paternity testing and traceability have achieved excellent results in pigs and cattle (Heaton et al., 2002, Van Eenennaam et al., 2007, Goffaux et al., 2005, Ballester et al. , 2007, Rohrer et al., 2007, Fisher et al., 2009, Hara et al., 2010). However, the genotyping cost of these markers has been the major limiting factor for practical applications.
In recent years thousands of SNPs have been identified in livestock species and genotyping costs have decreased. On the other hand, SNPs are usually biallelic, while microsatellites may have many alleles. The paternity exclusion probability (Pe) of molecular markers is directly related to the number and frequency of their alleles. Therefore, a larger number of SNPs is necessary to reach the same Pe achieved by few microsatellites.
3
Inbreeding and kinship estimation
Until the discovery of SNPs, the low availability of markers was described as the main limitation for the use of molecular markers in inbreeding and kinship estimation (Garant & Kruuk, 2005). Widely spaced markers, such as microsatellites, could indicate the sharing of long chromosome segments within closely related family members, but could not detect the many minor genetic effects shared by distant relatives (VanRaden et al., 2009). Moreover, according to Meuwissen (2007) marker genotypes for thousands of loci across the genome can measure genetic similarity more precisely.
Increasing the number of markers available increase the challenges as well. With dense maps of markers the proportion of tightly linked SNPs is large, generating redundant information (Smouse, 2010). Evaluation of linkage disequilibrium (LD) has been indicated as the first step before starting genomic relationship estimation (Santure et al., 2010; Rolf et al., 2010). Using unlinked markers it is possible to obtain less variable results of genomic relationship (Santure et al., 2010).
Another important point discussed about genomic inbreeding and kinship is the use of allele frequency in the base population. VanRaden (2008) proposed different methodologies to elaborate the genomic relationship matrix and observed that higher correlation between traditional and molecular estimative were found using allele frequencies in the base population rather than simple allele frequency counting alleles in the evaluated animals. However, to access the allele frequencies of the founders is not an easy task due the fact that modern pig lines were developed decades ago.
How and which SNPs to select in order to study relationship between individuals using pedigree-free methods is the goal to be reached. The main goal of this study was to evaluate the number of informative SNPs needed for inbreeding and kinship estimation and parental identification.
REFERENCES
4 Ballester M, Mercadé A, van Haandel B, Santamartina J, Sánchez A: Individual identification and genetic traceability in the pig using the SNPlexTM genotyping system. Anim Genet 2007, 37:1-3.
Brookes AJ: The essence of SNPs. Gene 1999, 234:177–186.
Dawson E: SNP maps: More markers needed? Mol Med Today 1999, 5:419–420. Fisher PJ, Malthus B, Walker MC, Corbett G, Spelman RJ: The number of single
nucleotide polymorphisms and on-farm data required for whole-herd parentage testing in dairy cattle herds. J Dairy Sci 2009, 92:369-374.
Garant D, Kruuk LEB: How to use molecular marker data to measure evolutionary
parameters in wild populations. Mol Ecol 2005, 14:1843–1859.
Goffaux F, China B, Dams L, Clinquart A, Daube G: Development of a genetic traceability test in pig based on single nucleotide polymorphism detection. Forensic Sci Int 2005, 151:239-247.
Hara K, Watanabe S, Mukai H, Mannen H: Development of SNP markers for individual identification and parentage test in a Japanese Black cattle population. J Anim Sci 2010, 81:152-157.
Hayes B, Sonneson AK, Gjerde B: Evaluation of three strategies using DNA
markers for traceability in aquaculture species. Aquaculture 2005, 250:70–81.
Heaton MP, Harhay GP, Bennett GL, Stone RT, Grosse WM, Casas E, Keele JW, Smith TPL, Chitko-McKown CG, Laegreid WW: Selection and use of SNP markers for animal identification and paternity analysis in U.S. beef cattle. Mamm Genome 2002, 13:272-281.
Long TE, Johnson RK, Keele JW: Effects of errors in pedigree on three methods of estimating breeding value for litter size, backfat and average daily gain in swine. J Anim Sci 1990, 68:4069-4078.
Meuwissen T: Genomic selection: Marker-assisted selection on a genome wide
5 Rohrer GA, Freking BA, Nonneman D: Single nucleotide polymorphisms for pig
identification and parentage exclusion. Anim Genet 2007, 38:253-258.
Rolf MM, Taylor JF, Schnabel RD, McKay SD, McClure MC, Northcutt SL, Kerley MS, Weaber RL: Impact of reduced marker set estimation of genomic relationship matrices on genomic selection for feed efficiency in Angus cattle. BMC Genet 2010, 11:24.
Santure AW, Stapley J, Ball AD, Birkhead TR, Burke T, Slate J: On the use of large marker panels to estimate inbreeding and relatedness: empirical and simulation studies of a pedigreed zebra finch population typed at 771 SNPs. Mol Ecol 2010, 19:1439–1451.
Senneke SL, MacNeil MD, Van Vleck LD: Effects of sire misidentification on estimates of genetic parameters for birth and weaning weights in Hereford cattle. J Anim Sci 2004, 82:2307-2312
Smouse PE: How many SNPs are enough? Mol Ecol 2010, 19:1265-1266.
Van Eenennaam AL, Weaber RL, Drake DJ, Penedo MCT, Quaas RL, Pollak EJ: DNA-based paternity analysis and genetic evaluation in a large, commercial cattle
ranch setting. J Anim Sci 2007, 85:3159–3169.
VanRaden PM: Efficient Methods to Compute Genomic Predictions. J Dairy Sci 2008, 91:4414-4423.
VanRaden PM, Van Tassell CP, Wiggans GR, Sonstegard TS, Schnabel RD, Taylor JF, Schenkel FS: Reliability of genomic predictions for North American Holstein
bulls. J Dairy Sci 2009, 92:16–24
Vignal A, Milan D, Sancristobal M., et al.: A review on SNP and other types of molecular markers and their use in animal genetics. Genet Sel Evol 2002, 34:275-305.
Visscher PM, Woolliams JA, Smith D, Williams JL: Estimation of pedigree errors in the UK dairy population using microsatellite markers and the impact on selection. J Dairy Sci 2002, 85:2368-2375.
6 Chapter 2
A SNP SET FOR PATERNAL IDENTIFICATION TO REDUCE THE COSTS OF TRAIT RECORDING IN COMMERCIAL PIG BREEDING
B. Harlizius*, M. S. Lopes§, N. Duijvesteijn*, L.H.P. van de Goor †, W. A. van Haeringen†, H. Panneman †, S.E.F. Guimarães§, J.W. M. Merks*, and E.F. Knol*
*
IPG, Institute for Pig Genetics B.V., P.O. Box 43, 6640 AA Beuningen, The Netherlands
§
Departamento de Zootecnia, Universidade Federal de Viçosa, 36571-000, Viçosa, MG, Brazil
†Dr. Van Haeringen Laboratorium B.V., P.O.Box 408, 6700 AK Wageningen, The Netherlands
7 ABSTRACT
In animal breeding, recording of correct pedigrees is essential to achieve genetic progress. DNA markers are useful to verify the on-farm pedigree records (parental verification) but can also be used to assign parents retrospectively (parental identification). This approach could reduce the costs of recording for traits with low incidence, such as those related to diseases or mortality. In this study, single nucleotide polymorphisms (SNPs) were used to assign the true sires of 368 purebred animals from a Duroc-based sire line and 140 crossbred offspring from a commercial pig population. Some of the sires were closely related. There were three full sibs and 17 half-sibs among the true fathers and 4 full sibs and 35 half sibs among all putative fathers. To define the number of SNPs necessary, five SNP panels (40, 60, 80, 100 and 120 SNPs) were assembled from the Illumina PorcineSNP60 Beadchip based on minor allele frequency (> 0.3), high genotyping call rate (≥ 90%) and equal spacing across the genome. For paternal identification considering only the 66 true sires in the dataset, 60 SNPs resulted already in 100% correct assignment of the sire. Including additional putative sires (n=304), 80 SNPs were sufficient for 100% correct assignment of the sire. The following criteria were derived to identify the correct sire for the current data set: the LOD score for assigning the correct sire was ≥ 5, the number of mismatches was ≤ 1, and the difference in the LOD score between the 1st and the 2nd most likely sire was > 5. If the correct sire was not present among all putative sires, the mean LOD for the most likely sire was close to 0 or negative using 100 SNPs. More SNPs would be needed for paternal identification if the number of putative sires increased and the degree of relatedness was higher than in the data set used here. The threshold for the number of mismatches can be adjusted according to the practical situation to account for the trade-off between false negatives and false positives. The latter can efficiently be avoided ensuring that the correct father is being sampled. Nevertheless, a restriction on the number of putative sires is advisable to reduce the risk of assigning close relatives.
8 INTRODUCTION
Pedigree information is widely recorded in animal breeding and forms the basis of any breeding program. Correct pedigree information is necessary for the accurate estimation of breeding values and prediction of genetic gain, while incorrect records can reduce genetic progress (Long et al., 1990, Visscher et al., 2002, Senneke et al., 2004). In commercial operations, it is not a common practice to identify finishers individually and to maintain pedigree records. Individual identification of piglets at birth with ear tags or tattoos is too expensive. However, genetic selection for traits with low incidence (disease traits, genetic defects, and mortality) requires records from a large number (> 100,000) of finishing pigs. For these traits, large progeny groups per sire (1,000-2,000) are needed to ensure a more precise estimate of incidence. Retrospective assignment of the true sire (paternal identification) for affected animals only can reduce the costs of trait recording in finishing pigs substantially.
Several SNP panels have been developed and evaluated for parentage testing in cattle (Heaton et al., 2002, Van Eenennaam et al., 2007, Fisher et al., 2009, Hara et al., 2010). Also in pigs, SNP sets for parental verification have been developed (Goffaux et al., 2005, Ballester et al., 2007, Rohrer et al., 2007). Several studies have been carried out in order to evaluate the power of DNA markers for parental identification and traceability in livestock (Hayes et al., 2005, Gomez-Raya et al., 2008). The concept of parental identification was extended by Hill et al. (2008) for application in product tracing particularly in pigs. Based on simulation, they calculated that 100 to 150 SNPs with a minor allele frequencies > 0.3 would be sufficient to trace a piece of meat back to the parents and to the farm of origin.
9 MATERIALS AND METHODS
Animals and DNA Isolation
Genotypes from a total of 878 pigs from Dutch farms and artificial insemination (AI) stations were available. There were 508 offspring originating from 66 sires and with on-farm pedigree records. All the true sires from three purebred sire lines (Duroc-based L1 n=34, Large White composite L2 n=24, and Pietrain L3 n=8) and additional 304 boars (putative sires) from the same AI station, line (L1 n=159, L2 n=66 and L3 n=79) were genotyped. The progeny consisted of 368 purebred L1 animals and 140 crossbred offspring from L1 (30) , L2 (84), and L3 (26) sires and crossbred dams (90 offspring from Dutch Landrace x Large White sows, and 50 offspring from Belgian Landrace x Large White sows). There were two full sibs per family. This experiment was conducted strictly in line with the Dutch law on the protection of animals.
In total, 155 animals were genotyped using the KASPar system while the genotypes of 723 animals were available from another study (Duijvesteijn et al., 2010) using the PorcineSNP60 Beadchip. For genotyping with the PorcineSNP60 Beadchip, DNA was prepared from EDTA blood, hair roots or meat samples, using the Gentra Puregene DNA Preparation Kit (Minneapolis, MN), according to the manufacturer’s instructions. The extraction was based on a modified salt precipitation method. DNA concentration was measured on the Nanodrop ND-1000 Spectrophotometer (NanoDrop Technologies, LLC, Wilmington, Delaware) and the DNA quality was checked by running a sample on an agarose gel. For genotyping with the KASPar chemistry, genomic DNA was isolated from blood and hair roots using low-cost routine procedures. While using blood samples, 10 μl of blood was washed 3 times in 150 μl Tris-HCL based buffer. The cell pellet was lysed with proteinase K (0.5 units for 45 min at 56°C followed by heat inactivation). For hair root samples, approximately 8 hair follicles were placed into a PCR tube and lysed with proteinase K (6 units overnight at 56°C followed by heat inactivation).
Selection of SNPs and Genotyping
10 and Landrace determined by Ramos et al (2009). Three hundred SNPs with a MAF of > 0.3 were selected. The physical position was derived from the porcine Ensembl build9 database (http://www.ensembl.org).
Assay design using (incomplete) sequences from the Illumina PorcineSNP60 Beadchip was performed for a selection of 150 SNPs with the highest MAF across the four breeds. The SNPs were genotyped using the KASPar chemistry, which is a competitive allele specific PCR SNP genotyping system using FRET quencher cassette oligos using the manufacturers’ instructions (KBioscience, Herts, UK). From these, 14 SNPs were discarded for various reasons (e.g. weak or absent amplification, presence of > 3 genotypes, incorrect genotype distribution). From the remaining 136 SNPs with optimal amplification profiles, 16 were discarded due to low call rate (< 0.90).
Paternal Identification
The on-farm paper pedigree records of all the offspring contained identifications of sires as well as dams. However, the genotype information was available only for the sire. Exclusion probabilities (P) of each SNP and combined exclusion probability (Pe) for the set of SNPs employed in the different SNP panels were determined according to Jamieson and Taylor (1997), based on allele frequency of the true and putative sires as described below:
n i n i i i n i i n ii p p p
p P 1 1 4 3 1 2 2 1 2 3 4 ) ( 2 4 1 ) 1 )...( 1 )( 1 )( 1 (
1 P1 P2 P3 Pk
Pe ,
where pi is the frequency of the ith SNP alleles, n is the number of alleles and k is the number of SNPs.
Determination of allele frequency, estimation of polymorphic information content (PIC), and paternal identification and verification were carried out using CERVUS software (Kalinowski et al., 2007, http://www.fieldgenetics.com). Three sire scenarios were investigated for 508 offspring:
11 Scenario 2: The goal was to evaluate the SNPs for their ability to identify the true sire if the on-farm pedigree is not available, (e.g. if the information about the sow insemination is not known then all the boars from the AI station could be possible sires). Hence, all sires (n=370) were considered as candidate sires.
Scenario 3: The goal of this scenario was to evaluate the exclusion power of the SNP panel if the true sire was not sampled. The true sires from the on-farm pedigree were dropped from the analysis and only the putative sires from the AI station (n=304) were classified as candidate sires.
For all scenarios, five panels of SNPs were tested. SNPs were dropped from the analysis according to their MAF, missing genotype frequency and spacing along the genome generating panels of 120, 100, 80, 60 and 40 SNPs.
In the CERVUS software, the genotype of an offspring is compared with the genotypes of the candidate fathers. To derive a confidence threshold, for each locus the likelihood of a specific genotype is calculated from the allele frequencies in the population. The critical LOD values for the confidence levels are determined by simulation deriving a distribution of LOD scores. Confidence in assignment is defined as the proportion of all candidate parents exceeding this critical LOD score. Parameters used in the simulation by CERVUS were set at 10,000 offspring, 70 candidate sires for scenario 1 and 370 sires for the others scenarios. The proportion of candidate sires sampled was set at 95, 100 and 80% for scenarios 1, 2 and 3, respectively. The proportion of loci mistyped was kept at 1%. The proportion of loci typed and the minimum number of loci typed were kept at levels suggested by the program after allele frequency analysis. For each offspring the results for the two most likely sires were calculated. The confidence level was set at 99%.
Positive assignments of CERVUS were further evaluated to determine thresholds for the LOD scores of the first and second most likely father and the number of mismatches to achieve high rates of assignments and at the same time control the rate of false assignments.
RESULTS
SNP Genotypes
12 animals with 4668 genotypes from both genotyping systems indicated that 23 animals (53%) showed 1 (13 animals), 2 (5 animals) and 3 (5 animals) mismatches, respectively. The KAspar system using low quality DNA from a cheap extraction method showed a reduced call rate of 89.3% but only 0.81% mismatches (38/4668) with the genotypes generated with the PorcineSNP60 Beadchip.
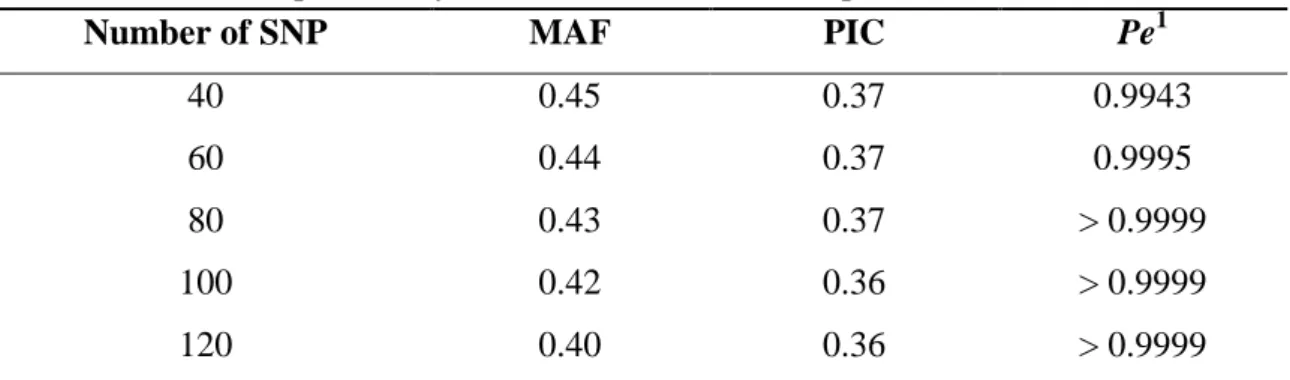
The values of MAF, PIC and Pe for all SNPs in the five different panels are summarized in Table 1.
Table 1. Minor allele frequency (MAF), polymorphic information content (PIC), and combined exclusion probability (Pe) for the different SNP panels
Number of SNP MAF PIC Pe1
40 0.45 0.37 0.9943
60 0.44 0.37 0.9995
80 0.43 0.37 > 0.9999
100 0.42 0.36 > 0.9999
120 0.40 0.36 > 0.9999
1
Pe: Combined probability of excluding an animal as a possible sire when the genotype records of the mother are not available.
The mean MAF ranged from 0.39 using 120 SNPs to 0.45 when 40 SNPs were utilized. As observed for the MAF, the mean PIC also increased when the number of SNPs decreased. The average of PIC was 0.37 for panels of 40, 60 and 80 SNPs and 0.36 for the other panels. Analyzing all 120 SNPs individually, the PIC ranged from 0.28 to 0.38.
Combined exclusion probabilities (Pe) using the method suggested by Jamieson and Taylor (1997) were above 99.99% for panels with 80, 100 and 120 SNPs and 99.43% and 99.45% working with 40 and 60 SNPs, respectively.
Paternity Analyses
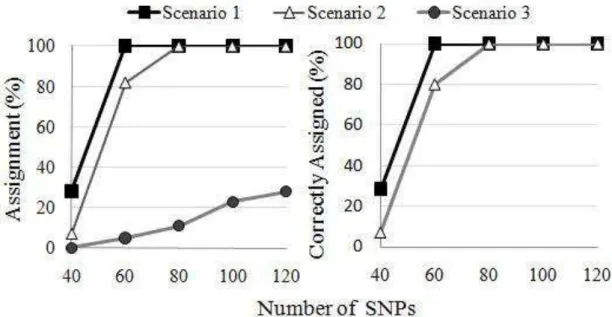
13 achieved in scenario 1 and 7% in scenario 2. All assigned sires were the true sires. When the true sires were omitted (scenario 3) the rates of assignments were 0, 5, 11, 23 and 28%, for the panels with 40, 60, 80,100 and 120 SNPs, respectively.
Figure 1. Rates of all assignments (scenario 1, 2 and 3) and correct assignments (scenario 1 and 2) for the panels with different numbers of SNPs.
14 Figure 2. The mean LOD score for the most likely father in scenarios 1, 2 and 3.
15 Figure 3. The mean LOD score for the second most likely father in scenario 1 and 2.
16
Table 2. Mean number of mismatches between the most likely father (1st) and the
offspring in the three different scenarios and between the second most likely father (2nd) and the offspring in scenario 1 and 2
Number of SNPs
Scenario 1 Scenario 2 Scenario 3
1st 2nd 1st 2nd 1st
40 0.01 0.97 0.01 0.44 0.51
60 0.01 2.21 0.01 1.38 1.53
80 0.02 3.18 0.02 2.24 2.46
100 0.02 4.21 0.02 3.12 3.44
120 0.03 5.36 0.03 4.32 4.33
DISCUSSION
Exclusion probability
The current study analyzed a panel of SNPs with high probability of exclusion for paternity analysis (MAF > 0.22, mean PIC = 0.36, Pe > 0.9999 for all 120 SNPs). In order to establish a panel of markers for paternal identification in a commercial cattle ranch, Van Eenennaam et al. (2007) calculated for 28 SNPs with an average MAF > 0.18 and PIC of 0.35, a theoretical power of exclusion of 0.9560 if the dam genotype was not available. Recently, Rohrer et al. (2007) evaluated the power of exclusion for parentage tests (parental verification) in four American purebred pig lines for a set of 60 SNPs with MAF > 0.15. In the cases where the genotype of one of the parents was not available, the authors estimated a parentage exclusion probability of 0.9974 (all four purebred lines), 0.9594 (Hampshire), 0.9857 (Duroc), 0.9950 (Landrace) and 0.9963 (Yorkshire). In the present study the power of exclusion of the markers was not calculated within each line. All animals from the three different lines were managed as one single population, because for practical applications one SNP panel is required for paternity identification across different lines.
17 3 full sibs and 17 half sibs, on average, among the true fathers (scenario 1), and 4 full sibs and 35 half sibs among all putative fathers (scenario 2). In addition, not just one individual male has to be excluded but a large number of sires (paternal identification). Sherman et al. (2004) calculated a probability of unambiguous parentage (PUP) for a specific dataset taking sire relatedness and the total number of sires into account. They showed that the theoretical exclusion probability is overestimated. This explains why additional markers were required to achieve a high rate of correct assignments in this study.
Thresholds for Parameters for Paternal Identification
The assignment of a candidate father as the most likely father with high probability does not necessarily mean that the indicated sire is the true father. After checking positive assignments from CERVUS, the thresholds for the critical LOD scores and the number of mismatches for a situation where the true father is not known were derived.
Critical LOD scores: According to Marshall et al. (1998) a positive LOD score
means that the candidate parent is more likely to be the true parent than not the true parent. Hill et al. (2008) advocate that an observed LOD score higher than 5 is strong evidence that the sire has been identified, whereas a negative LOD score gives strong evidence that the sire has not been found. In the current study working with 80 or more SNPs, all the offspring were assigned to the true father for scenario 1 and 2. Only two of the offspring with 80 SNPs and one offspring with 100 SNPs showed a LOD < 5. The difference between the first and the second most likely father was on average higher than 10 LOD scores in the three panels with larger number of markers (≥ 80 SNPs). The maximum observed difference was around 50 LOD scores for the panels with 120 markers in both scenarios 1 and 2. Using 60 SNPs in scenario 2, for the cases where an incorrect assignment was done at 99% of probability, the LOD score difference between the two most likely fathers ranged from 0.04 to 3.98. In conclusion, using 100 SNPs and a threshold for the LOD score of 5 for the assignment of the true father and a difference between the 1st and 2nd most likely father of > 5 would correctly assign the fathers for 99.8% (507/508) of the cases. Increasing the number of SNPs to 120, would reach a rate of correct paternal identification of 100%.
18 12% of the offspring had a LOD score higher than 5 for the most likely father with 120 SNPs compared to 4.53% with 60 SNPs. This is explained by the fact that increasing the number of markers also increases the probability that the offspring share a larger number of alleles just by chance with an unrelated sire but even more with a related sire. With 120 SNPs in scenario 2, the second most likely father was assigned by CERVUS to a full sib of the true father for 69% of the offspring having a full sib relative among the putative fathers. For the smaller SNP sets this proportion dropped below 20%. Therefore, a high threshold of LOD > 5 difference between the first and second most likely father is needed to avoid false assignments to close relatives.
Number of mismatches: As a third parameter, the number of mismatches can help
to reduce the number of wrong assignments. The number of mismatches also differs remarkably between the first (true father) and the second most likely father (Table 3). But this parameter is only useful if a high quality of genotyping is achieved. For 120 SNPs, only 2.4% of the offspring-sire pairs showed mismatch (2 and 10 offspring-sire pairs presented, 2 and 1 mismatch, respectively). For the other panels that reached 100% of correct assignment the number of mismatches was even lower. However in scenario 3 using 120 SNPs, the numbers of mismatches between the assigned father and the offspring ranged from zero to six but only three offspring-sire pairs with LOD > 5 showed zero mismatches. Decreasing the number of SNPs, the number of offspring-sire pairs that presented zero mismatches increased.
19 number of false negatives depends on how strictly the parameters are applied, and that false positives can be avoided by sampling all the possible fathers. Therefore these parameters need to be adjusted based on the number of markers, number of putative fathers and the kinship of the putative sires.
Table 3. Rate of false negative and false positive assignments for the different scenarios and number of SNPs (parameters for paternal identification: LOD > 5, difference between the two most likely fathers > 5 LOD and zero or one mismatch)
Number of SNPs Scenario 11 (%) Scenario 21 (%) Scenario 32 (%)
0 mismatch
80 3.7 9.4 1.2
100 3.0 5.0 0.0
120 3.1 3.7 0.0
1 mismatch
80 1.0 8.7 3.7
100 1.6 2.8 2.4
120 1.2 1.8 1.6
1
Correct assignment classified as wrongly assigned (false negative). 2
Incorrect assignment classified as correctly assigned (false positive) because the true sire was not sampled.
The results of this study are in agreement with the results of Hill et al. (2008). They performed a simulation to determine the number of SNPs for correct assignment of the father selected from a large pool of putative fathers (including close relatives). This study concluded that using 100 – 150 SNPs with MAF > 0.30 is sufficient for assigning the true fathers even with a large number of possible fathers and relatives in the dataset. According to the same authors, if an incorrect assignment is performed - even using a large number of markers - the sire assigned would usually be a full sib.
20 SNPs. Therefore, omitting animals with lower call rates also ensures a high genotyping quality.
Practical Application
One practical situation where the assignment of sires to offspring can be useful is for determining finishing mortality. These animals are not individually tagged, but from the estimated weight at death (identify batch) and farm of birth, it should be possible to deduce the AI station and the line of the boar used. Increasing the number of putative fathers requires a larger number of markers. Therefore, to reduce the risk of assigning the wrong father, preselecting candidate fathers is very relevant.
In conclusion, this study shows that 100 SNPs with a high call rate (> 90%) are sufficient to assign the correct sire for the given data set when marker information on the dam is missing. Under these circumstances, the mean LOD score for assigning the correct sire from a total of 370 putative sires is > 5, the mean number of mismatches is ≤ 0.02, and the difference in the mean LOD score between the 1st
21 LITERATURE CITED
Ballester, M., A. Mercadé, B. van Haandel, J. Santamartina, A Sánchez. 2007. Individual identification and genetic traceability in the pig using the SNPlexTM genotyping system. Anim. Genet., 37:1-3.
Duijvesteijn, N., E.F. Knol, J.W.M. Merks, R.P.M.A. Crooijmans, M.A.M. Groenen, H. Bovenhuis, H., and B. Harlizius. 2010. A genome-wide association study on androstenone levels in pigs reveals a cluster of candidate genes on chromosome 6. BMC Genet. 11:42.
Fisher, P.J., B. Malthus, M.C. Walker, G. Corbett, and R.J. Spelman. 2009. The number of single nucleotide polymorphisms and on-farm data required for whole-herd parentage testing in dairy cattle herds. J. Dairy Sci. 92:369-374.
Goffaux, F., B. China, L. Dams, A. Clinquart, and G. Daube. 2005. Development of a genetic traceability test in pig based on single nucleotide polymorphism detection. Forensic Sci. Int. 151:239-247.
Gomez-Raya, L., K. Priest, W.M. Rauw, M. Okomo-Adhiambo, D. Thain, R. Bruce, A. Rink, R. Torell, L. Grellman, R. Narayanan, C.W. Beattie. 2008. The value of DNA paternity identification in beef cattle: examples from Nevada’s free range ranches. J. Anim. Sci. 86:17-24.
Hara, K., S. Watanabe, H. Mukai, and H. Mannen. 2010. Development of SNP markers for individual identification and parentage test in a Japanese Black cattle population. J. Anim. Sci. 81:152-157.
Hayes, B., A.K. Sonesson, and B. Gjerde. 2005. Evaluation of three strategies using DNA markers for traceability in aquaculture species. Aquac. 250:70-81.
22 Hill, W.G., B.A. Salisbury, and J.A. Webb. 2008. Parentage identification using single nucleotide polymorphism genotypes: application to product tracing. J. Anim. Sci. 86:2508-2517.
Jamieson, A., and S.C. Taylor. 1997. Comparisons of three probability formulae for parentage exclusion. Anim. Genet. 28:397–400.
Kalinowski, S.T., M.L. Taper, and T.C. Marshall. 2007. Revising how the computer program CERVUS accommodates genotyping error increases success in paternity assignment. Mol. Ecol. 16:1099-1106.
Long, T. E., R.K. Johnson, and J. W. Keele. 1990. Effects of errors in pedigree on three methods of estimating breeding value for litter size, backfat and average daily gain in swine. J. Anim. Sci. 68:4069-4078.
Marshall, T.C., J. Slate, L.E.B. Kruuk, and J.M. Pemberton. 1998. Statistical confidence for Likelihood-based paternity inference in natural populations. Mol. Ecol. 7:639-655.
Ramos, M.A., R.P.M.A. Crooijmans, N.A. Affara, A.J. Amaral, A.L. Archibald, J.E. Beever, C. Bendixen, C. Churcher, R. Clark, P. Dehais, M.S. Hansen, J. Hedegaard, Z-L. Hu, H.H. Kerstens, A.S. Law, H.-J. Megens, D. Milan, D.J. Nonneman, G.A. Rohrer, M.F. Rothschild, T.P.L. Smith, R.D. Schnabel, C.P. Van Tassell, J.F. Taylor, R.T. Wiedmann, L.B. Schook, and M.A.M. Groenen. 2009. Design of a high density SNP genotyping assay in the pig using SNPs identified and characterized by next generation sequencing technology. PLoS One 4, e6524.
Rohrer, G.A., B.A. Freking, and D. Nonneman. 2007. Single nucleotide polymorphisms for pig identification and parentage exclusion. Anim. Genet. 38:253-258.
Senneke, S.L., M.D. MacNeil, and L.D. Van Vleck. 2004. Effects of sire misidentification on estimates of genetic parameters for birth and weaning weights in Hereford cattle. J. Anim Sci. 82:2307-2312
23 Van Eenennaam, A.L., R.L. Weaber, D.J. Drake, M.C.T. Penedo, R.L. Quaas, and E.J. Pollak. 2007. DNA-based paternity analysis and genetic evaluation in a large, commercial cattle ranch setting. J. Anim. Sci. 85:3159–3169.
Visscher, P. M., J.A. Woolliams, D. Smith, and J.L. Williams. 2002. Estimation of pedigree errors in the UK dairy population using microsatellite markers and the impact on selection. J. Dairy Sci. 85:2368-2375.
APPENDIX
24 Chapter 3
25 ABSTRACT
Background: Traditional breeding programs consider a mean pairwise kinship between sibs in order to derive a relationship matrix. With this, inbreeding and kinship coefficients are commonly over or underestimated, losing power of mixed model equations and reducing the gain in genetic progress. Use of molecular markers has been pointed as a promising solution for this problem, but the number of markers needed is still not clear for practical applications. The aim of this study was to evaluate the number of informative markers needed for accurate inbreeding and kinship estimation in pigs.
Results: A total of 1,565 animals from three pig lines were genotyped for 43,945 Single Nucleotide Polymorphism (SNPs) using PorcineSNP60 Beadchip. For inbreeding and kinship, comparing traditional and genomic measurements, higher correlations were observed when only unlinked markers, instead of the full set of markers were available. Bootstrap analyses testing six reduced subsets (n=500, 1000, 1500, 2000, 2500 and 3000) showed that ≥2,000 SNPs are able to reproduce the results obtained using the full set of unlinked markers with low variation if different sets when the same number of SNPs are sampled. Genomic kinship between sire-offspring was in average close to the expected. However, analyzing the results for half and fullsibs a larger variation was observed.
Conclusions: Inbreeding and kinship coefficients in commercial pig populations may be estimated with higher accuracy using a reduced subset of ≥2,000 unlinked SNPs without the need of on-farm pedigree. The use of molecular markers showed to be robust to generate true kinship coefficients between sibs, allowing a higher accuracy in breeding values estimation.
26 BACKGROUND
In the last decades great advances have been observed on animal breeding programs. The use of the best linear unbiased prediction (BLUP) via mixed model equations (Henderson, 1975) is one of the most important tools that have allowed such progress. One of the key points of BLUP is the use of the relationship matrix (A) for breeding values estimation. However, the A matrix may suffer from accuracy losses due to: 1) pedigree errors and 2) inbreeding and relationship coefficients are, almost by definition, over or underestimated.
In order to derive A, traditional breeding programs consider that two full-sibs, from unrelated parents, show kinship coefficient equal to 0.25, what means they have 50% of all loci identical by descendent (IBD), when in the reality, for each single locus they can share zero (kinship = 0), one (kinship = 0.25) or two (kinship =0.50) IBD alleles (Visscher et al., 2006). Thus, actual coefficients may vary around the expected. Moreover, in many situations, pedigree information may be absent or incomplete, precluding the use of relatives’ information on breeding selection.
Several studies have shown that molecular markers such as highly polymorphic microsatellites and single nucleotide polymorphisms (SNPs) markers are powerful devices for verification and identification of paternity (Bolormaa et al., 2008; Hill et al., 2008; Fisher et al., 2009; Hara et al., 2010; Harlizius et al., 2011) being a feasible solution for pedigree mistakes. For more accurate estimation of inbreeding coefficients and pairwise kinship, the use of molecular markers also seems to offer good opportunities. In this case, if using a reduced number of markers it is possible to trace back all the relationships across the animals from a given population and the individual inbreeding, it is not necessary to record pedigree information, enabling reduction of costs and also avoiding errors in pedigree data in order to reach a greater genetic progress.
high-27 throughput sequencing and genotyping methods, thousands of SNP markers are now available (Santure et al., 2010) relighting the possibility of molecular inbreeding and kinship estimation.
Although the new genotyping technologies have allowed a reduction in genotyping costs, the requirement of a large number of markers is still a barrier for practical application of genomic A matrix. Thus, to establish a reduced set of markers able to estimate an accurate genomic A matrix is directly linked to the industry interest. In cattle, it was suggested that at least 2,500 SNPs, preferably unlinked, are needed to estimate relationship matrices (Rolf et al., 2010). In the same study, it was advocated that the key to genomic selection approach is to calibrate the number of markers that are scored to the extent of linkage disequilibrium (LD) present in the genome.
Presence of LD is an issue that has to be carefully considered before the use of large sets of SNPs. Increasing the number of markers shows a decrease of informativeness due LD. Linked markers give more variable estimates of relatedness and inbreeding than the unlinked markers. Therewith, it has been suggested that the best strategy is first to exclude tightly linked markers in order to get the most informative set (Santure et al., 2010).
The aim of this study was to assess the number of informative SNPs needed in a reduced set of markers to estimate accurate genomic inbreeding and pairwise kinship coefficients in commercial pig populations.
MATERIAL AND METHODS
Animals and genotyping
28 offspring and one sire). The remaining animals genotyped from this population were not directly related.
The genotyping was performed using a PorcineSNP60 Beadchip (San Diego, CA, USA, Ramos et al., 2009). More details about DNA preparation and genotyping process can be accessed in other studies (Duijvesteijn et al., 2010; Harlizius et al., 2011).
Selection of SNPs and animals
A total of 43,945 SNPs spreaded across the 18 autosome chromosomes and pre-selected based on quality control in another study (Duijvesteijn et al., 2010) was available for the current work. In order to create the subsets to be used on the genomic inbreeding estimation, non informative markers with minor allele frequency (MAF) < 0.05 and call rate < 0.95 at least in one of the three commercial lines evaluated were excluded. After exclusion of low informative SNPs, animals which presented missing genotype frequency > 0.05 were also excluded from analyses. MAF, call rate and missing genotype frequency were estimated using PLINK software (Purcell et al., 2007).
To achieve the most informative markers for each line, the linkage between SNPs was estimated and those tightly linked were excluded using LD based SNP pruning in PLINK, creating a group of linkage equilibrium markers (LE markers). With the commands established in this study the program took a window of 50 SNPs and then estimated LD between each pair of SNPs in the window. Thereafter, PLINK removed one of a pair of SNPs if the LD was greater than 0.5 and shifted the window five SNPs forward and repeated the procedure till the end of each chromosome.
29
Inbreeding and kinship estimation
Molecular inbreeding was estimated for the whole population. Kinship coefficients were estimated only for L1 animals of which the father was also typed and the paternity was confirmed by DNA analysis. Estimation of genomic inbreeding and kinship was performed using (1) all markers (after exclusion of low informative SNPs), (2) LE markers and (3) each replicate of the six subsets, using the IBS (Identical by state) function of the package GenABEL (Aulchenko and Struchalin, 2010) in R software. Calculation was weighted by the allele frequency within each line. GenAbel gives a genomic A based on average IBS where on the diagonal, homozygosity 0.5*(1+inbreeding) is provided. IBS for a pair of individuals i and j is computed as follows:
where k ranges from 1 to N = number of SNPs, xi,k is a genotype of ith individual at the kth SNP, coded as 0, 1/2, 1, corresponding to the homozygous, heterozygous, and other type of homozygous genotype and pk is the frequency of the allele coded as 1. Individuals which are more heterozygous than expected based on the allele frequency of the population show negative inbreeding coefficient indicating that they are not inbred.
Pedigree analyses
In order to compare molecular and traditional relationship estimation, the program ENDOG v4.8 (Gutiérrez & Goyache, 2005) was used to estimate coefficients based on paper pedigree. The inbreeding estimated by ENDOG is defined as the probability that an individual has two identical alleles by descent, and is computed following Meuwissen & Luo (1992). The increase in inbreeding is calculated for each generation. The number of generations evaluated in the current study ranged from 6 to 10.
30 (Kalinowski et al., 2007) was used for paternity analysis adopting all the fathers present on the paper pedigree as possible fathers. Kinship estimation based on paper pedigree (6-10 generations) was performed using ENDOG v4.8 for animals that had the paternity confirmed.
RESULTS
Dataset
31 Table 1: SNPs per chromosome. Number and proportion of SNPs from each chromosome in the set of LE markers for all lines evaluated (L1, L2 and L3).
Chr1 L1 L2 L3
# SNPs Frequency # SNPs Frequency # SNPs Frequency
1 853 0.09 786 0.10 897 0.09
2 533 0.06 467 0.06 682 0.07
3 544 0.06 405 0.05 643 0.06
4 790 0.08 540 0.07 713 0.07
5 547 0.06 452 0.06 541 0.05
6 545 0.06 493 0.06 532 0.05
7 598 0.06 504 0.06 623 0.06
8 483 0.05 386 0.05 415 0.04
9 586 0.06 474 0.06 748 0.07
10 493 0.05 416 0.05 498 0.05
11 460 0.05 402 0.05 531 0.05
12 369 0.04 318 0.04 408 0.04
13 529 0.06 439 0.05 636 0.06
14 668 0.07 539 0.07 695 0.07
15 500 0.05 434 0.05 563 0.06
16 394 0.04 337 0.04 459 0.04
17 391 0.04 378 0.05 416 0.04
18 296 0.03 214 0.03 235 0.02
Total 9,579 7,984 10,235
1
Chromosome.
Inbreeding
32 Table 2: Summary statistics of genomic and traditional inbreeding estimation. Mean, standard deviation (SD), minimum and maximum values of genomic and traditional inbreeding estimated within the three lines evaluated (L1, L2 and L3).
Pedigree1 L1 L2 L3
Mean ± SD 0.03 ± 0.02 0.04 ± 0.02 0.04 ± 0.04
Minimum 0.00 0.00 0.00
Maximum 0.15 0.27 0.29
All markers2
Mean ± SD -0.01 ± 0.05 0.09 ± 0.07 0.06 ± 0.06
Minimum -0.16 -0.13 -0.12
Maximum 0.23 0.29 0.29
LE markers3
Mean ± SD -0.01 ± 0.04 0.12 ± 0.07 0.06 ± 0.05
Minimum -0.19 -0.14 -0.13
Maximum 0.25 0.32 0.30
1
Analysis performed using information from 6-10 generations recorded on paper pedigree; 2Analysis performed using all remaining markers after cleaning of low informative SNPs (n = 28,740); 3Analysis performed using only markers in linkage equilibrium (LE) within each line (9579, 7984 and 10235 LE markers for L1, L2 and L3, respectively).
33 Table 3: Correlation between genomic and traditional inbreeding within the three lines evaluated (L1, L2 and L3).
L1 Pedigree1 All markers2 LE markers3
Pedigree 1 0.30 0.42
All markers 0.34 1 0.84
LE markers 0.47 0.83 1
L2 Pedigree All markers LE markers
Pedigree 1 0.27 0.28
All markers 0.31 1 0.89
LE markers 0.35 0.85 1
L3 Pedigree All markers LE markers
Pedigree 1 0.27 0.35
All markers 0.35 1 0.92
LE markers 0.43 0.90 1
Bellow diagonal the negative values for genomic inbreeding were set to zero. Above diagonal the original results were used. 1Analysis performed using information from 6-10 generations recorded on paper pedigree; 2Analysis performed using all remaining markers after cleaning of low informative SNPs (n = 28,740); 3Analysis performed using only markers in linkage equilibrium (LE) within each line (9579, 7984 and 10235 LE markers for L1, L2 and L3, respectively).
34 Figure 1: Bootstrap analysis for inbreeding. Box plot of correlation between the inbreeding estimation using each replicate (n=1,000) of the subsets and the LE markers. Median is given in bold.
Kinship
L1 population consisted of 645 animals with missing genotype frequency < 0.05 and their fathers (n=42) also genotyped. Such animals were submitted to paternity verification. For all animals the sire indicated on the paper pedigree was confirmed as the true sire. LOD scores between the pair sire-offspring were on average equal to 16. The mean difference between the 1st and the 2nd most likely sire assigned by CERVUS was 28 LOD scores. No mismatches were detected comparing the genotypes of the sire and the offspring. Once no mistakes with respect to sire were indicated on pedigree, all families typed were included on genomic and traditional kinship estimation.
Pairwise kinship between sire and offspring estimated using LE and all markers were quite similar (correlation = 0.83). The mean genomic kinship estimated was equal to 0.23±0.02 using both sets within a range from 0.18 to 0.30 for LE markers and from 0.17 to 0.31 for all markers. Using traditional methodology the mean kinship estimated between sire and offspring was 0.26±0.01, ranging from 0.26 to 0.33. As observed for inbreeding estimation, the correlation between traditional and genomic kinship was higher when unlinked markers were used (0.42 using LE markers against 0.36 using all markers).
35 0.90. Mean genomic kinship was equal to 0.12±0.03 showing a range of 0.02 to 0.28 (LE markers) and 0.30 (all markers) for halfsibs pair. When fullsibs kinship were evaluated the mean genomic kinship was equal to 0.24±0.04 ranging from 0.08 to 0.34 (LE markers) and 0.37 (all markers). One outlier in the pairwise kinship value was observed, which was equal to 0.47 using LE and all markers.
For estimation of halfsibs traditional kinship, a mean value equal to 0.15±0.01 was observed, being the lowest value equal to 0.14 and the highest equal to 0.24. For fullsibs, kinship based on pedigree information presented mean of 0.27±0.01 ranging from 0.26 to 0.34. Correlations between traditional and genomic kinship were also higher using LE markers, being 0.34 for halfsibs and 0.15 for fullsibs. When all markers were used correlations were 0.29 and 0.14 for half and fullsibs, respectively.
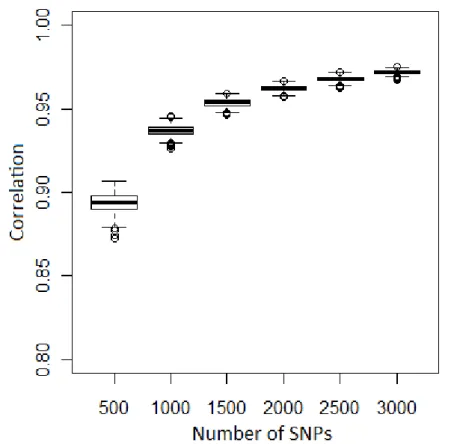
Correlations between pairwise kinship estimated using each one of the 1,000 replicates of the six subsets (n = 500, 1000, 1500, 2000, 2500 and 3000) and the results using the complete set of LE markers in each line are shown in Figure 2. All replicates showed correlation > 0.85 with the LE markers and a higher variation was observed for the subset composed for 500 markers.
36 DISCUSSION
In order to achieve the aim of this study six reduced subsets of SNPs were evaluated for inbreeding and kinship coefficients estimation. In the current study it was proposed that selection of SNPs to be included in each subset should be weighted by the proportion of SNPs in each chromosome in relation to the total number of LE markers. Sampling the whole genome more accurate genomic coefficients can be estimated. If SNPs are sampled randomly, the reduced subsets may have an uneven balanced number of markers selected for the chromosomes. However, if a weighted selection is done, larger chromosomes with a larger proportion of markers available will have more SNPs sampled, giving a fairer genome sampling.
The three lines evaluated showed a different number of SNPs in the set of LE markers. Although the number of remaining markers per chromosome had varied across genetic lines, the proportion of markers in relation to the total of LE markers did not change remarkably (Table 1). Therefore, for practical application, such results give an opportunity of using a mean probability (weight) to sample markers for a reduced subset for all lines simultaneously.
Genomic inbreeding and kinship achieved higher correlations with traditional measurements when unlinked markers were used. These results are in agreement with other studies which have advocated that increasing the number of markers may not result in any appreciable increase in information (Santure et al., 2010) and that the genomic relationship matrix has to be estimated ideally with unlinked markers (Rolf et al., 2010). Another study (Weir et al., 2006) considers that the large number of SNPs is partly illusory due the fact that an increased marker density implies increased dependencies (linkage equilibrium). Therefore, it is possible to conclude that genomic pairwise kinship and individual inbreeding are estimated with higher accuracy using unlinked markers than when all markers available are used.
37 genomic relationship estimation. It is suitable to try to form a concise panel of markers to achieve all genomic goals in order to make the use of molecular information feasible to the industry.
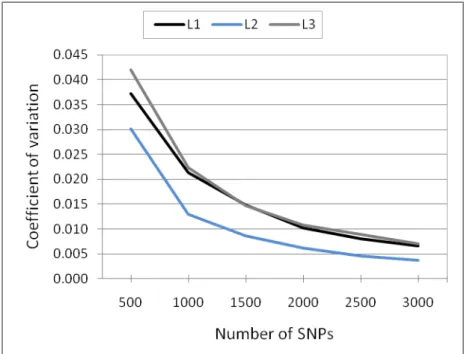
According to Rolf et al. (2010) the greatest benefits of using molecular information will only be realized with the development of inexpensive assays which query ≥ 2,500 SNPs. As showed previously, increasing the number of markers to more than 2,000 did not increase the mean correlation substantially across the subsets and the full set of LE markers (Figure 1). Comparing the coefficients of variation (CV) across the correlation of each replicate of the six subsets and the full set of LE markers, it was observed that using 2,000 or more SNPs the CV was ≤ 0.01 for all lines (Figure 3). The absence of large variation across replicates means that it does not matter which unlinked markers were sampled. Therefore, the breeding companies have the opportunity of taking all markers used for candidate genes or QTL and paternity analyses, since they are unlinked, to estimate genomic relationships.
Figure 3: Coefficient of variation between replicates (n=1,000) of each subset.
38 lines. The three evaluated lines shared 1,046 SNPs in the set of LE markers due random exclusion of linked markers performed by PLINK. With a higher control over selection of unlinked markers it is possible to increase the set of shared SNPs, making it possible to establish a common set of unlinked markers for inbreeding estimation. This must be the next step in the development of the methodology.
In a recent study (VanRaden, 2008) using simulated genotypes for two real cattle populations and estimating genomic inbreeding based on allele frequency of the genotyped animals studied, negative correlations between genomic and traditional inbreeding for one population (-0.26 for young animals and -0.28 for animals born before 2000) were observed. For the second one, correlations were 0.12 for young animals and 0.40 when coefficients for older animals were estimated. In the current study, molecular inbreeding estimation was robust and no negative correlation between genomic and traditional estimates was observed (Table 3). The mean correlation for the three lines was 0.35 using original results and 0.42 setting negative inbreeding values to zero. Negative inbreeding coefficients mean that the animal is more heterozygous than expected, e.g. no inbreeding.
Allele frequencies in the base population represent another important issue which has to be considered for more accurate genomic inbreeding estimation. Study using simulated genotypes (VanRaden, 2008) showed that higher correlation between genomic and traditional inbreeding is expected when allele frequency in base population is known instead of simple frequencies estimated by counting alleles in genotyped population. However, the modern livestock lines and breeds were generated decades ago and genetic material from the founders is not available for genotyping and further evaluation of allele frequency. Several pedigree reconstruction programs (Butler et., 2004) have been created to shortcut the estimation of the allele frequency in the base population, but if small sibships are available or sampling is incomplete, the power of reconstructing pedigree is limited (Wang et al., 2004). Moreover, programs normally used to carry out pedigree reconstruction assume that molecular data are error free (Fernandez et al., 2006), what is not real, reducing accuracy of predictions. The number of fullsibs per family in this study ranged from 2 to 5 with an average of 2.57. Therefore, inbreeding estimation performed using simple frequencies in the evaluated population is a valuable tool, mainly if there is no information about the founders.
39 investigated due to absence of dams genotypes. Moreover, it is necessary to keep in mind that traditional kinship was estimated based on information that ranged from 6 to 10 generations and even in careful systems mistakes can occur at information recording or introducing it in the database, among others, generating pedigree mistakes. If on-farm pedigree is not correct the correlation between traditional and genomic kinship will be affected.
Expected kinship coefficient based on pedigree information for the pair sire-offspring is at least 0.25 (mating unrelated sire and dam) whereas the sire-offspring inherits 50% of the genetic information from the sire. In the current work, the mean genomic pairwise kinship for sire-offspring was 0.23±0.02. It is important highlight that expected traditional kinship is based on IBD and the genomic kinship here estimated is based on IBS. Such difficulty to separate IBD from IBS alleles means that even a perfect relatedness estimator is unlikely to correlate exactly with pedigree relatedness coefficients (Santure et al., 2010). IBS alleles are known as crucial for relatedness estimation, however, it is an unobservable quantity, while what can be observed is the allele state (IBS), alleles that seem to be the same (Weir et al., 2006).
For fullsibs, the same traditional kinship coefficients between sire-offspring when unrelated parents are crossed are expected. However, a large range in the genomic estimative of kinship was observed (Figure 3). These results fit to our expectations due the fact that fullsibs can share zero, one or two IBD alleles for each locus. If two fullsibs share two IBD alleles for all loci, the pairwise kinship will be 0.50. But, if they share zero IBD alleles the kinship will be zero. Of course the extremes cases are unlikely, but a variation around the average is perfectly expected. The increased differentiation across sibs is the key point of using molecular information, as it allows a reduction on coselection of sibs, which reduces inbreeding rates per generation (Daetwyler et al., 2007).
For kinship estimation, contrary to what was observed for inbreeding estimation, the subset with the smaller number of markers was able to reproduce the results obtained using all LE markers with high efficiency (correlation > 0.85). Moreover, the variation across the results of each replicate was smaller (Figure 2). However, subsets < 2,000 SNPs are not feasible for practical applications, since inbreeding coefficients would not be estimated accurately.
40 pairwise kinship close to 0.50 is also observed. This observation is probably an indicative of an identical twin or of a duplicated sample in the dataset, once that such high kinship means that both animals show the same alleles for almost all markers sampled.
Figure 4: Traditional against genomic kinship. Plot of kinship estimation using information from 6-10 generations (on-farm pedigree) against genomic kinship estimation using the full set of LE markers.
In order to perform a final examination of the relationship matrix estimated using molecular markers, it is necessary to evaluate the power of the approach in practical application of breeding values estimation.
CONCLUSIONS
41 relationship matrix estimated using unlinked markers needs to be tested in breeding values estimation environment in order to validate the efficiency of the methodology.
REFERENCES
Aulchenko Y, Struchalin M: GenABEL: genome-wide SNP association analysis. R package version 1.6-4. 2010 [http://CRAN.R-project.org/package=GenABEL].
Boldman KG, Kriese LA, Van Vleck LD, Van Tassell CP, Kachman SD: A manual for use of MTDFREML. A set of programs to obtain estimates of variance and covariance. USDA, Agriculture Research Service, Clay Center, NE, 1995.
Bolormaa S, Ruvinsky A, Walkden-Brown S, Van DerWerf J: DNA-based parentage verification in two Australian goat herds. Small Ruminant Research 2008, 80:95-100.
Butler K, Field C, Herbinger CM, Smith BR: Accuracy, efficiency and robustness of
four algorithms allowing full sibship reconstruction from DNA marker data.
Mol Ecol 2004, 13:1589–1600.
Daetwyler HD, Villanueva B, Bijma P, Woolliams JA: Inbreeding in genome-wide selection. J Anim Breed Genet 2007, 124:369-376.
Duijvesteijn N, Knol EF, Merks JWM, Crooijmans RPMA, Groenen MAM, Bovenhuis H, Harlizius B: A genome-wide association study on androstenone levels in pigs reveals a cluster of candidate genes on chromosome 6. BMC Genet 2010, 11:42.
FERNÁNDEZ J, TORO MA: A new method to estimate relatedness from molecular
markers. Mol Ecol 2006, 15:1657–1667.
Fisher PJ, Malthus B, Walker MC, Corbett G, Spelman RJ: The number of single nucleotide polymorphisms and on-farm data required for whole-herd parentage testing in dairy cattle herds. J Dairy Sci 2009, 92:369-374.
Garant D, Kruuk LEB: How to use molecular marker data to measure evolutionary
42 Gutiérrez JP, Goyache F: A note on ENDOG: a computer program for analysing
pedigree information. J Anim Breed Genet 2005, 122:172-176.
Hara K, Watanabe S, Mukai H, Mannen H: Development of SNP markers for individual identification and parentage test in a Japanese Black cattle population. J Anim Sci 2010, 81:152-157.
Hardy O J, Vekemans X: SPAGeDi: a versatile computer program to analyse spatial genetic structure at the individual or population levels. Mol Ecol Notes 2002, 2:618-620.
Harlizius B, Lopes MS, Duijvesteijn N, van de Goor LHP, van Haeringen WA, Panneman H, Guimarães SEF, Merks JWM, Knol EF: A SNP set for paternal identification to reduce the costs of trait recording in commercial pig breeding. J Anim Sci 2011, in press.
Henderson CR: Best Linear Unbiased Estimation and Prediction under a selection model. Biometrics 1975, 31:423-447.
Hill WG, Salisbury BA, Webb JA: Parentage identification using single nucleotide polymorphism genotypes: application to product tracing. J Anim Sci 2008, 86:2508-2517.
Kalinowski ST, Taper ML, Marshall TC: Revising how the computer program CERVUS accommodates genotyping error increases success in paternity assignment. Mol Ecol 2007, 16:1099-1106.
Li CC, Horvitz DG: Some methods of estimating the inbreeding coefficient. American J Hum Genet 1953, 5:107–117.
Lynch M, Ritland K: Estimation of pairwise relatedness with molecular markers. Genet 1999, 152:1753–1766.
Meuwissen TI, Luo Z: Computing inbreeding coefficients in large populations. Genet Sel Evol 24:305-313.