Identification of Laying-Related SNP Markers
in Geese Using RAD Sequencing
ShiGang Yu1, WeiWei Chu1, LiFan Zhang1, HouMing Han2, RongXue Zhao2, Wei Wu2, JiangNing Zhu2, Michael V. Dodson3, Wei Wei1, HongLin Liu1, Jie Chen1*
1College of Animal Science and Technology, Nanjing Agricultural University, Nanjing, People’s Republic of China,2Jiangsu Lihua Animal Husbandry CO., LTD, Changzhou, People’s Republic of China,
3Department of Animal Sciences, Washington State University, Pullman, Washington, 99164, United States of America
Abstract
Laying performance is an important economical trait of goose production. As laying perfor-mance is of low heritability, it is of significance to develop a marker-assisted selection (MAS) strategy for this trait. Definition of sequence variation related to the target trait is a prerequisite of quantitating MAS, but little is presently known about the goose genome, which greatly hinders the identification of genetic markers for the laying traits of geese. Recently developed restriction site-associated DNA (RAD) sequencing is a possible approach for discerning large-scale single nucleotide polymorphism (SNP) and reducing the complexity of a genome without having reference genomic information available. In the present study, we developed a pooled RAD sequencing strategy for detecting geese laying-related SNP. Two DNA pools were constructed, each consisting of equal amounts of geno-mic DNA from 10 individuals with either high estimated breeding value (HEBV) or low esti-mated breeding value (LEBV). A total of 139,013 SNP were obtained from 42,291,356 sequences, of which 18,771,943 were for LEBV and 23,519,413 were for HEBV cohorts. Fifty-five SNP which had different allelic frequencies in the two DNA pools were further vali-dated by individual-based AS-PCR genotyping in the LEBV and HEBV cohorts. Ten out of 55 SNP exhibited distinct allele distributions in these two cohorts. These 10 SNP were fur-ther genotyped in a goose population of 492 geese to verify the association with egg num-bers. The result showed that 8 of 10 SNP were associated with egg numnum-bers. Additionally, liner regression analysis revealed that SNP Record-111407, 106975 and 112359 were involved in a multiplegene network affecting laying performance. We used IPCR to extend the unknown regions flanking the candidate RAD tags. The obtained sequences were sub-jected to BLAST to retrieve the orthologous genes in either ducks or chickens. Five novel genes were cloned for geese which harbored the candidate laying-related SNP, including membrane associated guanylate kinase(MAGI-1),KIAA1462,Rho GTPase activating pro-tein 21(ARHGAP21),acyl-CoA synthetase family member 2(ACSF2),astrotactin 2
(ASTN2). Collectively, our data suggests that 8 SNP and 5 genes might be promising candi-date markers or targets for marker-assisted selection of egg numbers in geese.
OPEN ACCESS
Citation:Yu S, Chu W, Zhang L, Han H, Zhao R, Wu W, et al. (2015) Identification of Laying-Related SNP Markers in Geese Using RAD Sequencing. PLoS ONE 10(7): e0131572. doi:10.1371/journal. pone.0131572
Editor:Gen Hua Yue, Temasek Life Sciences Laboratory, SINGAPORE
Received:February 14, 2015
Accepted:June 3, 2015
Published:July 16, 2015
Copyright:This is an open access article, free of all copyright, and may be freely reproduced, distributed, transmitted, modified, built upon, or otherwise used by anyone for any lawful purpose. The work is made available under theCreative Commons CC0public domain dedication.
Data Availability Statement:The sequences of 5 laying-related genes are available from the NCBI database (accession number(s) KP271033, KP271035, KP271036, KP271032 and KP271034). These newly identified SNP are available from the NCBI database (accession number(s) 1714766361, 1714766362, 1714766363, 1714766364, 1714766365, 1714766367, 1714766368 and 1714766370).
Introduction
Geese possess strong/variable broodiness and poor egging performances, which are impacted by many factors, such as genetics, nutrition, environment and disease. Asthe heritability of reproduction is low,it is hard to improve reproductive traits using traditional selection meth-ods. Marker-assisted selection (MAS) is an effective way to improve such traits with low herita-bilities. However, mining trait-linked sequence variationor functional genesis needed for developing MAS strategies. Single nucleotide polymorphism(SNP) is the most abundant type of genetic marker, and itshigh genetic stability makes itideal for studying the inheritance of genomic regions [1,2]. However, there is yet no genome sequence data available for geese, which largelyhinders the research of any economical traits at the molecular levelin this species.
The candidate gene approach is a common method for identifying genetic markers linked to important economical traits. Chen et al (2012) found more than 30 SNPs inProlactin(PRL) intron 2, and 5 SNPs inProlactin Receptor(PRLR) exon 10 inWanjiangwhite geese. These polymorphisms were significantly related to the egg productivity [3]. Zhao et al (2011) found two SNPs respectively onGonadotropin-releasing Hormone(GnRH) andPRLwere associated with reproduction traits inWulonggeese [4].Zhang et al (2013) demonstrated the gene expres-sion ofLuteinizing Hormone(LH),PRLand their receptors at different stages inZigeese [5], and Ding et al (2006) identified many differentially expressed genes in livers of laying geese compared with prelaying geese using suppression subtractive hybridization (SSH). These genes includedVitellogenin I,apoVLDL-II,ethanolamine kinase,G-protein gamma-5 subunit, and leucyl-tRNA synthase[6]. Recently, Guo et al (2011) used a similar approach to find several dif-ferentially expressed genes between the laying and broodiness stages, includingPRLR,estrogen receptor 1andanti-mullerian hormone receptor II[7].
Next-generation high-throughput DNA sequencing techniques have accelerated theresearch speed of animal genomic research. This techniques has been widely used in whole-genome sequencing, target resequencing, and transcriptome sequencing[8]. Most recently, Xu et al (2013) identified 572 differentially expressed genes with 294 up-regulated and 278 down-regu-lated genes in the ovarian tissue library of laying geese and broodiness geese byde novo tran-scriptome assembly using short-read sequencing technology (Illumina) [9]. Unfortunately, the resultant transcriptome provided only limited restriction site information from coding regions, where nucleotide diversity is much lower compared to non-coding regions.
Restriction-site associated DNA (RAD) sequencing, a newly developed method for rapid and large-scale SNP discovery, can effectively reduce the complexity of the genome[10]. It has becomean economical and efficient method for SNP discovery and genotyping [11,12]. It allows smaller research groups, or groups studying organisms that do not yet possess a refer-ence genome, to conduct“genome wide studies”[13]. The RAD sequencing approach has been successfully applied in a number of organisms, including guppy [14], salmon [15], eurasian beaver [16], cutthroat and rainbow trout [17], Sturgeon [18], and rapeseed [10].
In this study, we applied pool-based RAD sequencing to discover novel SNP across the goose genome. Candidate SNP for laying performance were selected by comparing allelic fre-quencies between the two DNA pools with lowest estimated breeding value (LEBV) and high-est high-estimated breeding value (HEBV). Using an allele-specific PCR (AS-PCR) assay for individual-based genotyping, the candidate SNP-traitassociation pattern was first confirmed in LEBV and HEBV cohorts, and further verified in the population of 492 geese. Novel genes har-boring laying-related SNP were cloned for geese.
(JASTIF, CX(14)2071) and the Fundamental Research Funds for the Central Universities (No. KYZ201414). The funders had no role in study design, data collection and analysis, decision to publish, or preparation of the manuscript. Jiangsu Lihua Animal Husbandry CO. LTD provided the individual samples and egg performance data.
Materials and Methods
Ethics Statement
All experiments were reviewed and approved by Nanjing Agricultural University Animal Care and Use Committee and performed in accordance with the Regulations for the Administration of Affairs Concerning Experimental Animals (China, 1988). All efforts were made to minimize any discomfort during blood collection.
Animals and Sample Preparation
A total of 492 femaleYangzhougeese from the breeding farm of Jiangsu Lihua Animal Hus-bandry CO., LTD were employed in this study. During the experiments, geese were fed ad libi-tum with rice grain supplemented with green grass or water plants whenever possible. The feed was offered during daytime when the geese were released to an open area outside the house. The geese were exposed to natural lighting and temperature throughout this study. The laying geese were kept in separate cages in order to record the total number of eggs during the whole egg-laying period. Blood samples were collected from wing vein using sodium heparin contain-ing vacutainers.
Laying Performance and Grouping
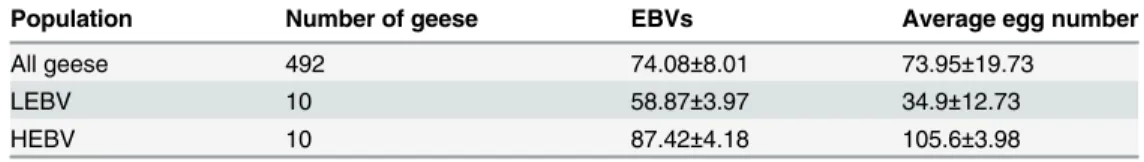
The total egg number of all individuals was recorded daily throughout the egg-laying periodof 34 weeks. The average egg numbers of the experimental population aresummarized inTable 1. Individual estimated breeding values (EBV) of egg numberwas calculated using the informa-tion of full sib and half sib. Ten individuals of lowest or highest EBV were selected from the total 492geese and designated LEBV and HEBV groups, respectively.
RAD Library Preparation and Sequencing
Genomic DNA was extracted from blood using the whole blood DNA kit (Omega Bio-Tek, Doraville, USA) following the manufacturer’s instructions. DNA concentration was assessed for each individual sample using the Thermo Scientific NANODROP2000 spectrophotometer (Thermo Fisher Scientific Inc. USA). All DNA samples were adjusted to a final concentration of 100ng/ul. Both A260/280 and A260/230 ratios were in the standard range. Two DNA pools for LEBV and HEBV were prepared by mixing equal amount of genomic DNA from each 10 individuals. The restriction enzyme EcoRI was used to digest the genomic DNA. A total of 2 multiplexed sequencing libraries were constructed, in which each DNA sample was assigned a unique nucleotide multiplex identifier (MID) for bar-coding. Single-end (101-bp) sequencing was performed using Illumina HiSeq2000.
Sequence Analysis and Laying-Related Mutations Detection
Raw sequence reads were trimmed to 90 nucleotides from the 3’end, which ensured more than 97.5% of the nucleotides have a quality value above Q30 (equals 0.1% sequencing error). The
Table 1. Egg numbers of the experimental population in 34-weekegg-laying period.
Population Number of geese EBVs Average egg number
All geese 492 74.08±8.01 73.95±19.73
LEBV 10 58.87±3.97 34.9±12.73
HEBV 10 87.42±4.18 105.6±3.98
trimmed reads were clustered into read tags (hereafter RAD-tags) by sequence similarity using USTACKS [19] to produce unique candidate alleles for each RAD locus. A maximum base-pair mismatch of two was allowed in this step for the natural populations. RAD-tags were then collapsed into clusters using USTACKS under default parameters for SNP calling. For each SNP, the differences of allele frequencies were compared between LEBV and HEBV pools. Those SNP with significantly different allelic distributions between the two pools were chose as candidate loci for the further verification in the population.
Verification of Laying-Related Mutations in Goose Population
A total of 55 SNP were selected for further individual-based genotyping in the LEBV and HEBV cohorts. The SNP having different allelic distribution between LEBV and HEBV cohorts were verified in the population of 492 geese. AS-PCR was used for genotyping in the popula-tion. In order to improve the specificity of PCR amplification and reliable discrimination between the alleles, an additional mismatch base pair was introduced at the third base from 3’ end. The primers of AS-PCR were designed according with the methods of Liu[20]and Hayashi [21] by Primer Premier 5 software (PREMIER Biosoft, Palo Alto, CA, USA).
The primers and PCR production length are showed inS1 Table. Genotyping with two spe-cific primers was performed duplicated in 20μL reactions containing approximately 50 ng
tem-plate DNA, 5μl 2X PCR Taq enzyme (abm, Canada), 1μl of specific and common primer
(10μmol) (BGI, ShenZhen, China). Amplification conditions were as following:
predenatura-tion at 94°C for 3 min, 32 cycles of amplificapredenatura-tion (94°C for 30s, 45°C-72°C for 30s and 72°C for 30s) and a final extension at 72°C for 5 min. PCR products were separated on 3.0% agarose gel by electrophoresis.
Cloning Novel Genes Based on Egg Laying-Related SNP
Functional genes harboring verified laying-related SNP were further cloned for geese using inverse PCR (IPCR) coupled with comparative sequencing. IPCR is a method for amplifying unknown sequences (adjoining known sequences) by primers designed on the known sequence in opposite orientation using self-ligated circular DNAs as PCR templates. All primers were designed base on the sequence of RAD tags. The primers used in this work are listed inS2 Table. Five microgram of genomic DNA was digested in a 200ul total volume using Kpn I, Hind III, Sac I and Noc I (All the enzymes from NEB, Beijing, China) at 37°C for 6 hr to achieve complete digestion. The digested sample was then treated with an equal volume of Phe-nol: chloroform: isoamylalcohol (25:24:1) mixture, the aqueous phase was removed, and the DNA was precipitated with ethanol and collected by centrifugation. The digested DNA was self-ligated at a concentration of 0.5–1.0 ug/ml in the presence of 1600U/ml T4 DNA ligase (NEB, Beijing, China) overnight at 16°C. The ligation mixture was extracted by Phenol: chloro-form: isoamylalcohol (25:24:1), precipitated with ethanol, and resuspended in sterile distilled water to a concentration of 50 ng/ul.
Nest PCR was applied for amplifing unknown sequence flanking the RAD-tag. Nest PCR was performed in a volume of 50 ml with 50 ng prepared DNA, 2μl of each of primer
(10μmol) (BGI, ShenZhen, China) and 25ul LA Taq enzyme (Takara, DaLian, China).
Boric acid/EDTA (TBE) agarose gel. PCR bands were excised under UV light and purified using the gel extraction kit (Omega Bio-Tek, Doraville, USA) as recommended by the supplier. The purified DNA fragments were directly ligated into a phagemid TA vector (Peasy-T3 plas-mid) using the TA cloning kit (TransGen Biotech, BeiJing, China) according to the manufac-turer’s protocol, and then transformed to the competent cells (TransGen Biotech).
Transformants were plated on LB agar containing 50 mg/ml ampicillin. Colonies were selected and sampled, suspended in 1 ml of LB medium in the 2.0 Eppendorf tube and grown at 37°C for 16 hr. The target DNA was sequenced (GENEWIZ, Suzhou, China). Multiple sequence alignments were performed using DNAman software package(Version 8.0; Lynnon Bio-Soft, Quebec, Canada). Database searches were performed using BlastX (http://www.ncbi.nlm.nih. gov/BLAST).
Statistics and Data Analysis
The chi square test of independence was used to test the difference of allelic frequencies of RAD-tags between LEBV and HEBV DNA pools. For the discovery of laying-related SNP, the Bonferroni correction was used toestimate the significance thresholdat the 5% overall Type I error rate[22],αBonis given by
a
Bon ¼
a
ninformative
WhereαBonis the Bonferroni-adjusted P value,αis the uncorrected P value,ninformativeis the
number of SNP.
Fisher’s exact test was executed in the statistical language R version 2.11.1[23]to compare the allelic frequencies between LEBV and HEBV cohorts.
The laying estimate breeding value (EBV) of individual was calculated as:
^
A¼XbiPi¼b0P
WhereA^is the EBV.biis the phenotypic information of the ithrelatives, including phenotypic
performance of individual, full sibs and half sibs.biis the partial regression coefficient ofPi.b0
is the vector of partial regression coefficient.Pis the vector of phenotypic value.
Genotype frequencies, allelic frequencies, gene diversity, heterozygosity, polymorphism information content (PIC) and chi-square tests of goodness-of-fit for Hardy-Weinberg equilib-rium law were calculated using PowerMarker V3.25[24]. All data were expressed as the mean ± SD.
One-Way ANOVA (SPSS for Windows, version 20.0; IBM-SPSS, Chicago, IL) was used to compare average egg numbers of the different genotypes. The means were assessed for signifi-cance by Duncan’s multiple range tests (SPSS for Windows, version 20.0). All single SNP-trait associations that reached a significance level ofp<0.05were included in further
multiple-marker analysis. Multiple-multiple-marker associations were analyzed along with two quantitative trait modes (additive mode: PAa(PAA+ Paa)/2) and dominant mode: PAaeither PAAor Paa) by the linear regression procedure (SPSS for Windows, version 20.0)[25].
Results
RAD Sequencing
884,827 and 942,117 for LEBV and HEBV respectively. The sequencing depth per group is 17.33× and 20.47× respectively, with average sequencing depth of 18.9×. After the filtering steps, a total of 139,013 SNP were detected. Only the SNP distributed from position 6 to 90 were chose for further analysis, since the polymorphisms beyond this region were more sub-jected to common sequencing errors. Of all SNP, 338 were triallelic. The remaining 138,675 SNP were biallelic and consisted of 52.97% transitions and 47.03% transversions, providing a transition/transversion (ts/tv) ratio of 1.10. The number of A/G substitution (38,549)almost equaled the number of C/T substitution (34,226) in the transitions class, while G/T (31,622) transversions exceeded A/C (12,384), A/T (13,078) and C/G (8,816) transversions.
Discovery of Laying-Related SNPs
The differences of allelic frequencies betweenLEBVandHEBV pools were analyzed by chi-square tests for all 138,675 SNP of RAD sequencing. After Bonferroni adjustment, 467 SNP were significant (p<3.69×10⁻⁷). Individual-based genotyping were performed for all LEBV and
HEBV geese by allele specific-PCR. Totally, 55 SNP could be stably genotyped by this method (S1 Table). The results of further individual-based genotyping showed that 10 out of 55 SNP had significant (p<0.00024–4.19×10⁻⁸) different allelic frequencies in the LEBV and HEBV
cohorts (Table 3).
Table 2. Restriction-site associated DNA (RAD) sequencing statistics of EcoRI library from two DNA pools.
Sample Clean Data Clean Reads Number RAD-tag number Average Depth
LEBV 1,727.02Mb 18,771,943 884,827 17.33
HEBV 2,163.79Mb 23,519,413 942,117 20.47
doi:10.1371/journal.pone.0131572.t002
Table 3. Allelic frequencies distribution between LEBV and HEBV cohorts.
SNP primer genotype HEBV (Allele frequencies) LEBV (Allele frequencies) P value
Record-106975 AATTCTTGCCTAAATAAC(A/G) G/A 0.10/0.90 1.0/0 4.19×10
−8
ACACATTGATGCTGCAAATT
Record-134172 GCTGACAGCTCATTTGAT(A/T) A/T 1.0/0 0.30/0.70 3.34×10
−6
CAGGATCACGTCCTCAAC
Record-112359 GAAGCGCCTGGTGGCCTCACC(T/G) T/G 0/1.0 0.80/0.20 7.71×10
−7
TACCTGCCTGAGAGATGGAGTGTTGG
Record-106582 TTCAGGGAACTCAAACTATA(C/A) C/A 0.20/0.80 0.90 /0.10 1.66×10
−5
CTCACGTGGCCTCTACAA
Record-111407 TTTTGGCCGTGGTTTCC(T/A) T/A 0.40/0.60 1.0/0 4.51×10
−5
ATCAGACCCGTGGTGGAAC
Record-135849 CTGTGTTGATATTTTCTGATAGTA T/C 0.70/0.30 0.10/0.90 2.44×10
−4
TGTTTAGCAGGAGCACAA(T/C)
Record-88247 AGAGAATTTAGTCATATTTGGGT G/A 0.21/0.79 0.85/0.15 2.20×10
−5
TAATTTGGACTCAATCAAAA(C/T)
Record-135057 CAGGGGGATTCTAGTAGTTTCCT G/A 0.14/0.86 0.80/0.20 6.34×10
−6
TCACTGCTGCAGACACGCA(T/C)
Record-130652 AGTTACATTTAAAAGTGTCTGGTC G/A 0.75/0.25 0.05/0.95 1.02×10
−6
CGATCAAAACAAATGGTAGAC(C/T)
Record-130775 CAGGGGGATTCTAGTAGTTTCCT A/G 0.96/0.04 0.10/0.90 4.63×10
−10
TCACTGCTGCAGACACGCA(T/C)
Verification of Laying-Related SNP in the Experimental Goose
Population
The 10 SNP were subjected to genotyping in the population of 492 geese by AS-PCR (Fig 1). Genetic diversity was analyzed by software Powermarker V3.25 for each SNP. As shown in
Table 4, the gene diversity (He), heterozygosity (H0), and polymorphism information content (PIC) of the 10 SNP ranged 0.4394–0.4991, 0.0830–0.5233 and 0.3161–0.3746 respectively. The SNP Record-135849 had the highest gene diversity, heterozygosity and PIC. PIC commonly Fig 1. Genotyping of the 10 SNP by allele specific PCR in geese.Electropherosis of AS-PCR revealed different genotypes of 10 SNPs. Eight individuals were randomly selected to show three genotypes of each SNP.
doi:10.1371/journal.pone.0131572.g001
Table 4. SNP Identification and Genotyping by allele specific PCR: genotype and allele frequencies, polymorphism information content, and chi-square tests of goodness-of-fit for Hardy-Weinberg equilibrium in the experimental population.
SNP Sample size Genotype frequencies (%) Allele
frequencies(%)
He H0 P valve (χ2,HWE) PIC
Record-106975 449 GG25.4 GA30.1 AA44.5 G40.4 A59.6 0.4817 0.3007 0.0000* 0.3657
Record-134172 332 AA46.7 AT33.7 TT19.6 A63.6 T36.4 0.4633 0.3373 0.0000* 0.3560
Record-112359 330 TT35.4 TG39.7 GG24.9 T55.3 G44.7 0.4944 0.3970 0.0001* 0.3722
Record-106582 472 CC32.6 CA42.6 AA24.8 C53.9 A46.1 0.4969 0.4258 0.0018* 0.3735
Record-111407 457 TT43.5 TA38.7 AA17.8 T62.9 A37.1 0.4669 0.3868 0.0002* 0.3579
Record-135849 193 TT21.8 TC52.3 CC25.9 T47.9 C52.1 0.4991 0.5233 0.5544 0.3746
Record-88247 260 GG53.9 GA38.4 AA7.70 G73.1 A26.9 0.3935 0.3846 0.6344 0.3161
Record-135057 341 GG47.5 GA41.6 AA10.9 G68.3 A31.7 0.4328 0.4164 0.5060 0.3391
Record-130652 342 GG12.6 GA32.2 AA55.2 G28.7 A71.4 0.4089 0.3216 0.0002* 0.3253
Record-130775 446 AA53.4 AG8.30 GG38.3 A57.5 G42.5 0.4887 0.0830 0.0000* 0.3693
Note: PIC means polymorphism information content.
*means significance at thep<0.01 level.
used as a measure of polymorphism in genetics for a molecular marker. In the present study, the PIC values of 10 SNPs range from 0.25–0.5, indicates that these SNPs display intermediate levels of polymorphism.Seven SNP showed significant deviations from Hardy-Weinberg equi-librium (HWE) (p<0.05), while the other three SNP, including Record-135849, Record-88247
and Record-135057, were in HWE (p>0.05).
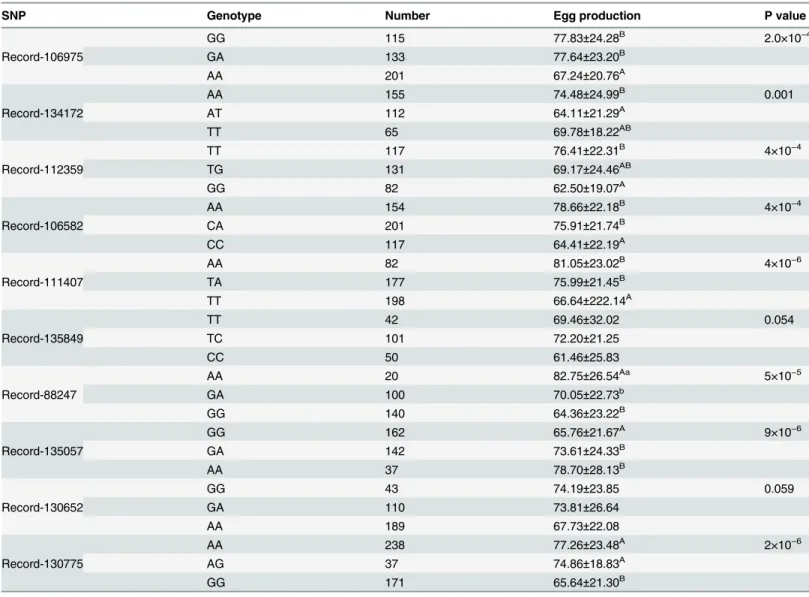
As shown inTable 5, the GG and GA genotypes of Record-106975 had significantly higher egg productionthan those with AA genotype(p<0.01). No significant difference in egg
produc-tion was observed between the GG and GA genotypes (p>0.05).
SNP Record-134172 geese with AA genotype showed higher egg production in comparison to the geese with AT genotype (p<0.01), but TT genotype showed no significant difference
with the AA and AT genotypes (p>0.05).
Table 5. Least squares means and standard deviations of the association analysis between different genotypes on egg number.
SNP Genotype Number Egg production P value
Record-106975
GG 115 77.83±24.28B 2.0×10⁻⁴
GA 133 77.64±23.20B
AA 201 67.24±20.76A
Record-134172
AA 155 74.48±24.99B 0.001
AT 112 64.11±21.29A
TT 65 69.78±18.22AB
Record-112359
TT 117 76.41±22.31B 4×10⁻⁴
TG 131 69.17±24.46AB
GG 82 62.50±19.07A
Record-106582
AA 154 78.66±22.18B 4×10⁻⁴
CA 201 75.91±21.74B
CC 117 64.41±22.19A
Record-111407
AA 82 81.05±23.02B 4×10⁻⁶
TA 177 75.99±21.45B
TT 198 66.64±222.14A
Record-135849
TT 42 69.46±32.02 0.054
TC 101 72.20±21.25
CC 50 61.46±25.83
Record-88247
AA 20 82.75±26.54Aa 5×10⁻⁵
GA 100 70.05±22.73b
GG 140 64.36±23.22B
Record-135057
GG 162 65.76±21.67A 9×10⁻⁶
GA 142 73.61±24.33B
AA 37 78.70±28.13B
Record-130652
GG 43 74.19±23.85 0.059
GA 110 73.81±26.64
AA 189 67.73±22.08
Record-130775
AA 238 77.26±23.48A 2×10⁻⁶
AG 37 74.86±18.83A
GG 171 65.64±21.30B
Note: Multiple comparisons were performed using the Duncan multiple-range test a, bmeans with different superscripts in the same column are different withp
<0.05 A, Bmeans with different superscripts in the same column are different withp
<0.01.
Record-112359, the TT genotype had significantly higher egg production than those with GG genotype (p<0.01). The TG genotype showed no significant difference on egg production
compared with the TT and GG genotype (p>0.05)
Record-106582, the AA and CA genotype had significantly (p<0.01) higher egg production
than those with GG genotype, but there was no significant difference between the CA and AA genotype (p>0.05).
Record-111407, geese with the AA and TA genotype had significantly higher egg production than those with the TT genotype (p<0.01). No significant difference in egg production was
observed in the AA and TA genotypes (p>0.05).
For Record-88247, the AA genotype had significantly higheregg production than those with GG genotype(p<0.01). The AA genotype had significantly higher egg production than those
with GA genotype (p<0.05).
For Record135057, the AA and GA genotypes had significantly higher egg production than those with GG genotype (p<0.01).
For Record-130775, the AA and AG genotypes had higheregg production than those with GG genotype (p<0.01).
For Record-135849 and Record-130652, no significant association between the genotypes and egg production was found (p>0.05). These results indicated that these 8 SNP
(Record-106975, Record-134172, Record-112359, Record-106582, Record-111407, Record-88247, Record-135057, Record-130652 and Record-130775) were significantly associated with egg production trait (p<0.01).These newly identified SNP were deposited in NCBI dbSNPdatabase
with the accession numbers 1714766361, 1714766362, 1714766363, 1714766364, 1714766365, 1714766367, 1714766368 and 1714766370, respectively.
Regression Analysis of Multiple Markers on Laying Performance
In the single-marker associations, we identified 8 SNP with significant effects on egg numbers in geese. Linear regression model analysis was used to evaluate multiple significant markers effect on goose laying performance. The 8 SNP were involved in the analysis to determine gene combinations or networks for the trait (Fig 2). Two networks were established, one of which included two markers, and another consisted of three markers. 111407 and Record-106975 were included in the two-marker network (Fig 2A). The predicted value (left in the rectangle) showed high correlation with corresponding actual values (right in the rectangle) (r = 0.98, r = 0.81). Record-111407 and Record-106975 demonstrated additive and dominant effect on laying performance, respectively. For Record-106975, the substitution of GG/GA with TT genotype will lead to decreasing of average egg numbers by 9.45. For Record-111407, trans-version of A to T will result in descend of egg numbers by 7.71. The three-marker network introduced an additional marker Record-112359, which exhibited additive effect on laying per-formance (Fig 2B). The substitution of T to G decreased egg numbers by 5.16.
Identification of Novel Genes Harboring Laying-Related SNP
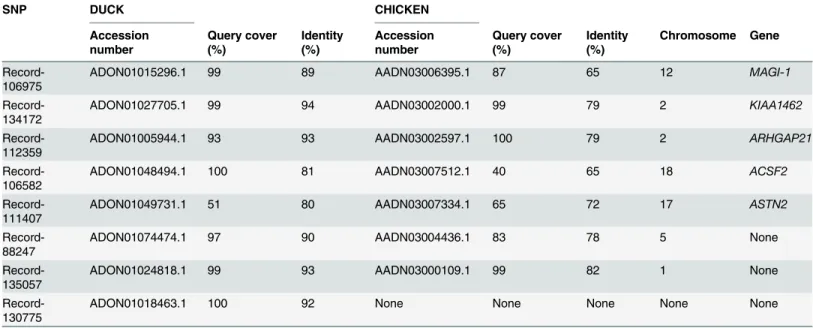
Based on the above 8 candidate SNP, we tried to identified related functional genes in goose. Firstly, BLAST searches against the NCBI public database using the candidate RAD tags were performed to retrieve orthologous sequences. However, no significant matched sequence was obtained since the 90-bp RAD tags were too short for effective alignment. Therefore, we used IPCR to extend the unknown regions flanking the candidate RAD tags. The extended
sequences were used for further BLAST. As there is no reference genomic information available for geese yet, we mainly used the retrieved duck or chicken sequences for goose gene
As shown inTable 6andS2 Table, we cloned 2,488 bp length of flanking sequence based on Record-106975. The DNA sequence exhibits 89% and 65% identities with duck and chicken Fig 2. Genetic networks with multiple makers established by the linear regression analysis for egg number in geese.The numbers in arrows represent substitution effects of one type of genotypes or allele for another one. Each combined genotype(s) between different makers has two means of performance: predicted (left in the rectangle) and actual (right in the rectangle) values. A) Genetic networks with two markers established by the linear regression analysis for egg number in geese. B) Genetic networks with three markers established by the linear regression analysis for egg number in geese.
sequences in the whole-genome shotgun contigs database of ducks (taxid: 8835) and chicken (taxid: 9031), respectively. The gene ofmembrane associated guanylate kinase(MAGI-1) was obtained base on the sequence of Record-106975 by the tool of NCBI Map Viewer.
For Record-134172, 1,964 bp length of flanking sequence was obtained by IPCR. The DNA sequence exhibits 94% and 79% identities with duck and chicken sequences, respectively. KIAA1462gene was identified base on the sequence of Record-134172.
For Record-112359, 2,164 bp length of flanking sequence was obtained by IPCR. The DNA sequence exhibits 93% and 79% identities with duck and chicken sequences, respectively.Rho GTPase activating protein 21(ARHGAP21) gene was identified base on the sequence of Record-112359.
For Record-106582, 2,623 bplength of flanking sequence was obtained by IPCR. The DNA sequence exhibits 81% and 65% identities with duck and chicken sequences, respectively.Acyl-CoA synthetase family member 2(ACSF2) gene was identified base on the sequence of Record-106582.
For Record-111407, 1,508 bp length of flanking sequence was obtained by IPCR. The DNA sequence exhibits 80% and 72% identities with duck and chicken sequences, respectively. Astrotactin 2(ASTN2) gene was identified base on the sequence of Record-111407.
The derived sequences of Record-106975, Record-134172, Record-112359, Record-106582 and Record-111407 were deposited in GenBank (http://www.ncbi.nlm.nih.gov/genbank) with the accession numbers KP271033, KP271035, KP271036, KP271032 and KP271034,
respectively.
For Record-88247, Record-135057 and Record-130775, 3,100 bp, 1,300 bp and 4,711 bp of flanking sequences were obtained by IPCR, respectively. Three DNA sequences exhibits 90%, 93% and 92% identities with duck sequences, respectively. The DNA sequences of Record-88247 and Record-135057 exhibit 78% and 82% identities with chicken sequences, respectively. We didnotfind the orthologous sequence from the whole-genome shotgun contigs database of chicken (taxid: 9031) for the Record-130775.
Table 6. Nucleotide BLAST and gene cloning.
SNP DUCK CHICKEN
Accession number
Query cover (%)
Identity (%)
Accession number
Query cover (%)
Identity (%)
Chromosome Gene
Record-106975
ADON01015296.1 99 89 AADN03006395.1 87 65 12 MAGI-1
Record-134172
ADON01027705.1 99 94 AADN03002000.1 99 79 2 KIAA1462
Record-112359
ADON01005944.1 93 93 AADN03002597.1 100 79 2 ARHGAP21
Record-106582
ADON01048494.1 100 81 AADN03007512.1 40 65 18 ACSF2
Record-111407
ADON01049731.1 51 80 AADN03007334.1 65 72 17 ASTN2
Record-88247
ADON01074474.1 97 90 AADN03004436.1 83 78 5 None
Record-135057
ADON01024818.1 99 93 AADN03000109.1 99 82 1 None
Record-130775
ADON01018463.1 100 92 None None None None None
Discussion
Pool-Based RAD Sequencing
In the present study, we adopted an economical and efficient method of pooled comparative RAD sequencing to discover SNPrelated to goose laying performance. Many studies of mining SNP in animalswithout reference genomes havebeen reported [16,26,27]. Since there is no ref-erence genome available for geese, RAD sequencing provides a cost-effective approach to dis-cover very large number of SNP across goose genome.
The ratio of transition/transversion (ts/tv) is the general property of DNA-sequence evolu-tion[28]. For all the genomic sequences that had been investigated, transitions had been noted to occur at higher frequencies than transversions[10,29,30], because transition did not require a change in conformation[28,31]. In this study, ts/tv ratiois 1.10 for geese, which isin accor-dance with the rule of transition bias.
The shallow sequencing depth of next-generation sequencing is a major determinant of the quality of genotype calls generated from sequence data [32,33] and the cost of sequencing[34]. Catchen et al. (2011) simulated the RAD-seq process in order totest the ability of USTACKS to identify loci inthreespine stickleback. They demonstrated thatthe mean sequencing depth of 20× and 40× were dependable for next generation sequencing at low error rate [19]. In this study, the average sequencing depth ofLEBV andHEBV group are20× and 17×respectively, suggesting the reliable sequencing result was obtained upon the depth.
Discovering Laying-Related SNP
A two-step strategy was applied to discover laying-related SNP by combining pool-based RAD sequencing with individual-based verification in larger population. Next generation sequencing (NGS) of pools of individuals is often more effective in SNP discovery on a genome-wide scale and provides more accurate allele frequency estimates, even when taking sequencing errors into account [33,35,36]. The more cost-effective method of NGS of DNA pools was widely used in various researches[18], which proved that NGS of DNA pools allows estimating the allele frequencies at single SNP with acceptable accuracy, but considerable lower library con-struction and sequencing efforts. In our study, we identified 467 putative SNP associated with egg production by comparing estimated allele frequencies between LEBV and HEBV DNA pools. 55 out of 467 SNP which were suitable for AS PCR were subjected to individual genotyp-ing in LEBV andHEBV cohorts. 10 SNP exhibited different allelic distribution between the two cohorts, with 18.2% positive rate. Compared with the previous studies, Turner et al. (2010) detected 8.4 million polymorphisms between two DNA pools ofArabidopsis lyratafrom ser-pentine and nonserser-pentine soils. Of the 8.4 million polymorphisms, 96 have allele frequency differences of greater than 80% between soil types. At the same time, 81 genes were found based on 96 polymorphisms [37]. There are no uniform standards can be obtained to evaluate the numbers of positive rate polymorphisms from pool-based sequencing. However, Gautier et al. (2013) assessed the accuracy of allele frequency estimation based on the data of pool and individual-based RAD sequencing. The results showed that DNA pool sequencing is an eco-nomical and effective method to estimate allele frequencies for massive number of SNP sites [38]. Zhu et al. (2012) experimentally identified that DNA pool sequencing is a very powerful and cost-effective technique for SNP discovery on genome-wide scales [39].
conclude that pool-based RAD sequencing combined with extreme representative individual comparison is a cost-effective way to identify associate SNP for the traits of interest.
Association Analysis with Egg Production
To improve laying performance is of great significance for goose production. Nevertheless, due to the low heritability of reproductivity, phenotype-based selection is of low efficiency for improving laying performance. Identification of genetic markers or genes involved is condu-cive to improvement of such a trait of low heritability. Numerous researchers had been focused on exploring genetic mechanisms of geese reproductive trait. Jiang et al. (2011) detected SNP in the 5'-flanking region ofPRLgene to find genetic marker influencing on reproduction traits in theWan-xiWhite goose [40]. Chen et al. (2012) revealed the significant association between SNP inPRLRexon 10 and egg performance ofWanjiangwhite goose [3]. Xu et al. (2013) per-formedde novotranscriptome assembly and gene expression analysis and identified a large number of genes associated with follicle development and reproductive biology including cho-lesterol side-chain cleavage enzymeanddopamine beta-hydroxylas[9]. Kang et al (2014) dem-onstrated thatenolase1(ENO1) gene expression was higher than in the ovaries of laying geese compared with prelaying geese, and identified expression profiling of theENO1gene in the ovarian follicle of the Sichuan white goose [41]. In our study, we clearly demonstrated that 8 SNPdisplayed significant effects on laying trait in geese. The linear regression procedure fur-ther revealed two multiple-SNP networks for egg number in which Record-111407, 106975 and 112359 were involved. The model prediction showed good agreement with the observed values, which verified the combination effects of these SNP on egg number. Previous studies also reported multiple genes or markers can be used for predication of traits. Jiang et al. (2009) confirmed two-gene or three-gene networks significantly affected 5 or 8 traits in beef cattle through the regression analysis of multiple markers [25]. Ghazalpour et al. (2006) constructed a gene co-expression network in mouse liver with microarray and genetic marker data, and examined the relationship of several gene modules and body weight of mouse[42]. Therefore, these 8 SNP, especially the combination of Record-111407, 106975 and 112359, could be prom-ising molecular markers for the selection of goose laying performance. We further explored the functional association ofMAGI-1,ARHGAP21andASTN2derived from Record-111407, 106975 and 112359 respectively, by using DAVID Bioinformatics Resources 6.7 [43] and UniHI online tool [44].The analysis resultsshows these genes are not directlyassociated in any signal pathway or gene network.However,MAGI-1 and ARHGAP21can be directly or indi-rectly regulated byStratifin(SFN) gene. It has been reported that the expression ofSFNis fre-quently lost in various types of human diseases including ovarian cancer[45], uterine papillary serous carcinoma[46], uterine leiomyomas [47], ovarian granulosa cell tumors and steroid cell tumors[48]. Wang et al. (2012) indicated the expression ofSFNwas negatively correlated with estrogenandprogesterone receptor(ERandPR)[47]. Khongmanee et al. (2013) revealed that SFNplay an important role in anoikis resistance of cholangiocarcinoma cells[49]. A lot of evi-dences show the strong possibility thatMAGI-1andARHGAP21will play a role in disease and function of reproduction.
Gene Cloning
production.Actually, RAD-sequencing is a methodthat creates a reduced representation of genome by restriction enzyme digestion.The SNP obtained by this method only represent a small portion of the whole genome. In this study, 884,827 and 942,117 RAD-tags were obtained from the LEBV and HEBV DNA pool, respectively. The average coverage rate was estimated to be ~6.96% of the whole genome(1.1Gb,Anas platyrhynchos[52]).Therefore, it is of high possi-bility that the previouswell-known laying related genes could not be included in the gene list obtained.
For theMAGI-1gene, Kranjec et al. (2014) demonstrated itcan promote the cell-cell contact in HPV-positive cells, thereby has the function of represseing cell proliferation and promoting apoptosis [53].ARHGAP21functions preferentially as aGTPase-activating protein(GAP) for CDC42and regulates theARP2/3complex. It is localized in the nucleus, cytoplasm, or perinuc-lear region and participates in cell-cell adhesion formation and cellular migration[54,55]. KIAA1462is a protein-coding gene which is localized in the nucleus, cytosol and plasma mem-brane. Diseases associated withKIAA1462include artery disease and coronary artery disease [56–58]. Akashi et al. (2011) identified theKIAA1462as a novel protein localized at cell–cell junctions, and concluded that the accumulation ofKIAA1462into endothelial cell–cell junc-tions depends on VE-cadherin-mediated cell–cell adhesion [59]. Oocyte growth is supported by theca cells and granulosa cells, which established dynamic and highly organized cell layers surrounding the oocyte.Gap junctions between oocytes and granulosa cells is complex, and plays a major role in the support of oocyte growth, the maintenance of meiotic arrest, and sig-nal transduction throughout the follicular epithelium[60,61]. A well-known effect associated with the establishment of cell-cell junction is the inhibition of cell proliferation [53,62,63]. These above evidences show that these genes (MAGI-1,ARHGAP21andKIAA1462) have a high possibility to affect the granulosa cell proliferation and apoptosis, then interfere with oocyte growth. In addition,KIAA1462plays a very important role in meiotic recombination. Chowdhury et al. (2009) foundKIAA1462was one of six loci associated with variation in human recombination rates [64]. Failures or errors in meiosis can lead to infertility, miscar-riages, or birth defects [65,66].
Theother two cloned genesincludeACSF2andASTN2.ACSF2is the member of Acyl-CoA synthetases (ACS) family, which is involved in fatty acid synthesis and the tricarboxylic acid cycle [67].ACSF2is a mitochondrial matrix enzyme and located inthe mitochondrial matrix [68]. The characteristic ofACSF2found in the engery metabolism processes, and be related with mitochondrial function, suggested this gene may play a role in the reproduction.ASTN2 is expressed at high levels in migrating, cerebellar granule neurons [69]. It plays an important role in neuronal functioning [70,71]. Lesch et al. (2008) identified theASTN2gene participates in cell adhesion and neuronal cell–cell communication [72]. Ahn et al. (2010) found a novel microRNA that was derived from an intron withinASTN2gene, and was preferentially expressed in the gonads [73].
Conclusions
physiological cascade. Indeed, more research in this vein will help in the production of all sorts of animals.
Supporting Information
S1 Fig. Agarose gel electrophoresis of IPCR products in the eight SNPS.M1 indicates 1kb DNA maker. M2 indicates 250bp-I DNA ladder maker.
(TIF)
S1 Table. SNPs and their primers information for the geese. (XLSX)
S2 Table. Primers of inverse PCR. (XLSX)
Acknowledgments
This work was supported by Jiangsu Lihua Animal Husbandry CO. LTD Research Fund to J. Chen. This work was also funded by Jiangsu Agriculture Science and Technology Innovation Fund (JASTIF, CX(14)2071) and the Fundamental Research Funds for the Central Universities (No. KYZ201414).
Author Contributions
Conceived and designed the experiments: JC. Performed the experiments: SGY WWC. Ana-lyzed the data: SGY LFZ HMH RXZ MVD W. Wei. Contributed reagents/materials/analysis tools: JC LFZ W. Wu JNZ HLL. Wrote the paper: SGY LFZ MVD JC.
References
1. Berger J, Suzuki T, Senti KA, Stubbs J, Schaffner G, Dickson BJ (2001) Genetic mapping with SNP markers inDrosophila. Nature Genetics 29: 475–481. PMID:11726933
2. Stickney HL, Schmutz J, Woods IG, Holtzer CC, Dickson MC, Kelly PD, et al. (2002) Rapid mapping of
zebrafishmutations with SNPs and oligonucleotide microarrays. Genome Research 12: 1929–1934. PMID:12466297
3. Chen J, Liu H, Cai Y, Wang G, Liu H, Li J (2012) Mutations in the exon 10 of prolactin receptor gene change the egg production performance inWanjiangwhite goose. Molecular biology reports 39: 475– 483. doi:10.1007/s11033-011-0761-yPMID:21559838
4. Zhao X, Yang G, Sun Y, Zhou Q, Wang S (2011) Association of polymorphisms ofGnRH,PRLand
FSHβgenes with egg production traits inWulongGoose. China Poultry 16: 009.
5. Zhang X, Kang B, Na Zhang L, Ru Guo J, Mei Jiang D, Ji H, et al. (2013) Gene expression profiles of LH, prolactin and their receptors in female Zi geese (Anser cygnoides) during development. Folia Biolo-gica 61: 59–64. PMID:23767294
6. Ding S, Yen C, Wang P, Lin H, Hsu J, Shen T (2007) The differential expression of hepatic genes between prelaying and laying geese. Poultry Science 86: 1206–1212. PMID:17495093 7. Guo J, Tang Q, Zhang S, Ma Y, Lu H, Su J, et al. (2011) Identification of broodiness-related geese
genes by suppression subtractive hybridization. Acta Veterinaria et Zootechnica Sinica 42: 1477– 1784.
8. Morozova O, Marra MA (2008) Applications of next-generation sequencing technologies in functional genomics. Genomics 92: 255–264. doi:10.1016/j.ygeno.2008.07.001PMID:18703132
9. Xu Q, Zhao W, Chen Y, Tong Y, Rong G, Huang Z, et al. (2013) Transcriptome profiling of the goose (Anser cygnoides) ovaries identify laying and broodiness phenotypes. PLoS One 8: e55496. doi:10. 1371/journal.pone.0055496PMID:23405160
10. Bus A, Hecht J, Huettel B, Reinhardt R, Stich B (2012) High-throughput polymorphism detection and genotyping inBrassica napususing next-generation RAD sequencing. BMC Genomics 13: 281. doi:
11. Houston RD, Davey JW, Bishop SC, Lowe NR, Mota-Velasco JC, Hamilton A, et al. (2012) Characteri-sation of QTL-linked and genome-wide restriction site-associated DNA (RAD) markers in farmed Atlan-tic salmon. BMC Genomics 13: 244. doi:10.1186/1471-2164-13-244PMID:22702806
12. Baird NA, Etter PD, Atwood TS, Currey MC, Shiver AL, Lewis ZA, et al. (2008) Rapid SNP discovery and genetic mapping using sequenced RAD markers. PLoS One 3: e3376. doi:10.1371/journal.pone. 0003376PMID:18852878
13. Rowe H, Renaut S, Guggisberg A (2011) RAD in the realm of next-generation sequencing technolo-gies. Molecular Ecology 20: 3499–3502. PMID:21991593
14. Willing E-M, Hoffmann M, Klein JD, Weigel D, Dreyer C (2011) Paired-end RAD-seq for de novo assembly and marker design without available reference. Bioinformatics 27: 2187–2193. doi:10.1093/ bioinformatics/btr346PMID:21712251
15. Carmichael SN, Bekaert M, Taggart JB, Christie HR, Bassett DI, Bron JE, et al. (2013) Identification of a sex-linked SNP marker in thesalmon louse(Lepeophtheirus salmonis) using RAD sequencing. PLoS One 8: e77832. doi:10.1371/journal.pone.0077832PMID:24147087
16. Senn H, Ogden R, Cezard T, Gharbi K, Iqbal Z, Johnson E, et al. (2013) Reference-free SNP discovery for the Eurasian beaver from restriction site-associated DNA paired-end data. Molecular Ecology 22: 3141–3150. doi:10.1111/mec.12242PMID:23432348
17. Amish SJ, Hohenlohe PA, Painter S, Leary RF, Muhlfeld C, Allendorf FW, et al. (2012) RAD sequencing yields a high success rate for westslope cutthroat and rainbow trout species-diagnostic SNP assays. Molecular ecology resources 12: 653–660. doi:10.1111/j.1755-0998.2012.03157.xPMID:22672623 18. Ogden R, Gharbi K, Mugue N, Martinsohn J, Senn H, Davey J, et al. (2013) Sturgeon conservation
genomics: SNP discovery and validation using RAD sequencing. Molecular Ecology 22: 3112–3123. doi:10.1111/mec.12234PMID:23473098
19. Catchen JM, Amores A, Hohenlohe P, Cresko W, Postlethwait JH (2011) Stacks: building and genotyp-ing loci de novo from short-read sequences. G3: Genes, Genomes, Genetics 1: 171–182.
20. Liu J, Huang S, Sun M, Liu S, Liu Y, Wang W, et al. (2012) An improved allele-specific PCR primer design method for SNP marker analysis and its application. Plant Methods 8: 34. doi: 10.1186/1746-4811-8-34PMID:22920499
21. Hayashi K, Yoshida H, Ashikawa I (2006) Development of PCR-based allele-specific and InDel marker sets for nine rice blast resistance genes. Theoretical and Applied Genetics 113: 251–260. PMID:
16791691
22. Johnson RC, Nelson GW, Troyer JL, Lautenberger JA, Kessing BD, Winkler CA, et al. (2010) Account-ing for multiple comparisons in a genome-wide association study (GWAS). BMC Genomics 11: 724. doi:10.1186/1471-2164-11-724PMID:21176216
23. Ihaka R, Gentleman R (1996) R: a language for data analysis and graphics. Journal of computational and graphical statistics 5: 299–314.
24. Liu K, Muse SV (2005) PowerMarker: an integrated analysis environment for genetic marker analysis. Bioinformatics 21: 2128–2129. PMID:15705655
25. Jiang Z, Michal JJ, Chen J, Daniels TF, Kunej T, Garcia MD, et al. (2009) Discovery of novel genetic networks associated with 19 economically important traits in beef cattle. International journal of biologi-cal sciences 5: 528. PMID:19727437
26. Everett MV, Grau ED, Seeb JE (2011) Short reads and nonmodel species: exploring the complexities of next-generation sequence assembly and SNP discovery in the absence of a reference genome. Molecular ecology resources 11: 93–108. doi:10.1111/j.1755-0998.2010.02969.xPMID:21429166 27. You F, Huo N, Deal K, Gu Y, Luo M-C, McGuire P, et al. (2011) Annotation-based genome-wide SNP discovery in the large and complexAegilops tauschiigenome using next-generation sequencing with-out a reference genome sequence. BMC Genomics 12: 59. doi:10.1186/1471-2164-12-59PMID:
21266061
28. Wakeley J (1996) The excess of transitions among nucleotide substitutions: new methods of estimating transition bias underscore its significance. Trends in ecology & evolution 11: 158–162.
29. Pegadaraju V, Nipper R, Hulke B, Qi L, Schultz Q (2013) De novo sequencing of sunflower genome for SNP discovery using RAD (Restriction site Associated DNA) approach. BMC Genomics 14: 556. doi:
10.1186/1471-2164-14-556PMID:23947483
30. Pujolar JM, Jacobsen M, Frydenberg J, Als TD, Larsen PF, Maes G, et al. (2013) A resource of genome-wide single-nucleotide polymorphisms generated by RAD tag sequencing in the critically endangered European eel. Molecular ecology resources 13: 706–714. doi:10.1111/1755-0998.12117
PMID:23656721
32. Garner C (2011) Confounded by sequencing depth in association studies of rare alleles. Genetic epide-miology 35: 261–268. PMID:21328616
33. Davey JW, Hohenlohe PA, Etter PD, Boone JQ, Catchen JM, Blaxter ML (2011) Genome-wide genetic marker discovery and genotyping using next-generation sequencing. Nature Reviews Genetics 12: 499–510. doi:10.1038/nrg3012PMID:21681211
34. Hou R, Yang Z, Li M, Xiao H (2013) Impact of the next-generation sequencing data depth on various biological result inferences. Science China-Life Sciences 56: 104–109. doi: 10.1007/s11427-013-4441-0PMID:23393025
35. Futschik A, Schloetterer C (2010) The next generation of molecular markers from massively parallel sequencing of pooled DNA samples. Genetics 186: 207–218. doi:10.1534/genetics.110.114397
PMID:20457880
36. Kapun M, Van Schalkwyk H, McAllister B, Flatt T, Schloetterer C (2014) Inference of chromosomal inversion dynamics from Pool-Seq data in natural and laboratory populations ofDrosophila melanoga-ster. Molecular Ecology 23: 1813–1827. doi:10.1111/mec.12594PMID:24372777
37. Turner TL, Stewart AD, Fields AT, Rice WR, Tarone AM (2011) Population-based resequencing of experimentally evolved populations reveals the genetic basis of body size variation inDrosophila mela-nogaster. PLoS Genetics 7: e1001336. doi:10.1371/journal.pgen.1001336PMID:21437274 38. Gautier M, Foucaud J, Gharbi K, Cézard T, Galan M, Loiseau A, et al. (2013) Estimation of population
allele frequencies from next-generation sequencing data: poo-versus individual-based genotyping. Molecular Ecology 22: 3766–3779. doi:10.1111/mec.12360PMID:23730833
39. Zhu Y, Bergland AO, González J, Petrov DA (2012) Empirical validation of pooled whole genome popu-lation re-sequencing inDrosophila melanogaster. PLoS One 7: e41901. doi:10.1371/journal.pone. 0041901PMID:22848651
40. Jiang RS, Zhang LL, Geng ZY, Yang T, Zhang SS (2009) Single nucleotide polymorphisms in the 5 '-flanking region of the prolactin gene and the association with reproduction traits in geese. South Afri-can Journal of Animal Science 39: 83–87.
41. Kang B, Jiang DM, Bai L, He H, Ma R (2014) Molecular characterisation and expression profiling of the
ENO1gene in the ovarian follicle of theSichuanwhite goose. Molecular biology reports: 1–9.
42. Ghazalpour A, Doss S, Zhang B, Wang S, Plaisier C, Castellanos R, et al. (2006) Integrating genetic and network analysis to characterize genes related to mouse weight. PLoS Genetics 2: e130. PMID:
16934000
43. Huang DW, Sherman BT, Lempicki RA (2008) Systematic and integrative analysis of large gene lists using DAVID bioinformatics resources. Nature Protocols 4: 44–57.
44. Chaurasia G, Iqbal Y, Hänig C, Herzel H, Wanker EE, Futschik ME (2007) UniHI: an entry gate to the human protein interactome. Nucleic acids research 35: D590–D594. PMID:17158159
45. Montavon C, Gloss BS, Warton K, Barton CA, Statham AL, Scurry JP, et al. (2012) Prognostic and diag-nostic significance of DNA methylation patterns in high grade serous ovarian cancer. Gynecologic oncology 124: 582–588. doi:10.1016/j.ygyno.2011.11.026PMID:22115852
46. Suzuki F, Nagase S, Suzuki K, Oba E, Hiroki E, Matsuda Y, et al. (2013) Decreased expression of 14-3-3σis predictive of poor prognosis for patients with human uterine papillary serous carcinoma. The Tohoku journal of experimental medicine 231: 193–199. PMID:24201220
47. Wang L, Huang H, Liu D, Fang S, Xian Y, Zhou J, et al. (2012) Evaluation of 14-3-3 protein family levels and associated receptor expression of estrogen and progesterone in Human Uterine Leiomyomas. Gynecological Endocrinology 28: 665–668. doi:10.3109/09513590.2012.650768PMID:22329840 48. Chen L, Yang B (2013) 14-3-3 sigma is a useful immunohistochemical marker for diagnosing ovarian
granulosa cell tumors and steroid cell tumors. International Journal of Gynecologic Pathology 32: 156– 162.
49. Khongmanee A, Lirdprapamongkol K, Tit-oon P, Chokchaichamnankit D, Svasti J, Srisomsap C (2013) Proteomic analysis reveals important role of 14-3-3σin anoikis resistance of cholangiocarcinoma cells. Proteomics 13: 3157–3166. doi:10.1002/pmic.201300219PMID:24030981
50. Ru hua W (2009) Analysis of the single nucleotide polymorphisms in the 5' regulating region of goose
GnRHgene. Animal Husbandry and Feed Science 2: 067.
51. Zhang X, Kang B, Na Zhang L, Ru Guo J, Mei Jiang D, Ji H, et al. (2013) Gene expression profiles of
LH,prolactinand their receptors in female Zi geese (Anser cygnoides) during development. Folia Biolo-gica 61: 1–2.
53. Kranjec C, Massimi P, Banks L (2014) Restoration ofMAGI-1expression in human papillomavirus-pos-itive tumor cells induces cell growth arrest and apoptosis. Journal of virology 88: 7155–7169. doi:10. 1128/JVI.03247-13PMID:24696483
54. Barcellos KS, Bigarella CL, Wagner MV, Vieira KP, Lazarini M, Langford PR, et al. (2013)ARHGAP21
protein, a new partner ofα-Tubulininvolved in cell-cell adhesion formation and essential for epithelial-mesenchymal transition. Journal of Biological Chemistry 288: 2179–2189. doi:10.1074/jbc.M112. 432716PMID:23235160
55. Ménétrey J, Perderiset M, Cicolari J, Dubois T, Elkhatib N, Khadali FE, et al. (2007) Structural basis for
ARF1-mediated recruitment ofARHGAP21to Golgi membranes. The EMBO journal 26: 1953–1962. PMID:17347647
56. Murdock DG, Bradford Y, Schnetz-Boutaud N, Mayo P, Allen MJ, D’Aoust LN, et al. (2013)KIAA1462, A coronary artery disease associated gene, is a candidate gene for late onset alzheimer disease in APOE carriers. PLoS One 8: e82194. doi:10.1371/journal.pone.0082194PMID:24349219
57. Consortium CADG (2011) A genome-wide association study in Europeans and South Asians identifies five new loci for coronary artery disease. Nature genetics 43: 339–344. doi:10.1038/ng.782PMID:
21378988
58. Erdmann J, Willenborg C, Nahrstaedt J, Preuss M, König IR, Baumert J, et al. (2010) Genome-wide association study identifies a new locus for coronary artery disease on chromosome 10p11. 23. Euro-pean heart journal: ehq405.
59. Akashi M, Higashi T, Masuda S, Komori T, Furuse M (2011) A coronary artery disease-associated gene product,JCAD/KIAA1462, is a novel component of endothelial cell–cell junctions. Biochemical and biophysical research communications 413: 224–229. doi:10.1016/j.bbrc.2011.08.073PMID:
21884682
60. Eppig J, Chesnel F, Hirao Y, O'Brien M, Pendola F, Watanabe S, et al. (1997) Oocyte control of granu-losa cell development: how and why. Human reproduction (Oxford, England) 12: 127–132.
61. Stein LS, Stoica G, Tilley R, Burghardt RC (1991) Rat ovarian granulosa cell culture: a model system for the study of cell-cell communication during multistep transformation. Cancer research 51: 696–706. PMID:1845958
62. Paraguassu-Braga F, Borojevic R, Bouzas L, Barcinski M, Bonomo A (2003) Bone marrow stroma inhibits proliferation and apoptosis in leukemic cells through gap junction-mediated cell communication. Cell Death & Differentiation 10: 1101–1108.
63. Wilson MR, Close TW, Trosko JE (2000) Cell population dynamics (apoptosis, mitosis, and cell–cell communication) during disruption of homeostasis. Experimental cell research 254: 257–268. PMID:
10640424
64. Chowdhury R, Bois PR, Feingold E, Sherman SL, Cheung VG (2009) Genetic analysis of variation in human meiotic recombination. PLoS Genetics 5: e1000648. doi:10.1371/journal.pgen.1000648PMID:
19763160
65. Akiyama T, Nagata M, Aoki F (2006) Inadequate histone deacetylation during oocyte meiosis causes aneuploidy and embryo death in mice. Proceedings of the National Academy of Sciences 103: 7339– 7344.
66. Lancaster OM, Breuer M, Cullen CF, Ito T, Ohkura H (2010) The meiotic recombination checkpoint sup-pressesNHK-1kinase to prevent reorganisation of the oocyte nucleus in Drosophila. PLoS Genetics 6: e1001179. doi:10.1371/journal.pgen.1001179PMID:21060809
67. Hallows WC, Lee S, Denu JM (2006) Sirtuins deacetylate and activate mammalian acetyl-CoA synthe-tases. Proceedings of the National Academy of Sciences 103: 10230–10235.
68. Fujino T, Kondo J, Ishikawa M, Morikawa K, Yamamoto TT (2001) Acetyl-CoA synthetase 2, a mito-chondrial matrix enzyme involved in the oxidation of acetate. Journal of Biological Chemistry 276: 11420–11426. PMID:11150295
69. Wilson PM, Fryer RH, Fang Y, Hatten ME (2010)Astn2, a novel member of the astrotactin gene family, regulates the trafficking ofASTN1during glial-guided neuronal migration. The Journal of Neuroscience 30: 8529–8540. doi:10.1523/JNEUROSCI.0032-10.2010PMID:20573900
70. Glessner JT, Wang K, Cai G, Korvatska O, Kim CE, Wood S, et al. (2009) Autism genome-wide copy number variation reveals ubiquitin and neuronal genes. Nature 459: 569–573. doi:10.1038/ nature07953PMID:19404257
71. Vrijenhoek T, Buizer-Voskamp JE, van der Stelt I, Strengman E, Sabatti C, Geurts van Kessel A, et al. (2008) Recurrent CNVs disrupt three candidate genes in schizophrenia patients. The American Journal of Human Genetics 83: 504–510.
studies. Journal of neural transmission 115: 1573–1585. doi:10.1007/s00702-008-0119-3PMID:
18839057