Invited Review
Models for estimating feed intake in small ruminants
Giuseppe Pulina1, Marcella Avondo2, Giovanni Molle1,3, Ana Helena Dias Francesconi1, Alberto Stanislao Atzori1, Antonello Cannas1
1 Dipartimento di AGRARIA, University of Sassari, 07100, Sassari, Italy.
2 Dipartimento di Scienze delle Produzioni Agrarie e Alimentari, University of Catania, 95123 Catania, Italy. 3 Department of Animal Production, AGRIS Sardegna, Bonassai, 07100 Sassari, Italy.
ABSTRACT - This review deals with the most relevant limits and developments of the modeling of intake of sheep and goats reared intensively and extensively. Because small ruminants are normally fed ad libitum, voluntary feed intake is crucial in feeding tactics and strategies aimed at optimal animal production. The effects of genetic, neuroendocrine, hormonal, feed and environmental factors on voluntary feed intake were discussed. Then, several mathematical models to estimate dry matter intake (DMI) were examined, with emphasis on empirical models for sheep and goats in intensive farm systems or in extensive areas under pasture or rangeland conditions. A sensitivity analysis of four models of prediction of DMI in housed lactating dairy sheep and meat sheep breeds was also presented. This work evidenced a large variability in the approaches used and in the variables considered for housed sheep and goats. Regarding the estimation of feed intake for grazing sheep and browsing goats, the accuracy of estimates based on empirical models developed so far is very low when applied out of the boundaries of the studied system. Feeding experiments indoors and outdoors remain fundamental for a better modeling and understanding of the interactions between feeds and small ruminants. However, there is a need for biological and theoretical frameworks in which these experiments should be carried out, so that appropriate empirical or mechanistic equations to predict DMI could be developed.
Key Words: dry matter intake, feedlot, goats, grazing, modeling, sheep
Introduction
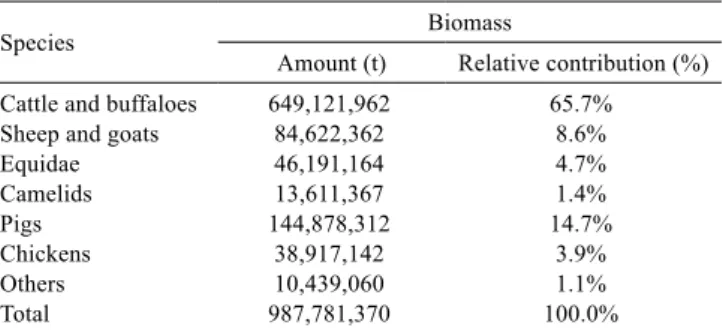
Sheep and goats represent the third largest livestock body mass in the world, with 8.6% of an estimated 1 billion tons of biomass (Table 1). Moreover, they constitute 10% of the total mass of domestic herbivores and 11% of the mass of ruminants. Since sheep and goats were the first animals to be domesticated, small ruminants are widespread throughout the world, with a prevalence of farming systems based on grazing of natural pastures.
Considering that in 2010 small ruminants had a global dry matter intake (DMI) of nearly 8,800 MTON, for a production of 5.5 MTON of proteins, their global conversion index was 159 kg DM per kg of protein produced (Table 2). In Brazil, this index is four times higher than in Italy (335 vs. 85 kg DM/kg protein), because of differences in their production distribution. In particular, in Brazil, protein from small ruminants is composed of 54% from meat and only 19% from milk, whereas in Italy it is constituted by 19% from meat and 62% from milk; the remainder being from wool in both
cases. From a thermodynamic point of view, it is clear that it is more convenient to raise small ruminants for milk production than for meat. However, it is also true that milk production is very difficult or even impossible in many areas of the globe where the climate is extreme or the forage availability is inconstant and the forage quality is poor.
Like other domestic ruminants, small ruminants are
normally fed ad libitum whether they are reared intensively,
with the amount of feed available controlled directly by the farmer, or extensively, with the availability of herbage from pasture or foliage from bushes varying according to geographic and climatic conditions. In both systems, the amount of DM (in kg) that a specific animal or group of animals can eat in a given period of time (usually a day) is called voluntary feed intake (VFI). However, under particular circumstances (e.g., short day length, limited herbage availability and adverse climatic conditions, such as snow, strong wind and drought), VFI can be limited and the animals cannot ingest enough feed to meet their nutritional requirements. In this case, production and reproduction level
ISSN 1806-9290
www.sbz.org.br R. Bras. Zootec., v.42, n.9, p.675-690, 2013
can be maintained only by using supplements such as hay, silages and concentrates.
Considering that feeding is the most important driving force of productive performances, VFI plays a pivotal role in feeding tactic (short-term management decisions) and strategy (medium-long term management decisions). Since the middle of the last century, VFI has drawn the attention of many scholars. J.M. Forbes, professor at the University of Leeds, wrote an important and exhaustive treatise on the intake of farm animals (Forbes, 1995), which should be read for a complete and relevant analysis of this matter. P.J. Van Soest, from Cornell University, devoted one chapter of his book on nutrition ecology of ruminants (Van Soest, 1994) to VFI, although his most important contribution in this respect was classifying herbivores, according to their feeding behavior, into browsers, grazers and intermediate feeders. In particular, sheep and goats are intermediate feeders, even though sheep prefer grasses and exploit a two dimensional pastoral space, grazing mainly the herbaceous plan, whereas goats can explore a three dimensional pastoral space, straightening the hind limbs or even climbing on trees, to browse leaves and shoots of bushes and trees (Van Soest, 1994). Nolan et al. (1999) reported that mixed animal grazing, thanks to the complementary grazing behavior patterns among different animal species, improves both animal performances and output for unit of land, reducing the risk of environmental damage. More recently, Baumont
et al. (2000) reviewed the literature on the influence of forage characteristics on behavior and intake in small ruminants and evidenced that the management of grazing circuit by shepherds is one of the factors that can optimize the exploitation of the pastoral environment.
Recognizing the fact that VFI plays a central role in the success of pastoral enterprises, this review will critically examine different models to estimate feed intake for sheep and goats reared in intensive farm systems or in extensive areas under pasture or rangeland conditions.
Factors influencing VFI in small ruminants
The VFI is a complex system which develops along the following three dimensions: animal, forage (or the ration) and environment (including management). These dimensions are not orthogonal, because of the existence of interactions among them.
Genetic factors
Because the heritability (h2) of a quantitative trait
measures the proportion of its variability which can be
transmitted to offspring, the h2 of VFI estimates the quota
of variability of intake genetically controlled, whereas 1-h2
measures the remaining variability due to the environment and the interaction between environment and genotype. Because the measurement of VFI is quite difficult and a
robust estimate of h2 requires a large database, there are
few papers dealing with heritability of intake and almost all of them refer to ram lambs. For example, Cameron (1988),
using different procedures, estimated an h2 of VFI ranging
from 0.14 to 0.59. Gullivan & Sullivan (1994) and Francois et al. (2002), both cited by Cammack et al. (2005), reported,
respectively, an h2 of 0.66 and 0.43, whereas Cammack
et al. (2005) found a noticeably lower h2 of 0.11 for VFI.
On Merino ewes grazing on pasture, Lee et al. (1995)
found an h2 of 0.12 for digestible organic matter (OM)
intake, whereas Fogarty et al. (2009) estimated a three-fold
higher h2 (0.32) for the same parameter. The latter value
was similar to the 0.39 found by Snowder & Van Vleck (2003) for postweaning ewe and ram lambs. Overall, the genetic component of VFI variability ranges from 0.10 to 0.60, with the complementary variability due to the environment and the interaction between them varying with the experimental conditions: the higher the control of environmental conditions, the higher the heritability. This means that, under controlled feeding management, VFI variability is lower and, consequently, the estimation of intake is easier and the selection for this character is effective. On the other hand, in pasture and rangeland farm
Table 1 - Global estimate of livestock biomass based on FAOSTAT (2010) database
Species Biomass
Amount (t) Relative contribution (%)
Cattle and buffaloes 649,121,962 65.7%
Sheep and goats 84,622,362 8.6%
Equidae 46,191,164 4.7%
Camelids 13,611,367 1.4%
Pigs 144,878,312 14.7%
Chickens 38,917,142 3.9%
Others 10,439,060 1.1%
Total 987,781,370 100.0%
Table 2 - Annual dry matter intake, annual protein yield and gross conversion rate estimates of sheep and goats, based on FAOSTAT (2010) database
Area Heads (t of DM)Intake1 (t of protein)Yield2 Conversion index(kg DM/kg protein) World 2,000,380,066 876,166,469 5,514,361 159
Brazil 26,693,380 11,691,700 34,946 335
Italy 8,973,600 3,930,437 46,453 85
1 Intake was calculated as 3% of 40 kg BW per day (i.e., 1.2 kg of DM).
2 Protein yield was calculated considering 45 g protein/kg of milk, 170 g protein/kg
systems, where variability of environmental constraints prevails, the estimate of VFI is difficult and selection for this character is problematic.
Neuroendocrine and hormonal factors
Animals explore the feeding space, from the manger to the pasture, by using all their cognitive and humoral functions. Foraging by wild herbivores is a compromise between the attention devoted to searching for food and the one oriented towards escaping from predators. Differently, VFI by domestic ruminants, from which the danger of predators has been generally removed, is controlled only by psycho-physiological factors. Such factors pertain to the level of satisfaction of nutritional needs and the degree of filling of the rumen and gut. For nearly a century, hunger, appetite and satiety have been considered under neural control (Brobeck, 1957). Only recently, light has been shed on the key factors influencing the feeding behavior of animals and humans (de Araujo et al., 2006). A recent comprehensive review of the mechanism involved in the neuroendocrine and physiological control of feed intake in domesticated ruminants has been written by Roche et al. (2008).
The animal energy homeostasis depends on the ability of the central nervous system to integrate the signals coming from the periphery, which reveal both the long-term body energy status and the short-long-term metabolic status associated with circadian meal-related changes. These signals are nervous, humoral and neurohumoral, as demonstrated forty years ago by Seoane et al. (1972), who injected the jugular blood of satiated sheep in hungry
ones and vice versa, obtaining a VFI decrease of 17%
and a VFI increase of 48%, respectively. Now it is clear that the hypothalamus is the control center of the feeding, because lesions on either or both sides of it resulted in large disturbances in VFI: lateral injuries lead to anorexia, whereas ventromedial lesions cause hyperphagia. A cohort of neurotransmitters controls the state of hunger and satiety (Bear et al., 2007). Briefly, the long-term regulation of feeding behavior is controlled by anorectic (depressing appetite) and orexigenic (stimulating appetite) neuropeptides, whose secretion is stimulated by the leptin hormone secreted mainly by the adipose tissue in response to the energy status of animal body. As an example, if the blood leptin concentration increases, due to a positive energy balance, the arcuate nucleus of the hypothalamus secretes α-melanocyte stimulating hormone (αMSH) and cocaine-
and amphetamine-regulated transcript (CART) peptides,
leading to the secretion of the thyroid-stimulating hormone (TSH) and adreno-corticotropic hormone (ACTH) by the pituitary gland. This, in turn, increases the metabolism and
body temperature. In this case, the somatic motor response depresses VFI. However, when blood leptin concentration falls, as a result of a negative body energy balance, another group of neurons located in the arcuate nucleus secrete
their own peptides, neuropeptide Y (NPY) and
agouti-related peptide (AgRP), which have the opposite effect of that of αMSH and CART and, thus, inhibit the secretion of TSH and ACTH and activate the feeding behavior of the animal. In this case, VFI increases. Searching for food is strategic for survival, and this mechanism is reinforced by two other neuropeptides that are secreted by the lateral hypothalamus in response to a decrease in blood leptine: the melanin-concentrating hormone (MCH) and orexin. All these mechanisms explain the long-term energy balance regulation of VFI (Baile & Della-Fera, 1981) which, based on the lipostatic theory, integrates via leptin another important signaling pathway represented by the insulin/ glucagon concentration in blood (Roche et al., 2008). The short-term action of insulin in ruminants, instead, is still unclear (Roche et al., 2008).
applied to the liver metabolism, which has recently come back into vogue, explains a large quota of variability in the control of VFI in ruminants (Allen et al., 2009), proving that good ideas never die.
Feed factors
Nutritional value and filling effect are the main characteristics of feed involved in VFI. Conrad et al. (1964) demonstrated that adjusted DMI in dairy cows is limited by physical factors until the DM digestibility reaches a level near 67%, after which metabolic factors prevail. The same conclusions were drawn by Dinius & Baumgardt (1970), who found the point of maximum intake (e.g., passage from physical to metabolic control of ingestion) at 2.47 kcal/g of DE in sheep fed pellets with different digestibility values. Roughly, the most important physical factors that limit the VFI are the fiber content of feeds and fiber digestibility kinetics in the rumen, whereas the main limiting physiological factor is undoubtedly the content of soluble carbohydrates. Fiber fills the rumen, then its dynamics of disappearance, via fermentation or transit, influences the mean rumen retention time and so the meal interval. On the other hand, soluble carbohydrates are fermented by rumen microbial population to propionate, which is revealed by chemoreceptors of the rumen and liver as the most potent anorexic metabolite produced in the gut (Van Soest, 1994). In grazing sheep, herbage mass and sward height and density can limit VFI (Forbes, 1995). Similarly, in browsing goats, the density and structure of a bush can deeply influence VFI.
Environmental factors
Among environmental constraints, temperature, orography, photoperiod and distance from the drinking water source are the main factors that limit the VFI especially in grazing animals. Shepherds may change VFI of sheep and goats by feeding them supplements or by interacting with their spontaneous decisions, e.g., by moving the flock around the patch to boost the appetite of the animal and optimize the herbage consumption. Giving concentrate as a supplement reduces the time spent on grazing and, thus, the herbage intake. This substitution effect is probably due to an increase of rumen VFA and digesta passage rate in the duodenum, which then increases the secretion of anorexic peptides (Roche et al., 2008).
Modeling VFI in small ruminants
Mathematical models can help us to understand and predict a particular phenomenon. Considering that VFI is a
complex system, both mechanistic and empirical approaches can be useful to: i) select variables which are easy to detect and inexpensive; ii) better understand the relationships among such variables; and iii) obtain reliable predictions of VFI. In the mechanistic approach, emulation of system dynamics is based on a set of differential equations which simulate the mechanisms at the basis of the phenomenon. These equations, in biology, are generally time-dependent and numerically integrated, with the obtained results of the state variables being the trajectory of the state variables over time. On the other hand, the empirical approach is, apparently, time-independent, and the solution is obtained by using a single summative equation. Mechanistic modeling of intake has been a field of great success for many scholars, as illustrated by Forbes (1995). As an example, Forbes (1980) developed a hydraulic-like dynamic model to simulate intake in ruminants. Later, Sauvant et al. (1996) simulated sheep feeding behavior by using a large set of equations, thus developing two sub-models to simulate the ingestion and chewing activities. The overall behavior of the model was shown to be adequate to describe intake and meals activities of confined sheep eating pelleted rations.
In the empirical approach, data collected in controlled experiments are analyzed by means of regression analysis. In this case, VFI is studied with respect to the most relevant variables with a model such as the following:
VFI = a + bLW + cLWC + dMY + eNDF + fCP where LW is live weight (or metabolic weight), LWC is LW change, MY is milk yield (usually expressed as fat and protein-corrected milk), NDF is the neutral detergent fiber of the feed and CP is crude protein of feed.
Usually, mechanistic models are useful to investigate the internal mechanisms which produce the phenomenon, but their global output is quite poor, because they have a high explicative and a low predictive power. In contrast, empirical models show better precision and accuracy in predicting VFI, but their explicative power is limited. With the aim of providing useful scientific and technical information, this paper develops the analysis of models belonging almost exclusively to the empirical class.
Intake models for housed sheep and goats
conditions are less important and easier to predict when animals are kept indoors rather than outdoors.
Nevertheless, the feeding of sheep and goats indoors should consider the nutritional peculiarities of these species, to avoid the common mistake of feeding them as if they were “small cattle”. Indeed, compared with cattle, sheep and goats (Cannas, 2004): i) have to eat more (higher level of intake) to satisfy their maintenance requirements, which results in a higher passage rate of feed and lower fiber (forage) digestibility; ii) tend to have more selective feeding behavior; iii) have their intake more affected by the particle size and the fiber content of the forage and can ruminate feed particles of smaller size; iv) have to spend more time eating and ruminating each kilogram of feed; and v) tend to have higher digestibility of grains and high-energy diets.
Unfortunately, very few data are available to define the optimal dietary fiber concentration and dietary particle size of sheep and goats (Cannas, 2004). Indeed, these dietary factors can have a large impact on the DMI of small ruminants and are usually considered by prediction equations of DMI for cattle.
In this section, intake prediction models adopted or suggested by several feeding systems are described separately for sheep and goats. Some of these models have been recently described by Resende et al. (2008). A sensitivity analysis on sheep models is also discussed.
Sheep
The Agricultural and Food Research Council (AFRC, 1995, 1998) used published empirical equations based mainly on the previous AFRC (1990) and MLC (1988) models (Table 3). The AFRC considers three principal categories of sheep (pregnant, lactating and lambs) and proposes different equations to estimate the intake of hay or silage in mixed diets for pregnant or lactating ewes. Body weight (BW), concentrate supply, digestible OM and dietary ammonia N (only for silages) are used as predictors. Hence, the estimation of DMI of the forages considers animal and diet characteristics, whereas concentrate intake is not predicted and is considered as an input. For lactating ewes, milk production is not an explicit variable. The prediction equations were developed for ewes with twins, whereas fixed corrections factors are used for single or triplets. The effects of the variation in milk yield during lactation are not taken into consideration. For lambs, different prediction equations are used depending if the diet is coarse, fine or made of silages only. The predictors for lambs are BW and the ratio of metabolizable energy (ME) to gross energy (GE)
(called qm), whereas, surprisingly, average daily gain is not
considered as a predictor.
The AFRC (1998) reports prediction equations of Kearl (1982) based on research conducted in India and developed specifically for developing countries. The equations use animal BW as predictor, and use an intake coefficient which differs for lactating, pregnant and growing sheep (Table 3). A quadratic adjustment factor for the ME content of the diet is applied only to growing lambs, whereas their average daily gain is not considered as a predictor.
The Institut National de la Recherche Agronomique (INRA, 1988, 2007) proposed an approach to estimate DMI based on the intake capacity (IC) of the ewes. In this case, DMI is expressed in filling units for sheep (UEM
in INRA, literally unitè encombrement mouton), i.e., the
DMI of a reference animal (a grown mutton of 60 kg of BW) eating a reference feed (pasture grass with 15% CP, 25% crude fiber, and 0.77 of digestible OM). The UEM
corresponds to 75 g/kg BW0.75, i.e., 1.62 kg/d. The actual
DMI for other forages is obtained as: IC/FFfor, where FFfor is the filling factor of each forage. The reference feed has a FFfor equal to 1, lower quality forages have a FFfor greater than 1 and higher quality forages have a FFfor lower than 1. INRA reports the FFfor for a large number of forages, with appropriate equations for its estimation based on forage chemical composition. INRA reports a procedure to estimate the substitution rate of forages when concentrates are supplied. Concentrates do not have their own independent filling factor, thus a filling factor is calculated for each concentrate on the basis of the FFfor of each forage. In the INRA model, the prediction equations of the IC of dry or early-pregnant ewes and of rams use BW0.75 as main prediction variable, which is multiplied for
an adjustment factor which decreases the IC as the body condition score of sheep increases from 2 to 4.5 (Table 3). For pregnant ewes, only tabular values are reported. For lactating ewes, IC is predicted on the basis of the BW and the fat-corrected milk yield (FCM; Table 3).
Caja et al. (2002) proposed prediction equations based on the same principles of the INRA model to estimate the IC of lactating ewes (Table 3) and to estimate the DMI of pregnant ewes. The estimation of DMI for pregnant ewes uses as predictors the number and the total BW of lambs and the BW of the mother.
even though it is mainly based on sheep data. The NRC model predicts DMI as the potential intake of animals eating diets with non-limiting DM digestibility (i.e., DM digestibility >0.8) on the basis of the relative body size (actual BW/mature BW) of the animal and of their mature size. This enables the formulation of a general DMI equation for growing and mature animals of all categories which is then adjusted for diet quality, by using DM digestibility and percentage of legumes in the diet as predictors, and, only for lactating ewes, also for milk yield (predicted on the basis of litter size and days in milk) and diet quality.
Pulina et al. (1996) developed prediction equations for various sheep categories (lactating ewes, dry ewes, lambs, female lambs until firstpregnancyandrams).Theirequations were later adopted by the CNCPS for Sheep (Cannas et al., 2004) and the Small Ruminant Nutrition System (Cannas et al., 2007a,b; Cannas et al., 2010; Tedeschi et al., 2010). These equations were developed with a meta-analysis of published experiments and assume that DMI is not limited by physical or quality constraints (e.g., NDF or CP content of the diet). Thus, the DMI predictions represent the potential (based on requirements) of maximum intake
by sheep. The predictors are BW0.75, change in BW and
Table 3 - Prediction models of dry matter intake for housed sheep
References, categories and equations Notes
AFRC (1995; 1998) Lactating ewes
Hay intake (concentrate intake is not predicted)
DMI = 0.001 × BW × (Ihay – 0.0691 × (Conc × Ihay) + 2.027 × Conc) Ihay (g/kg BW) = 0.0481 × DigOM – 5.25
Silage intake (concentrate intake is not predicted)
DMI = 0.001 BW × (0.946 × Isilage – 0.0204 (Conc × Isilage) + 0.65 + Conc) Isilage (g/kg BW) = 0.0232 × DigOM – 0.1041 × BW – 0.0314× Na+ 13.36 Pregnant ewes
Hay intake DMI = C × (1.9 − 0.076 × T – 0.002033 × DigOM) + 0.002444 × DigOM – 0.09565 × N + 0.01891 × BW8 − 1.44
Silage intake DMI = 0.001 BW (0.946 × Isilage − 0.0204 (C × I) + 0.569) Isilage (g/kg BW) = 0.0202 × DigOM – 0.0905 × BW – 0.0273 × Na + 11.62 Lambs
Coarse diet DMI = (104.7 × qm + 0.307 × BW – 15) × BW0.75/1000 Fine diet DMI = (150.3 –78 qm – 0.408 × BW) × BW0.75/1000 Silage alone DMI = 0.046 × BW0.75
Correction factor for DMI: twins = 1; single = 0.94; triplets = 1.1.
Conc = concentrates, g/kg BW DigOM = digestible OM, g/kg Na = ammonia N, g/kg I = intake
C = concentrates, kg/d
BW8 = BW of the ewe 8 wks before lambing, kg DigOM = digestible OM, g/kg
N = number of lambs T = week of pregnancy qm = ME/GE
I = intake
Kearl (1982; reported by the AFRC, 1998) Lactating ewes DMI = (138.0 × BW0.75)/1000
Pregnant ewes DMI = (90.0 × BW0.75)/1000
Lambs DMI = (74.9 × BW0.75 × (–0.666 + 1.333 × ME – 0.2666 ME2))/1000
ME = dietary ME concentration, Mcal/kg
INRA (2007) Lactating ewes after weaning IC = 0.024 × BW + 0.9 × FCM
Dry or early pregnant ewes, rams IC = BCSadj × BW0.75, where BCSadj = 0.075 with BCS 4-4.5; 0.081 with BCS 3-3.5; 0.089 with BCS 2-2.5
IC = DMI for a reference feed; BCS = body condition score, scale 0-5; FCM = MY × [(0.0071 × MF) + (0.0043 × MP) + 0.2244]
MY = milk yield, L/d; MF = milk fat, g/L; MP = milk protein, g/L; N = number of lambs; PN = total lamb BW at birth, kg;
BWm = BW of the mother Caja et al. (2002)
Lactating ewes IC = 0.0255 × BW + 0.75 × FCM Pregnant ewes (starting 6 weeks before parturition) IC = 0.304 − 0.004 × N − 0.049 × PN + 0.027 × BWm
NRC (2007) General DMI = [0.04 × mature BW × Z (1.7 –Z)] × IFlact × IFquality Lactation factor IFlact = 1.0 + 0.025 × N × DIM1.4 × exp(–0.05 × DIM) Quality constraint IFquality = 1.0 – 1.7 × (0.8 – DM digestibility) + 0.17 × L
Z = actual BW/mature BW N = 1.0 single, 1.35 twins Digestibility, respect to unity L = proportion of legumes in diet Pulina et al. (1996)
Lactating ewes DMI = (− 0.545 + 0.095 × BW0.75 + 0.65 × (MY × (0.25 + 0.085 × Fat% + 0.035 × Prot%)) + 0.0025 × BWchange)× K
Dry ewes DMI = (− 0.545 + 0.095 BW0.75 + 0.005 × BW change) × K Lambs & ewe lambs DMI = − 0.124 + 0.0711 BW0.75 + 0.0015 × BW
change Rams DMI = 0.065 × BW0.75
For pregnancy: BW of the litter >4.0 kg = K is 0.82, 0.90, 0.96 for wks 1, 2-3, 4-5; BW of the litter <4.0 kg = K is 0.88, 0.93, 0.97 for wks 1, 2-3, 4-5.
MY = milk yield, kg/d BWchange = g/d Serra (1998)
Lactating ewes DMI = 0.0214 BW + 0.319 × (MY × (0.25 + 0.085 × Fat% + 0.035 × Prot%)) + 0.0373 × CPdiet
MY = milk yield, kg/d
CPdiet = dietary CP concentration, %DM
FCM. Correction factors are used to take into account the reduction of the intake in late pregnancy and early lactation (Table 3). The equation to predict DMI of lambs was evaluated in an experiment carried out in South Africa with two local breeds (Cannas et al., 2009). The prediction of feed intake was accurate and precise, with a low systematic bias (observed DMI =1327 g/d; predicted DMI = 1291 g/d; mean bias = 35 g/d; root mean square prediction error =
45.5 g/d; and r2 = 0.95). The same research group (Serra,
1998) developed an equation for lactating sheep which included a predictor related to diet quality, i.e., the dietary CP concentration (Table 3).
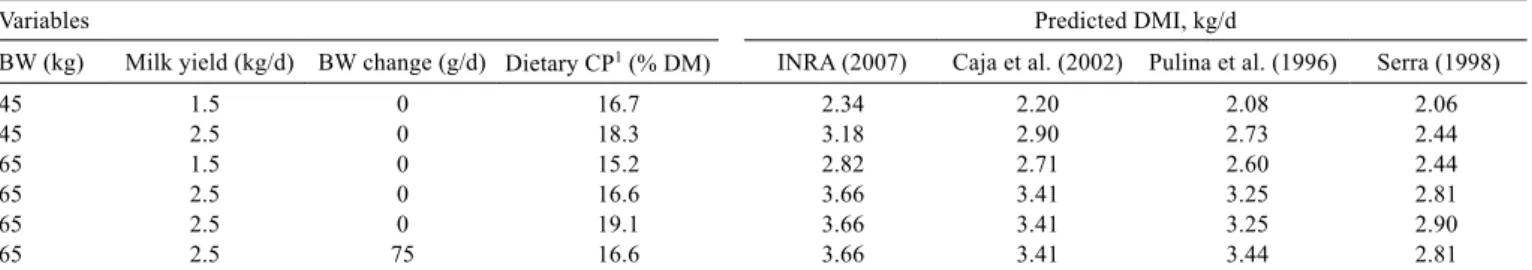
Because, to our knowledge, no systematic evaluations of the predictions of DMI in sheep have been previously performed, a sensitivity analysis was carried out to compare the predictions of the models reported in Table 3 for lactating dairy sheep (i.e., Pulina et al., 1996; Serra, 1998; Caja et al., 2002; INRA, 2007) and lactating meat sheep (i.e., Kearl, 1982; AFRC, 1995; NRC, 2007) breeds (Tables 4 and 5, respectively).
For lactating dairy ewes (Table 4), DMI was predicted at 35 days from lambing, considering diets based on alfalfa hay (with filling factor equal to 1 for the INRA system). The comparison included animals of different BW, milk yield and BW gain. The CP concentration was estimated by using the optimal values reported by Cannas (2004) for animals varying in milk yield and BW. In one scenario,
DMI was also calculated by considering a CP excess, i.e., 19.1% of dietary CP content instead of the 16.6% suggested by Cannas (2004).
The sensitivity analysis showed that the INRA system gave the highest DMI, whereas Serra (1998) gave the lowest. The predictions of Caja et al. (2002) and those of Pulina et al. (1996) were similar, despite the different origin of the data used by these authors. In all the models, both BW and milk yield had a large impact on the predictions. The model of Pulina et al. (1996) was the only one that accounted for BW variations and which did not include diet composition-related predictors. Dietary CP content had a fairly small effect on DMI prediction in the model of Serra (1998), whereas forage filling factor had a large effect on the prediction of DMI in the models of INRA and Caja et al. (2002), especially when low quality forages were used (data not reported).
For lactating meat-breed ewes (Table 5), the variables considered in the sensitivity analysis were the BW of the mother, number of lambs suckled at 35 days after parturition, DM and OM digestibility, and percentage of legumes in the diets. When required (AFRC system), the dose of concentrate used was set at 0.011 g/kg BW.
The comparison showed high variability among models. Kearl (1982) proposed the simplest model, which used only BW as predictor (Table 3). This model gave much higher values of DMI than the NRC (2007) and AFRC (1995)
Table 4 - Intake prediction with different models for lactating dairy sheep differing in BW, milk yield (assuming 6.5% fat and 5.8% protein), BW gain, and dietary CP
Variables Predicted DMI, kg/d
BW (kg) Milk yield (kg/d) BW change (g/d) Dietary CP1 (% DM) INRA (2007) Caja et al. (2002) Pulina et al. (1996) Serra (1998)
45 1.5 0 16.7 2.34 2.20 2.08 2.06
45 2.5 0 18.3 3.18 2.90 2.73 2.44
65 1.5 0 15.2 2.82 2.71 2.60 2.44
65 2.5 0 16.6 3.66 3.41 3.25 2.81
65 2.5 0 19.1 3.66 3.41 3.25 2.90
65 2.5 75 16.6 3.66 3.41 3.44 2.81
1 Dietary CP was obtained for lactating ewes at various BW and milk yield, as suggested by Cannas (2004).
DMI - dry matter intake; BW - body weight; CP - crude protein.
Table 5 - Intake prediction with different models for lactating meat sheep (fed hay and 0.011 kg of concentrate/kg of BW) suckling single, twins or triplets
Variables Predicted DMI, kg/d
BW, kg Lambs Digestible DM% Digestible OM% Concentrate, kg/d Legumes % of diet AFRC (1995) NRC (2007) Kearl (1982)
45 1 0.65 0.685 0.50 0 1.67 1.53 2.40
45 2 0.65 0.685 0.50 0 1.75 1.74 2.40
45 2 0.75 0.800 0.50 0 1.99 2.13 2.40
65 1 0.65 0.685 0.72 0 2.41 2.21 3.16
65 2 0.65 0.685 0.72 0 2.52 2.51 3.16
65 2 0.75 0.800 0.72 0 2.88 3.08 3.16
65 2 0.75 0.800 0.72 50 2.88 3.37 3.16
65 3 0.75 0.800 0.72 0 3.10 3.08 3.16
models in most cases, but especially when DM digestibility was low (65%). This is surprising because this model was proposed for developing countries, where DM digestibility is usually quite low because of climatic conditions. The AFRC and the NRC models gave similar estimates for most conditions. The discrepancy between AFRC and NRC was large only when a legume-rich diet was considered because the latter model has a specific correction factor that increases DMI when legumes are used.
The NRC model was very sensitive to diet quality-related variables (digestibility and content of legumes), whereas in the AFRC predictions diet quality and animal factors were almost equally partitioned. The AFRC model was the only one accounting for the effect of triplets on the DMI of ewes.
Goats
In contrast to the prediction equations for sheep, the AFRC predicts total DMI and not forage DMI for
goats. In this system, two different equations, one based on INRA (1978) and modified by Alderman (1982) and the other based on INRA (1988) data, are suggested for lactating goats, using BW, BW gain, milk yield and forage proportion in the diets as predictors (Table 6). For dry goats, the prediction equation is based on the AFRC equation for lambs assuming coarse diets (Table 3) but with values increased by 25%; it includes animal-related
predictors and a diet-quality predictor (qm). For pregnant
goats, however, predictors related to diet quality were not considered (Table 6). For kids, the same equations of lambs (Table 3) are suggested.
The AFRC (1998) reports prediction equations of Kearl (1982) for developing countries. The equations are the same reported and discussed for sheep (Table 3), except that lower coefficients (and thus DMI) related to
BW0.75 are used for lactating goats (−13%) and pregnant
goats (−15%), whereas slightly higher values (+2.4%) are used for kids than for lambs. The biological basis of
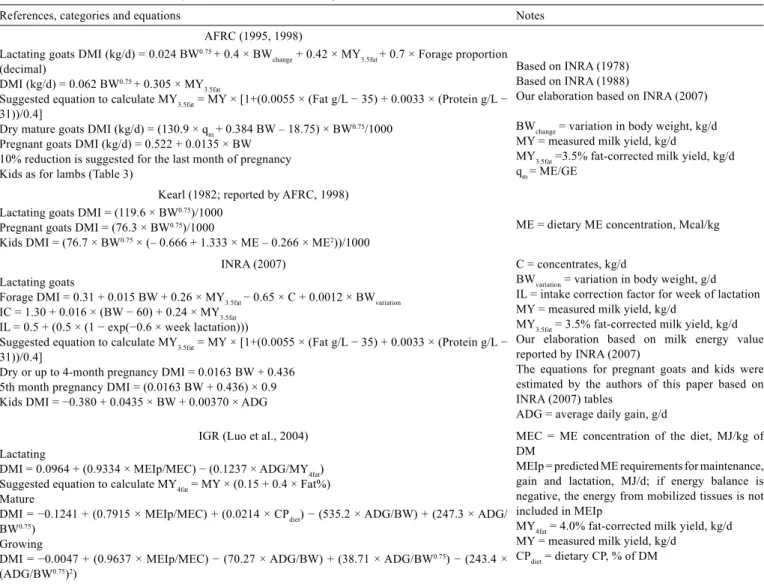
Table 6 - Prediction models of dry matter intake for housed goats
References, categories and equations Notes
AFRC (1995, 1998) Lactating goats DMI (kg/d) = 0.024 BW0.75 + 0.4 × BW
change + 0.42 × MY3.5fat + 0.7 × Forage proportion (decimal)
DMI (kg/d) = 0.062 BW0.75 + 0.305 × MY 3.5fat
Suggested equation to calculate MY3.5fat = MY × [1+(0.0055 × (Fat g/L − 35) + 0.0033 × (Protein g/L − 31))/0.4]
Dry mature goats DMI (kg/d) = (130.9 × qm + 0.384 BW – 18.75) × BW0.75/1000 Pregnant goats DMI (kg/d) = 0.522 + 0.0135 × BW
10% reduction is suggested for the last month of pregnancy Kids as for lambs (Table 3)
Based on INRA (1978) Based on INRA (1988)
Our elaboration based on INRA (2007)
BWchange = variation in body weight, kg/d MY = measured milk yield, kg/d
MY3.5fat =3.5% fat-corrected milk yield, kg/d qm = ME/GE
Kearl (1982; reported by AFRC, 1998) Lactating goats DMI = (119.6 × BW0.75)/1000
Pregnant goats DMI = (76.3 × BW0.75)/1000
Kids DMI = (76.7 × BW0.75 × (– 0.666 + 1.333 × ME – 0.266 × ME2))/1000
ME = dietary ME concentration, Mcal/kg
INRA (2007) Lactating goats
Forage DMI = 0.31 + 0.015 BW + 0.26 × MY3.5fat − 0.65 × C + 0.0012 × BWvariation IC = 1.30 + 0.016 × (BW − 60) + 0.24 × MY3.5fat
IL = 0.5 + (0.5 × (1 − exp(−0.6 × week lactation)))
Suggested equation to calculate MY3.5fat = MY × [1+(0.0055 × (Fat g/L − 35) + 0.0033 × (Protein g/L − 31))/0.4]
Dry or up to 4-month pregnancy DMI = 0.0163 BW + 0.436 5th month pregnancy DMI = (0.0163 BW + 0.436) × 0.9 Kids DMI = −0.380 + 0.0435 × BW + 0.00370 × ADG
C = concentrates, kg/d
BWvariation = variation in body weight, g/d IL = intake correction factor for week of lactation MY = measured milk yield, kg/d
MY3.5fat = 3.5% fat-corrected milk yield, kg/d Our elaboration based on milk energy value reported by INRA (2007)
The equations for pregnant goats and kids were estimated by the authors of this paper based on INRA (2007) tables
ADG = average daily gain, g/d IGR (Luo et al., 2004)
Lactating
DMI = 0.0964 + (0.9334 × MEIp/MEC) − (0.1237 × ADG/MY4fat) Suggested equation to calculate MY4fat = MY × (0.15 + 0.4 × Fat%) Mature
DMI = −0.1241 + (0.7915 × MEIp/MEC) + (0.0214 × CPdiet) − (535.2 × ADG/BW) + (247.3 × ADG/ BW0.75)
Growing
DMI = −0.0047 + (0.9637 × MEIp/MEC) − (70.27 × ADG/BW) + (38.71 × ADG/BW0.75) − (243.4 × (ADG/BW0.75)2)
MEC = ME concentration of the diet, MJ/kg of DM
MEIp = predicted ME requirements for maintenance, gain and lactation, MJ/d; if energy balance is negative, the energy from mobilized tissues is not included in MEIp
MY4fat = 4.0% fat-corrected milk yield, kg/d MY = measured milk yield, kg/d
CPdiet = dietary CP, % of DM
these differences between speciesare not clear and might be related to different diets used by the two species in the developmental data sets.
The INRA model reports two prediction equations for lactating goats: one for forages only, in which DMI is predicted, and another one for all diets, in which the IC is predicted (Table 6). As for sheep, DMI is obtained by dividing the IC by the forage filling factor and then considering the substitution rate between forages and concentrates. The IC is then adjusted, in the case of goats, as a function of the week of lactation, with minimum intake (73% of maximum intake) at kidding and maximum intake from the 6th week of lactation on.
The E (Kika) of the Garza Institute for Goat Research-Langston University (IGR) developed a goat model to estimate energy and protein requirements and to predict DMI (Luo et al., 2004; Sahlu et al., 2004). For DMI prediction, IGR collected a large number of published data in a database, which were then used to develop, with regression techniques, 26 equations of feed intake prediction for lactating goats, 13 equations for growing kids and 8 equations for mature goats (Luo et al., 2004). The most relevant equations are reported in Table 6. A common predictor for all equations is the ratio between the predicted ME requirements for maintenance, gain and lactation and the dietary ME concentration of the diet. This allows the prediction of the DMI required to cover the requirements accounting for diet quality (in terms of ME concentration). In this model, BW is not an explicit variable but it is inherent to the calculation of ME requirements. The predicted values are then adjusted for the ratio between average daily gain and 4% FCM (lactating goats) or average daily gain
and BW or BW0.75 (mature dry goats and growing goats).
In the case of mature goats, DMI increases as dietary CP concentration increases. Whereas the whole IGR system to estimate energy and protein requirements was adopted by NRC (2007) as a reference system for goats, the equations to predict DMI considered by IGR were not used by the NRC (2007) model. The NRC (2007) suggested for goats the same equations proposed for sheep, even if they had not been tested for goats, justifying this choice with the lack of unequivocal evidence of differences between the two species.
To our knowledge, the only evaluation of the prediction accuracy and precision of recent published models for goats is that of Teixeira et al. (2011). These authors evaluated the intake prediction models for growing kids proposed by Kearl (1982; Table 6; equation reported as AFRC (1998) in the original paper), NRC (2007) for weaned kids (Table 3, for sheep) and CSIRO (2007) for unweaned kids. The latter
is similar to the NRC (2007) equation except that it uses a specific adjustment factor, which varies with the age of the kids, for milk diets or milk and solid diet. The evaluation was performed on 67 male, castrated kids (Saanen, Boer
× Saanen, and local breeds) fed ad libitum in 7 studies
conducted in Brazil. Their DMI was 521±327 (mean ± S.D.) g/d. In the evaluation, the Kearl (1982) equation underpredicted DMI by −91 g/d, whereas the NRC (2007) and CSIRO (2007) equations overpredicted it by +162 g/d and +255 g/d, respectively. In this study, a highly significant linear bias (P<0.01) was observed when the average daily gain (ADG) was considered as a covariate in the models for prediction of DMI. It also indicated that ADG should be considered in DMI prediction for growing animals. However, none of the tested equations considers ADG as an explicit variable.
Intake models for grazing sheep and browsing goats
Among the feeding systems of small ruminants, grazing natural or sown pastures is the most widespread practice of feeding supply. As underlined by Dove (2010) in a recent review, quantifying what and how grazing sheep eat represents the major constraint in balancing nutrient supply and nutrient requirements. In fact, care must be taken when extrapolating results obtained indoors to grazing situations (Fanchone et al., 2010), because behavioral constraints are more diversified on pasture than indoors. As defined by the Forage and Grazing Terminology Committee (Allen et al., 2011), “ingestive behavior of animals involved in grazing includes search for, select, prehend and consume forage”. Overall, these activities often result in a reduction in DMI, due to time subtracted from eating activity, but they also lead to an optimization of diet quality which is difficult to reach in stall-fed animals.
and are reluctant to penetrate below this layer, where they find a prevalence of dead material (Barthram & Grant, 1984). So, the higher the mass of green leaves, the higher is the intake achievable by sheep (Penning et al., 1998). When herbage mass is low, sheep change their grazing behavior, especially by increasing the biting rate. However, the ability of the animals to overcome this feed constraint and reach adequate intake levels depends on the degree of biomass shortage and sward homogeneity. For example, as found by Sibbald & Hooper (2003), in a vegetation distributed in discrete patches, the motivation for staying close to other animals may conflict with the motivation for moving towards patches of good vegetation, thus affecting individual foraging success. In this case, a trade-off has to be made between social behavior and foraging (Sibbald & Hooper, 2003).
Forage composition and digestibility affect DMI. High structural-carbohydrate content and low organic matter digestibility generally reduce intake in both confined and pasture-fed animals. However, a more complex mechanism can be involved in determining the relationships between intake and plant chemical composition in grazing small ruminants. In fact, when pasture quality makes it difficult to achieve adequate levels of ingestion, the physical characteristics of sheep and goats allow them to choose their diet. Choice activity is demonstrated by differences in chemical composition between the available and the selected herbage. By preferring some plants to others, grazing animals usually obtain a diet richer in digestible organic matter, crude protein and sugars and poorer in NDF
content. Selective activity is limited when a dense and
uniform pasture is available (Avondo & Lutri, 2004; Schiborra et al., 2010), whereas it increases as the heterogeneity of botanical composition and structure increases.
The complex mechanisms that drive the grazing animal to make its choices have been widely studied (Provenza et al., 2003; Baumont et al., 2004) and could be summarized as the “flavor-feedback interaction depending on chemical characteristics of feed, animal nutritional status and animal past or recent experience” (Decruyenaere et al., 2009).
Modeling the DMI of grazing herbivores is undoubtedly a challenge, especially for the following reasons: i) intake estimation, including diet composition assessment, is more difficult and less accurate under grazing than under stall-feeding conditions, whichever the adopted methodology is (e.g., Carvalho et al., 2007); ii) proper validation of grazing studies is impossible, because no measured data can be
regarded stricto sensu as reference (“true values”) under
grazing; and iii) intake estimates are much more expensive
on pasture than in stall-feeding systems. These reasons can explain why research on DMI estimation is nowadays more devoted to the fine tuning of intensively reared herds than to the management of extensive or semi-extensive livestock production systems. Actually, although most of the small ruminants in the world graze pastures or browse bushlands, modeling the DMI of grazing sheep and goats lags far behind modeling the DMI of grazing dairy cows (Faverdin et al., 2011; Baudracco et al., 2012).
Grazing sheep
Baumont et al. (2004) developed a mechanistic dynamic model aimed at predicting herbage intake (HI) of sheep grazing on grasslands typical of temperate climate, i.e., dominated by perennial grasses. The animal sub model of this complex algorithm is the one developed by Sauvant et al. (1996). The model also incorporates a sward-horizon sub-model, which includes the relationships between sward and bite characteristics, and a foraging-decision sub-model, which accounts for the choice of an animal for the grazing horizons. The Baumont et al. (2004) model assumes that sheep defoliate the sward by horizons (two-dimension grazing), which usually applies to homogeneously spatially distributed pastures (swards). The model validation for sheep under continuous stocking and rotational grazing showed that although the patterns of predicted variables and observed data were similar, sometimes their absolute values differed noticeably. A sensitivity analysis was used to identify the key factors of feeding behavior components, i.e., BM, intake rate (IR, g DM/min of grazing, which is the product of BM multiplied by BR), GT and herbage intake, in unsupplemented sheep. Such analysis showed that intake was particularly sensitive to herbage NDF content under both continuous and rotational management conditions.
Implementation of mechanistic dynamic models, such as that of Baumont et al. (2004), is useful for research and teaching purposes. However, the on-field application of these models is constrained by the shortage of basic data to adapt each model to different settings, i.e., to allow the adjustment in the vegetation and animal variables and then the re-calibration of their relationships.
range of environmental and management conditions. This model accounts for the utilization of pastures spanning from temperate perennial grasses, passing through Mediterranean annual forages, up to sub-tropical C4 grasses and legumes. To support the implementation of this model, user-friendly software packages have been developed within the GRAZPLAN DST platform, which includes the nutrition (GrazFeed) and the pasture (GrassGro) softwares, both widely utilized in Australia. In GrazFeed, the potential feed intake, set on the basis of sheep requirements, is modulated by factors related to pasture availability and ingestibility, the latter being strictly correlated with forage digestibility. Pasture availability, in turn, depends basically upon the herbage mass (HM) available, measured as kg DM/ha.
Overall, as pointed out by Pittroff & Kothmann (2001), the model of Freer et al. (1997) has a robust mathematical and biological basis, with the exception of the selection process algorithm, which is not properly explained at a biological level. The model is soundly sensitive to animal, pasture and supplementation changes, as shown by Dove et al. (2010). However, it has some relevant limitations which have so far prevented its adoption in rangeland and tropical conditions as well as in semi-intensive dairy-breed systems, such as those found in Mediterranean regions. Indeed, body mass and body composition of meat and wool sheep are different from those of dairy sheep (Cannas et al., 2004). Furthermore, restricted time of access to pasture is common in Mediterranean semi-intensive grazing production systems, but is not considered by GrazFeed. This is a relevant limit, considering that restricting time allocated to grazing on pasture is known to influence the ingestive behavior of ruminants (e.g., sheep; Iason et al., 1999). Finally, milk composition and the lactation curve pattern of dairy sheep, characterized by a higher persistency than that of meat breeds, are also overlooked by GrazFeed.
In contrast, the above shortcomings were dealt with by Avondo et al. (2002) when setting up a simple empirical model for estimating DMI of supplemented milked ewes grazing on Mediterranean pastures in Sicily (Italy), with time allocated to pasture restricted to 5-6 hours daily. This model consists of a set of single and multiple regressions calculated by plotting individual estimates of herbage intake against animal (body weight, BW; and milk yield, MY) and pasture (herbage mass, HM; and pasture height,
PH) variables. The most explicative equations of this
model have been recently updated by Avondo (2005), who developed three equations for three different crude protein levels of the herbage on offer, as follows:
1. For pasture with crude protein content >16% DM: Pasture DMI (g/d) = 997.1 + 73.9 HM (t DM/ha) – 27.4 PH (cm) + 20.4 HDM (%) + 0.16 FPCM (g/d) – 1.24
SCPI (g/d), n = 313, R2 = 0.54, P<0.01 for each retained
variable;
2. For pasture with crude protein content ≤16% DM and >10% DM:
Pasture DMI (g/d) = 420.4 + 95.9 HM (t DM/ha) + 0.33
FPCM (g/d) – 1.24 SCPI (g/d), n = 225, R2 = 0.35, P<0.01
for each retained variable;
3. For pasture with crude protein content <10% DM: Pasture DMI (g/d) = 118.38 + 165.8 HM (t DM/ha)
+ 0.253 FPCM (g/d), n = 112, R2 = 0.65, P<0.01 for each
variable retained in the model,
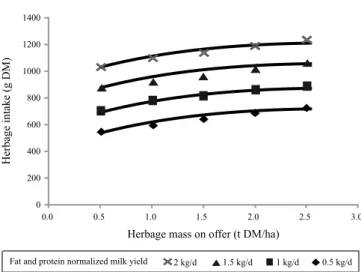
where HDM is herbage DM content (%), FPCM is fat and protein-corrected milk yield (Pulina et al., 1989) and SCPI is the CP intake from supplements (hay and concentrates). By using the prediction equations of Avondo (2005), we obtained first-approximation estimates of herbage intake of lactating dairy ewes grazing part-time on Mediterranean pasture (Figure 1).
For unrestricted time of access (c.a. 22 h/d) to a typical
cultivated Mediterranean forage crop (Lolium multiflorum),
an empirical model was proposed by Molle et al. (2004), which estimates intake for lactating dairy ewes under steady-state-like conditions of pasture, determined by continuous variable stocking. This model consists of the following two equations based on group means, each group consisting of 5 milked sheep:
Calculations were based on the above equation 2 of Avondo (2005).
Figure 1 - Pattern of herbage intake in lactating dairy sheep supplemented with 500 g/d of concentrate (16% CP, on a DM basis) and 700 g/d of hay (12% CP) and grazing a Mediterranean pasture (10-16% CP) with time allocated to the pasture restricted to 5-6 h/day.
0 200 400 600 800 1000 1200 1400
0.0 0.5 1.0 1.5 2.0 2.5 3.0
Herbage mass on offer (t DM/ha)
2 kg/d 1.5 kg/d 1 kg/d 0.5 kg/d
Fat and protein normalized milk yield
Herbage
intake
(g
1. Pasture DMI (g/d) = 1268 + 14.45 PH; n = 5; R2 = 0.92,
P<0.01;
2. Pasture DMI (g/d) = 333 + 38.57 PH – 0.24 PH2;
n = 6; R2 = 0.92, P<0.05.
These equations show that unsupplemented dairy ewes in early lactation (winter) increase their herbage intake linearly as pasture height increases from 2 to 8 cm, whereas in mid lactation (early spring) the trend of intake becomes quadratic, with a peak between 6 and 9 cm of pasture height. Actually, the changes in pasture structure (lower leaf-to-stem ratio and lower leaf area index) observed in spring tend to curb the positive relationship between HI and PH, particularly at heights higher than 8 cm (Molle et al., 2004). Also from a system standpoint, the milk production per hectare is maximized by keeping Italian ryegrass height in a range between 6 and 9 cm.
In Brazil, meat sheep performance measured as gain of BW per hectare did not vary as PH ranged from 12 and 19 cm (i.e., HM ranged from 1100 to 1700 kg DM/ha) (Roman et al., 2007), basically confirming the quadratic pattern shown in Sardinia (Italy) with the same forage species but under different production and environmental conditions. Overall, results by Molle et al. (2004) and Roman et al. (2007) confirm the validity of the functional response patterns first shown by Allden & Witthaker (1970), confirmed by Penning et al. (1998) for temperate climate grasslands, and recently reported in several studies on pastures based on tropical and subtropical C4 grasses, as reviewed by Da Silva & Carvalho (2005).
Supplementation under these almost-steady conditions often results in substitution effects strictly related to PH or HM, as shown by Molle et al. (2008a) for lactating sheep grazing Italian ryegrass and supplemented with 500 g/d of maize per head. This is often associated with shorter grazing time, as shown by Bremm et al. (2008) in meat sheep grazing Italian ryegrass in Brazil.
Interestingly, in intake regression models from several studies on sheep grazing under continuous variable stocking across different production systems, the variables worth retaining to explain HI were the pasture variables used as a gauge of sward “state”, usually PH and HM. This probably occurs because these variables are highly correlated with other variables related to either pasture (e.g., CP content, NDF and digestibility) or herbivore characteristics (BW, average daily gain of growing sheep and milk yield). This outcome is common when pasture composition and structure are homogeneous and change little with time, as is the case when a steadily high-grazing pressure is exerted on actively-growing pastures. Under this setting, ewes of the same group probably tend to behave as one
mob, i.e., variability between animals within group is limited. In contrast, if grazing pressure is low enough to allow for increased heterogeneity, with overgrazed patches intermingled with undergrazed ones, variability between co-grazing animals increases. Intake then becomes more related to factors other than herbage availability, such as those associated with animal requirements (e.g., average daily gain and milk yield) and forage ingestibility (e.g., NDF content and digestibility).
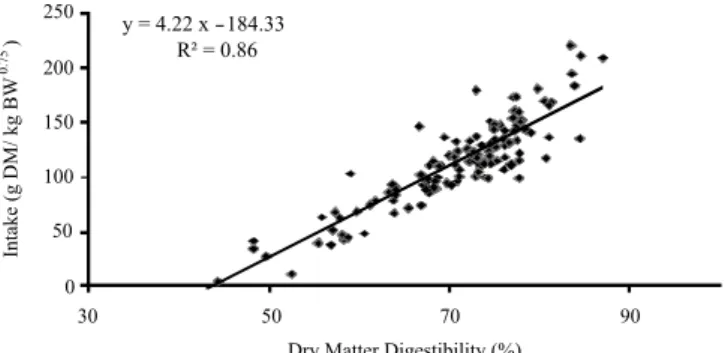
Results of recent studies have re-evaluated the use of regression models based on forage chemicals, such as NDF or digestibility estimates, to predict intake of sheep and other herbivores. Molle et al. (2008b) performed a meta-analysis of a database of intake measurements from different trials carried out in the UK, France and Sardinia (Italy) on unsupplemented sheep grazing different grass-legume mixtures under rotational or set stocking management. The authors found a strict relationship between HI scaled by
metabolic weight and in vivo DM digestibility measured by
the n-alkane method (Figure 2).
This model can provide a first assessment of the level of intake when HM and PH are above the expected limiting thresholds and pasture is composed of mixtures of grass
and legumes. Unfortunately, in vivo digestibility of grazing
animals can be hardly predicted in experimental stations. Nevertheless, this difficulty can be overcome by the implementation of the fecal NIRS technique, as suggested by Landau et al. (2006) or by regression equations (e.g., Peripolli et al., 2011). McPhee & Hegarty (2008) have recently published a model aimed at estimating DMI, energy intake or OM intake in grazing herbivores, including sheep and goats, on the basis of forage composition and rumen parameters. However, none of the tested inputs was sufficiently accurate to estimate metabolizable energy
Each point (n = 132) is the mean of 3 sheep data (elaborated from Molle et al., 2008b).
Figure 2 - Relationship between dry matter intake and in vivo DM digestibility in sheep (dairy and meat breeds) grazing grass-legume mixtures in Italy, France and the UK.
y = 4.22 x - 184.33
R² = 0.86
0 50 100 150 200 250
30 50 70 90
Dry Matter Digestibility (%)
Intake
(g
DM/
kg
BW
)
intake. Other models gave better results in terms of DMI estimates (Meissner & Paulsmeier, 1995), but they have not been validated under grazing or browsing conditions, to our knowledge.
Browsing goats
Goats are intermediate feeders which opportunistically change their grazing behavior according to seasonal forage availability. The physical characteristics that allow goats to adapt their feeding behavior to highly diversified plant communities, such as shrublands, are reviewed by Decandia et al. (2008).
The difficulty in estimating intake in these pasture conditions is represented by the lack of correlation between bite mass and bite quality. In fact, goats grazing on woody vegetation select their diet by adopting criteria that differ from the above mentioned flavor-feedback interaction basis. The presence of thorns limits the intake of tender leaves and shoots, and often induces goats to assume the bipedal stance. This, in turn, can reduce eating in favor of searching activity, thus making it difficult for animals to reach adequate intake levels (Papachristou et al., 2005; Jouven et al., 2010). Moreover, in woody vegetation numerous plants contain moderate-to-high levels of toxic secondary metabolites (tannins, terpens, alkaloids). The learned post-ingestive effects drive animals to select or discard different plant species, in order to avoid or at least limit the discomfort caused by these secondary compounds (Provenza, 1995), further reducing eating activity.
As expected, literature on the intake estimation for browsing goats is scantier than that for sheep grazing herbaceous pastures. Indeed, such task is more challenging, because goats have the ability to explore vegetation layers which differ from each other for many reasons, including: physical structure, chemical composition and spatial distribution along the three dimensions. Despite that, some attempts have been made to set up local predictive intake models for goats based on regression equations. In Sardinia (Italy), a database was created on the basis of experiments carried out on supplemented Sarda dairy goats, a hardy local breed, browsing a bushland based on
lentisk (Pistacia lentiscus) and oaks for approximately
7 h/d (Decandia et al., 2005). Of the set of regressions obtained in that study, the best fitting was reached with the following equation:
DMI (g/kg BW0.75) = −18.63 + 6.75 CP (% DM) + 0.02
FCM (g/d), n = 38, R2 = 0.77, P<0.001,
where FCM is 4% fat-corrected milk (Sandrucci et al., 1995). The same authors estimated dietary CP content by the following regression:
CP (% DM) = 5.10 + 0.20 HSC (% of point quadrat
contacts) + 0.119 MU (mg/100 mL), n = 31, R2 = 0.82,
P<0.001,
where HSC is the contribution of herbaceous species to the available pasture assessed by the point quadrat method (Daget & Poissonet, 1969) and MU is the milk urea content.
When the proportion of grass and forbs is high in relation to the total biomass available, usually during winter and spring months, grazing often overcomes browsing even in hardy goat breeds (Decandia et al., 2008; Hakyemez et al., 2009), thus increasing the dietary content of CP. This is mirrored by a relatively high MU, because grass leaves are rich in protein and are tannin-free. Contrarily, during summer and autumn, the contribution of browsing to goat diets increases, with a lowering effect of tannins on CP intake and CP digestibility.
To conclude, the above equations provide general guidelines for the tactical management of lactating goat herds on mixed grass-bush vegetation in areas where bushland consists mainly of lentisk.
Conclusions
Modeling feed intake in small ruminants is a huge and fundamental field of research. The most relevant prediction models, especially empirical ones, among those published in the last 30 years, were selected and compared.
account the relationship between metabolic and physical control of intake. This would require the development of reference values for optimal fiber levels at various target production levels. In contrast to cattle, this information is lacking for small ruminants and very few attempts have been made to develop it.
For grazing sheep and browsing goats, several empirical intake estimation models have been developed so far thanks, as stated by Poppi (1996), to “the quick dirty method of associative relationships”, even if their relevance is mainly limited to the “local production system” they stem from. In fact, out of the boundaries of the studied systems, the accuracy of estimates based on empirical models becomes unacceptably low, with differences between estimated and actual values greater than ±10%. In contrast, mechanistic models can provide more sound generalizations, if based on biologically relevant causal relationships. In dynamic models, these relationships consist of flows and feedback loops between biological compartments. Unfortunately, despite some encouraging results (Herrero et al., 2000), the quantification of the modeled flow rates still needs more research efforts.
To conclude, we would like to paraphrase and adjust the above quoted statement of Poppi by declaring the following: the dirtiest job in animal science, that is, running feeding experiments to test relevant hypotheses, is still needed in the area of small ruminant-feed interplay. However, this dirty job should be developed within appropriate mechanistic biological and theoretical frameworks.
References
AGRICULTURAL AND FOOD RESEARCH COUNCIL - AFRC.
Nutritive requirements of ruminant animals: energy. Technical Committee on Responses to Nutrients, Report Number 5. Nutrition Abstracts and Reviews (Series B), v.60, n.10, p.729-804, 1990.
AGRICULTURAL AND FOOD RESEARCH COUNCIL - AFRC. Energy and protein requirements of ruminants. An advisory manual prepared by the AFRC Technical Committee on Response to Nutrients. Wallingford, UK: CAB International, 1995. 159p.
AGRICULTURAL AND FOOD RESEARCH COUNCIL - AFRC. The
nutrition of goats. New York, NY: CAB International, 1998. 118p.
ALDERMAN, G. Provisional nutrient standards for goats. ADAS Science Service, Nutrition Chemistry International Technical Memorandum, 1982.
ALLDEN, W.G.; WHITTAKER, I.A.McD. The determinants of herbage intake by grazing sheep: the interrelationship of factors influencing herbage intake and availability.Australian Journal of Agricultural Research, v.21, n.5, p.755-766, 1970.
ALLEN, M.S.; BRADFORD, B.J.; OBA, M. Board invited review: The hepatic oxidation theory of the control of feed intake and its application to ruminants. Journal of Animal Science, v.87, n.10, p.3317-3334, 2009.
ALLEN, V.G.; BATELLO, C.; BERRETTA, E.J. et al. An international terminology for grazing lands and grazing animals. Grass and Forage Science, v.66, n.1, p.2-28, 2011.
ARAUJO, R.C.; PIRES, A.V.; SUSIN, I. et al. Milk yield, milk composition, eating behavior, and lamb performance of ewes fed diets containing soybean hulls replacing coastcross (Cynodon species) hay. Journal of Animal Science, v.86, n.12, p.3511-3521, 2008.
AVONDO, M.; BORDONARO, S.; MARLETTA, D. et al. A simple model to predict the herbage intake of grazing dairy ewes in semi-extensive Mediterranean systems. Livestock Production Science, v.73, n.2-3, p.275-283, 2002.
AVONDO, M.; LUTRI, L. Feed intake. In: PULINA, G. (Ed.) Dairy sheep nutrition. Wallingford, UK: CAB International, 2004. p.65-77.
AVONDO, M. Prediction of feed intake in the Italian dairy sheep. Italian Journal of Animal Science,v.4, Suppl.1, p.35-44, 2005. BAILE, C.A.; DELLA-FERA, M.A. Nature of hunger and satiety
control systems in ruminants. Journal of Dairy Science, v.64, n.6, p.1140-1152, 1981.
BARTHRAM, G.T.; GRANT, S.A. Defoliation of ryegrass-dominated swards by sheep. Grass and Forage Science, v.39, n.3, p.211-219, 1984.
BAUDRACCO, J.; LOPEZ-VILLALOBOS, N.; HOLMES, C.W. et al. e-Cow:an animal model that predicts herbage intake, milk yield and live weight change in dairy cows grazing temperate pastures, with and without supplementary feeding. Animal, v.6, n.6, p.980-993, 2012.
BAUMONT, R.; PRACHE, S.; MEURET, M. et al. How forage characteristics influence behaviour and intake in small ruminants: a review. Livestock Production Science, v.64, n.1, p.15-28, 2000.
BAUMONT, R.; COHEN-SALMON, D.; PRACHE, S. et al. A mechanistic model of intake and grazing behaviour in sheep integrating sward architecture and animal decisions. Animal Feed Science and Technology, v.112, n.1-4, p.5-28, 2004.
BEAR, M.F.; CONNORS, B.W.; PARADISO, M.A. Neuroscience: exploring the brain. 3.ed. Philadelphia, PA: Lippincott Williams & Wilkins, 2007. 857p.
BREMM, C.; SILVA, J.H.S.; ROCHA, M.G. et al. Comportamento ingestivo de ovelhas e cordeiras em pastagem de azevém-anual sob níveis crescentes de suplementação. Revista Brasileira de Zootecnia, v.37, n.12, p.2097-2106, 2008.
BROBECK, J.R. Neural control of hunger, appetite and satiety. The Yale Journal of Biology and Medicine, v.29, n.6, p.565-574, 1957.
BURLISON, A.J.; HODGSON, J.; ILLIUS, A.W. Sward canopy structure and the bite dimensions and bite weight of grazing sheep. Grass and Forage Science, v.46, n.1, p.29-38, 1991.
CAJA, G.; BOCQUIER, F.; FERRET A. et al. Capacité d’ingestion des ovins laitiers: Effets des principaux facteurs de variation. Options Méditerranéennes, Serie B, Etudes et Recherches, n.42, p.9-36, 2002.
CAMERON, N.D. Genetic relationships between growth and food intake in performance tested ram lambs: An investigation of variance component estimation procedures. Journal of Animal Breeding and Genetics, v.105, n.1-6, p.431-440, 1988.
CAMMACK, K.M.; LEYMASTER, K.A.; JENKINS, T.G. et al. Estimates of genetic parameters for feed intake, feeding behavior, and daily gain in composite ram lambs. Journal of Animal Science, v.83, n.4, p.777-785, 2005.
CANNAS, A. Feeding of lactating ewes. In: PULINA G. (Ed.) Dairy sheep nutrition. Wallingford, UK: CAB International, 2004. p.79-108.
CANNAS A.; TEDESCHI, L.O.; FOX, D.G. et al. A mechanistic model for predicting the nutrient requirements and feed biological values for sheep. Journal of Animal Science, v.82, n.1, p.149-169, 2004.