MAYARA MORENA DÉL CAMBRE AMARAL WELLER
GENE EXPRESSION IN CATTLE REPRODUCTIVE ORGANS AND MAMMARY GLAND
Thesis presented to the Genetics and Breeding Graduate Program of the Universidade Federal de Viçosa, in partial fulfillment of the requirements for degree of Doctor Scientiae.
VIÇOSA
Fichi citilográfici prepiridi peli Biblioteci Centril di Universidide Federil de Viçosi - Câmpus Viçosi
T
Weller, Mayara Morena Del Cambre Amaral, 1987-W448g
2016 mammary gland / Mayara Morena Del Cambre AmaralGene expression in cattle reproductive organs and Weller. - Viçosa, MG, 2016.
ix, 119f. : il. (algumas color.) ; 29 cm.
Orientador : Simone Eliza Facioni Guimarães. Tese (doutorado) - Universidade Federal de Viçosa. Inclui bibliografia.
1. Bovino - Genética. 2. Nutrição animal. 3. Regulação de expressão gênica. 4. Bovino - Reprodução.
I. Universidade Federal de Viçosa. Departamento de Zootecnia. Programa de Pós-graduação em Genética e Melhoramento. II. Titulo.
AGRADECIMENTOS
A DEUS, pela presença em todos os dias da minha vida por me dar perseverança e confiança para sempre seguir a diante.
Aos meus pais e noivo, pelo carinho e apoio incondicional.
À Universidade Federal de Viçosa e ao Programa de Pós graduação em Genética e melhoramento pela oportunidade de realização de mais uma importante etapa da minha vida.
Ao Conselho Nacional de Desenvolvimento Científico e Tecnológico (CNPq) pela concessão da bolsa de estudo.
À minha orientadora, Professora Simone Eliza Facioni Guimarães, que desde a iniciação científica sempre me deu grande apoio e tem me auxiliado na busca do conhecimento e pela orientação, confiança e amizade.
Ao meu coorientador, Marcos Inácio Marcondes pela essencial colaboração e pelas importantes sugestões para a realização deste trabalho.
A toda a equipe do LABTEC, pela agradável convivência em grupo. À minha madrinha e ao meu tio Roberto pelo incentivo e carinho. Aos membros da banca de defesa.
BIOGRAFIA
Mayara Morena Dél Cambre Amaral Weller, filha de Ailton Alves Weller e Remy Gomes do Amaral, nasceu em 4 de abril de 1987 em Cachoeiro de Itapemirim, Espirito Santo, Brasil.
No 2005, iniciou o curso de Zootecnia, pelo Departamento de Zootecnia da Universidade Federal de Viçosa, em Viçosa, MG, onde foi bolsista de iniciação científica, acompanhando e conduzindo pesquisas junto ao Programa de Melhoramento Genético de Suínos do Departamento de Zootecnia da UFV.
Em janeiro de 2010, graduou-se em Zootecnia, pela Universidade Federal de Viçosa. Em março do mesmo ano, iniciou o Mestrado pelo Programa de Pós-Graduação em Genética e Melhoramento Animal da Universidade Federal de Viçosa.
Em 16 de fevereiro de 2012, submeteu-se ao exame final de defesa de dissertação para obtenção do título de Magister Scientiae em Genética e Melhoramento, na Universidade Federal de Viçosa.
Em março de 2012, iniciou o curso de Doutorado em Genética e Melhoramento na Universidade Federal de Viçosa.
SUMÁRIO
RESUMO... v
ABSTRACT... viii
GENERAL INTRODUCTION... 1
CHAPTER I (Article I)... 3
INTRODUCTION... 6
MATERIAL AND METHODS...7
RESULTS... 16
DISCUSSION... 19
CONCLUSIONS... 27
ACKNOWLEDGMENTS... 28
REFERENCES... 28
CHAPTER II (Article II)... 53
ABSTRACT... 54
INTRODUCTION... 55
MATERIALS AND METHODS...56
RESULTS... 63
DISCUSSION... 66
CONCLUSIONS... 72
REFERENCES... 72
CHAPTER III (Article III)... 89
ABSTRACT... 90
BACKGROUND... 92
RESULTS... 94
DISCUSSION... 95
CONCLUSION... 100
METHODS... 101
AUTHOR´S CONTRIBUTIONS...106
ACKNOWLEDGMENTS... 106
REFERENCES... 106
RESUMO
WELLER, Mayara Morena Dél Cambre Amaral, D. Sc, Universidade Federal de Viçosa, fevereiro de 2016. Expressão gênica em órgãos reprodutivos e glândula mamária em bovinos. Orientadora: Simone Eliza Facioni Guimarães. Coorientador: Marcos Inácio Marcondes.
ABSTRACT
GENERAL INTRODUCTION
Maternal nutrition during pregnancy plays a critical role in the postnatal growth often leading to developmental programming. The resultant changes in phenotypes can enhance susceptibility to diseases in adult offspring (Symonds and Budge, 2009; Williams et al., 2014) such as type 2 diabetes (Jones and Ozanne, 2009; Portha et al., 2011), hypertension (Ingelfinger and Nuyt, 2012) and obesity (Parlee and Macdougald, 2014). Recently, the concept has been broadened and encompasses the effect of maternal nutrition on pre- and postnatal on offspring reproductive capacity (Chadio and Kotsampasi, 2014; Chavatte-Palmer et al, 2014; Zambrano et al., 2014)
So far, the majority of data refer to effects of maternal undernutrition imposed during gestation (Lea et al., 2006; Mossa et al., 2009), whereas only few studies have examined the impact of maternal overnutrition on reproductive organs. For example, recent data in rabbits showed that maternal high-fat diet induced follicular apoptosis in their offspring, regardless of post-natal diet (Leveillé et al., 2014). Maternal high-fat nutrition in rats resulted in early pubertal onset (Sloboda et al., 2009; Connor et al., 2012). Considering these previous results, it is reasonable to speculate that the maternal overnutrition during mid and late-gestation impact on fetal pituitary-gonadal development.
because the GH-IGF axis is essential for normal growth and mammary development they likely mediates tissue growth responses to nutrient intake (Breier, 1999; Purup et al., 2000a,b). Some components of this axis was implicated as mediators of inhibited mammary growth in heifers fed elevated levels of nutrients (Weber et al., 1999, 2000; Berry et al., 2003), but not in another (Meyer et al., 2007).
CHAPTER I (Article I)
Interpretative summary
Maternal nutrition changes gene expression, ovarian and testicular development in cattle fetus
Weller
This study has shown that higher maternal nutrition can influence fetal ovarian follicular numbers and alter testicular structure which in turn may affect their reproductive performance after birth. Higher levels of feeding also altered the expression of key genes involved in ovarian folliculogenesis, steroidogenesis, apoptosis and growth factors. The implication of these results is that maternal nutrition may impact on offspring reproductive performance of dairy cattle and should be managed precisely.
EFFECT OF MATERNAL NUTRITION ON GONADAL DEVELOPMENT Effect of maternal nutrition and days of gestation on pituitary gland and gonadal
gene expression in cattle
M. M. D. C. A. Weller*§†, M. R. S. Fortes†, M. I. Marcondes*, P. P. Rotta*, T. R. S. Gionbeli*, S. C. Valadares Filho*, M. M. Campos‡, F. F. Silva*, W. Silva*, S. Moore§
and S. E. F. Guimarães*1
*Animal Science Department, Universidade Federal de Viçosa, 36570-000, Viçosa, MG,
Brazil.
†School of Chemistry and Molecular Biosciences, the University of Queensland,
Brisbane, 4067.
‡Embrapa Gado de Leite, Juiz de Fora, Brazil 36038-330.
§Queensland Alliance for Agriculture and Food Innovation, Center for Animal Science, the University of Queensland, Brisbane, 4062.
1Corresponding author: Simone Eliza Facioni Guimarães, Ph Rolfs avenue, Viçosa,
INTRODUCTION
Maternal nutrition status has been considered as a major cause of developmental programming. The resultant changes in phenotypes can enhance susceptibility to diseases in adult offspring (Symonds and Budge, 2009; Williams et al., 2014) such as type 2 diabetes (Jones and Ozanne, 2009; Portha et al., 2011), hypertension (Ingelfinger and Nuyt, 2012) obesity (Parlee and Macdougald, 2014) and alterations in offspring reproductive function (Chadio and Kotsampasi, 2014; Chavatte-Palmer et al, 2014; Zambrano et al., 2014)
al., 2015). Moreover, Long et al., 2012 reported that maternal obesity altered hypothalamic-pituitary-adrenal function in rat offspring.
Considering these previous results, we hypothesized that the maternal overnutrition during mid and late-gestation impact on fetal pituitary-gonadal development. The objectives of this present study were to determine (1) whether maternal overnutrition alters gonadal germ cell development; and (2) whether maternal overnutrition affects gonadal and pituitary gland gene expression in cattle fetuses at mid and late gestation. In this context, we examined fetal pituitary gonadotropin gene expression and gonadal expression of candidate genes. In female fetuses, we evaluated the expression pattern of key genes involved in ovarian folliculogenesis (ESR-α, FHSR, BMPR2, GDF9, TGFBR1, and TGFB1), steroidogenesis (StAR and P450arom) and anti- or pro-apoptotic factors (Bax, Bcl2, and CASP3). In male fetuses, we evaluated the expression pattern of key genes involved in testis development and function (AR, LHCGR, IGF1, IGFR1, IGF2, StAR and HSD17B3), as well as apoptotic factors (Bax, Bcl2, and CASP3).
MATERIAL AND METHODS
Experimental design and Animal management
Unsuckled multiparous crossbreed (Holstein x Gyr) cows (n = 62) had their estrus cycles synchronized for the experiment. Estrus synchronization protocol used a vaginal progesterone insert (CIDR, Zoetis, Madson, NJ) for 7 d and with a PGF2α injection (25 mg, Lutalyse, Zoetis, Madson, NJ) was administered at CIDR removal. Cows were monitored for estrus every 12 h and were artificially inseminated using semen from a single bull 12 h after the onset of estrus. On day 40 of gestation, cows were housed in 30 m2 individual pens, of which 8 m2 were covered with concrete flooring. Pens had individual feed bunks and an automatic water system. On day 55 of gestation, the pregnancy was verified, fetal sexing was performed by using transrectal ultrasound (Aloka 500 with a 5-MHz linear probe Aloka, Wallingford, CT), and 27 pregnant cows were randomly selected from the 62 for this experiment. The nutritional regimes were provided from day 60 of gestation until cows achieved their previously designated days of gestation (DG), when they were euthanized for sampling.
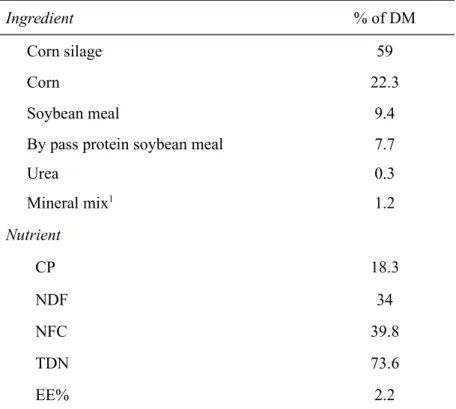
gestation period. High level was designed to meet 190% of requirements for maintenance as reported by our research group Rotta et al. (2014). Cows fed Ad libitum (H) were considered obese in this current study; because H cows had an average daily gain about 3.8 times greater than M intake cows. Also cows fed Ad libitum had an increased rib fat thickness during gestation, whereas M intake cows had a constant amount of rib fat thickness (for details on weight and fat measurements see Rotta et al., 2014). All cows were fed corn silage and concentrate based diet at a ratio of 93:7 on a DM basis as a total mixed ration twice daily, with 60% of the amount offered in the morning and 40% in the afternoon feeding (dry matter basis). All cows had ad libitum access to water. The composition of the experimental diet is presented in supplementary data (TS1).
To evaluate the effects of different days of gestation (DG) on pituitary-gonadal developments of female and male fetuses, pregnant cows were euthanized at selected time points. Six cows from either H or M intake carrying female fetuses were randomly divided for euthanasia at 199 and 268 days of gestation. The four groups of treatments therefore comprised of: H-199DG, M-199DG, H-268DG and M-268DG with 3 cows for each treatment. Six H and nine M intake cows carrying male fetuses were randomly divided for euthanasia at 139, 199 and 241 DG. The six groups of treatments thus comprised of: H-139DG, M-139DG, H-199DG, M-199DG, H-241DG and M-241DG with 2 cows from H and 3 cows from M intake for each DG.
150 DG and antral follicles are first seen in bovine fetal ovaries aged 230 DG (Erickson et al., 1966; Chavette-Palmer et al., 2014). Thus, at 199 DG initial follicullogenesis and apoptosis would have occurred, but no antral follicles would be present. In male fetuses, we evaluated at 139, 199 and 241 DG because the respective time points represent the mid and late stage of gestation where testicular architecture becomes more differentiated, the proliferation of pre-espermatogonia arrest at day 200 DG (Wrobel 2000) and from 210 to 285 DG the interstitium greatly expands while the number of fetal Leydig cells are reduced (Abd-Elmaksoud, 2005). Therefore, we hypothesized that the maternal nutrition could affect these important events during ovarian and testicular development.
Euthanasia procedures were performed on the same calendar day for each DG. Feed was withheld overnight, but cows had ad libitum access to water. Cows were euthanized at Universidade Federal de Viçosa by stunning with a captive bolt and subsequent exsanguination. The gravid uterus was sectioned at the cervix, and the fetuses were immediately removed and weighed. As soon as possible after euthanasia, the reproductive organs and pituitary gland of fetuses were removed and the reproductive organs weighted.
Gonadal histology
Left ovaries and testis were sliced crosswise in 3 mm thick blocks, which were dehydrated in increasing concentrations of ethanol (70ºC, 95ºC and 100ºC), cleared in xylene and embedded in paraffin wax. Paraffin embedded blocks were sectioned serially at 5 µm thick slices and stained with Haematoxylin–Eosin for examination of germ cell development. An average of 30 gonadal sections was examined per fetus. After qualitative evaluation of the slides, images of stained ovarian sections were retrieved from a video camera linked to light microscope (EVOS® XL Core Cell Imaging System, life technologies) at magnification of 40 X and these images were analyzed with ImageJ® 1.48 software (National Institutes of Health, Bethesda, Maryland, USA). The width of the cortical layer was measured at x 20 magnification.
the nuclear diameter and thickness of the cut, as described by Gougeon and Chainy, (1987) and the following formula:
Where: dm = nuclear diameter.
After qualitative evaluation of the slides, images of testicular parenchyma were retrieved from a video camera linked to light microscope (EVOS® XL Core Cell Imaging System) and were analyzed with Image J®1.48 software (National Institutes of Health) at magnification of 40 X (Figure 2). Testicular volume of bovine fetuses was equal to fresh left testis weight (g), assuming testicular density is 1 (Russell et al. 1990). The volumetric proportion of testicular parenchyma components was measured by counting points. Twenty randomly selected fields per fetal testis were used. Briefly, a grid of 450 evenly distributed test points was superimposed over the screen image of every microscopic field studied. In each fetus, the number of test points overlying the component of interest (seminiferous cords or interstitium) was counted. The volumetric proportions, described in percentages, were calculated based on a total of 9000 points per fetus.
The diameter of the seminiferous cords was estimated as average value of measuring two perpendicular diameters (maximum and minimum) from 30 randomly chosen cross-sections of seminiferous cords per testis. Seminiferous cords were assumed to be cylindrical and their lengths were estimated as described by Marshall and Plant, (1996) in the following formula:
Vs = (volumetric proportionof seminiferous cords) x (testicular volume)
Quantitative real-time Transcription dCR analysis
Total RNA was isolated from 50 mg of right ovaries and testicles by using RNeasy Mini Kit (Qiagen) according to the manufacturer's recommendations. Additional treatment with DNase was performed on the columns using the RNase-free DNase Set (Qiagen), according to the manufacturer’s recommendations. RNA concentrations were checked by NanoVue Plus Spectrophotometer (GE Healthcare) with an optimal 260/280 ratio between 1.8 and 2.1. Intact 28S and 18S rRNA subunit integrity was assessed by agarose gel electrophoresis to detect degradation of the RNA.
Reverse transcription was performed using GoScript Reverse Transcription System (Promega) and oligo (dT) primers (Invitrogen, Carlsbad, CA). The cDNA concentrations from the samples were estimated on a NanoVue Plusspectrophotometer (GE Healthcare). Finally, the cDNA samples were stored at –20ºC for analysis.
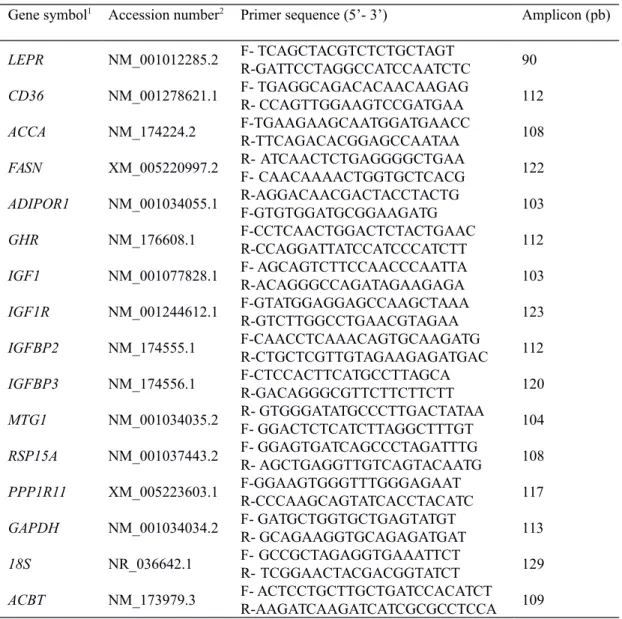
using geNorm program (Vandesompele et al., 2002). GAPDH and B2m had M = 0.3 versus β-actin and Ubiquitin C with M=0.8. The primer pairs of each target and reference genes are listed in Table 2.
Quantitative real-time PCR (qRT-PCR) reactions were performed in different wells and in duplicates using SYBR Green detection with GoTaq PCR Master Mix (Promega) following the manufacturer’s instructions in an ABI Prism 7300 Sequence Detection System thermocycler® (Applied Biosystems). The reaction consisted of an initial step at 95ºC for 10 minutes, a second step of 40 cycles with the same temperature for 15 seconds and a final extension step at 60ºC for 60 seconds. After the amplification cycles, an additional gradient step from 60ºC to 95ºC was used to obtain a melting curve. The measurement in qRT-PCR experiment is expressed in cycles to threshold (Ct) of
PCR; a relative value that represents the cycle number at which the amount of amplified cDNA reaches the threshold level. Prior to quantification by qRT-PCR, the amplification efficiency and optimal primer concentration was determined for each gene using serial dilution of cDNA. The PCR efficiencies for all primers pairs were obtained using the formula E = 10(-1/slope) ×100, where E is efficiency and slope is the gradient of dilution
series and are summarized in Table 2.
Statistical Analysis
procedures (SAS Inst. Inc., Cary, NC). Day of gestation, maternal intake and their interaction were included as fixed effects in the model. Means were compared by the test of Tukey to the level of 5%.
Statistical analysis of Ct data for each fetal sex was realized using
%QPCR_MIXED macro [https://www.msu.edu/~steibelj/JP files/QPCR.html] developed to generate codes in SAS PROC MIXED suitable to analyze data from qRT-PCR, assuming independent random effects for reference and target genes in each biological replicate (Steibel et al., 2009). This statistical method is more accurate, powerful and flexible than existing alternatives for analysis of relative quantification qRT-PCR data (Steibel et al., 2009). The following model was used:
ygikr = TGgi+ Cgik+ Dik + egikr
where, ygikrcorresponds to the Ct value obtained from the thermocycler software
for the gth gene (reference or targets) from the rth well, which corresponds to the kth animal submitted to the ith treatment (days of gestation and maternal intake combination). TGgiis the effect of the ith treatment on the expression of gene g; Cgik~
N(0, ) is the gene-specific random effect of the kth animal;Dik ~ N(0, ) is the
sample-specific random effect (common to reference and target genes); and egikr~ N(0, ) is the
residual term.
Relative mRNA abundance (fold change) were estimated using the 2-ΔCt method
results for each pairwise contrast of interest across treatments are shown in the supplementary data (TS2 and TS3). To validate our gene expression results facing the limited sample size, permutation test–based p-values (TS2 and TS3) were calculated using 1,000 resampling (Manly, 1997; Sun et al., 2014). These permutations were performed by shuffling Ct values from different treatments, maternal intake and days of gestation, separately within each gene. These analyses confirmed the consistence of our qRT-PCR results. Analogously, the mentioned permutation tests were also applied to fetal reproductive organs weight and histological data analysis (TS4) and have also confirmed the significant statistical results. Despite of that, the authors suggest the use of larger sample sizes in future research.
RESULTS
Fetal growth and gonadal development
Fetal and reproductive organs weights in females and males are presented in Table 2 and Table 3, respectively. Irrespective of the sex of fetuses, there was no effect of maternal intake on fetal or reproductive organ weights and no interaction between maternal intake and days of gestation (DG). In contrast, there was DG effect on fetal, reproductive organs, ovarian and testicular weights as expected due to normal fetal growth during gestation.
appeared to be a tendency for the number of primary follicles to increase (P = 0.062) with fetal age corresponding to DG. We did not observe interaction between maternal intake and DG on primordial (P = 0.620), primary (P = 0.951), preantral (P = 0.688) and antral (P = 0.551) follicle numbers (Table 2). Primary (P = 0.044), preantral (P = 0.041) and antral follicles (P = 0.038) numbers were higher in fetal ovaries derived from H intake cows, with no interaction between maternal intake and DG. Moreover, DG affected preantral (P = 0.036) and antral follicles (P = 0.048) numbers as these were higher at 268 DG.
Maternal nutrition affected diameter (P = 0.034), lengths (P = 0.042) and volumetric proportion of seminiferous cords (P = 0.035) but no effect of interaction between maternal intake and DG was detected. Diameter and length of seminiferous cord did not differ (P = 0.446; P = 0.524, respectively) with DG (Table 3). Moreover, volumetric proportion of seminiferous cords was decreased (P = 0.045) with DG whereas interstitium volumetric proportion was higher (P = 0.034) at 199 and 241 compared to 139 DG (Table 3).
Fetal pituitary LHβ and FSHβ gene expression
observed interaction (P = 0.008) between maternal intake and DG on FSHB gene expression in female fetuses. FSHB expression was higher (P < 0.01) at 268 than at 199 DG in female fetuses from both maternal intake groups (Figure 3).
FSHB gene expression levels were similar between maternal intake in fetal pituitary of males (P = 0.59), with effect of DG (P = 0.012) and no significant interaction between maternal intake and DG (P = 0.42). As observed for FSHB, no difference in LHB gene expression levels (P = 0.25) was detected between maternal intake groups, but there was (P = 0.001) an effect of DG. The expression level of FSHB and LHB were higher (P < 0.01) at 199 and 241 compared to 139 DG in male fetuses from both maternal intake groups (Figure 4).
Fetal ovary gene expression
Maternal nutrition altered ovarian P450arom, StAR, BMPR2, TGFBR1, GDF9, FSHR, Bax and CASP3 expression levels. Ovarian fetuses from H intake cows had higher (P < 0.05) expression of these genes compared to M intake cows, at 199 and 268DG (Figure 5). The gene expression levels of P450arom and StAR were higher (P < 0.01) at 268 than 199 days of gestation in both maternal intake groups. In contrast, CASP3 and Bax genes had greater (P < 0.001) values at 199 compared to 268 DG in both maternal intake groups (Figure 5).
Maternal nutrition altered testicular expression of StAR and HSD17B3 genes. Fetuses from M intake cows had higher expression (P < 0.01) of these genes compared to H intake cows at 139 and 199 DG (Figure 6). As observed for expression of key steroidogenic enzymes, IGF1, IGF2 and IGF1R genes had greater expression in fetal testis derived from M intake than H intake cows, irrespective of DG. Moreover, testicular expression of IGF1, IGF2 and IGF1R were higher at 139 than at 199 DG and at 241 than at 199 DG, in both maternal intake groups (Figure 6).
DISCUSSION
The effects were not accompanied by changes in fetal body weights, reproductive organ and gonad weights, since weights were not affected by maternal nutrition and reinforce the concept that maternal nutrition can affect fetal development independently of changes in fetal weight or in organ mass (Harding and Johnston, 1995; Hawkins et al., 2000). The effects might persist until adulthood according to literature evidence in other species (Bernal et al., 2010; Connor et al., 2012; Guzmán et al., 2014) and should be the focus of future research in cattle. Our data point to distinct effects of maternal overnutrition according to the fetus´ sex.
Effects of maternal nutrition on fetal pituitary gland
In our study, maternal H intake was associated with enhanced expression of FSHB gene in the pituitary gland of female fetuses. We observed expression FSHB was higher at 199 and 268 DG in female fetuses from H intake cows, which indicates that the FSHB expression may be affected by timing of maternal over nutrition. This supports the study by Rhind et al. (2001), which showed development of the hypothalamic-pituitary axis and the synthesis of gonadotropins can be sensitive to pre-natal nutrition in sheep fetus. By contrast, the expression of FSHB in the pituitary gland of male fetuses in our study was similar between H and M intake groups which suggest that gonadotroph cells of male and female fetuses respond differently to maternal nutrition. There was no effect of maternal intake on LHB gene expression in both fetal sexes, which suggests that this hormone is not involved in the observed nutritionally induced changes in ovarian and testis development during the gestational period evaluated.
Effects of maternal nutrition on fetal gonads
Increased ovarian FSHR and pituitary FSHB expression may also positively impact on preantral and antral follicular numbers. The hormone FSH and its receptor FSHR play an important role in follicle progression from primary to advanced stages of follicular development (Richards, 1994). Our results are consistent with previous studies where FSH and its receptor stimulated follicular growth in bovine fetuses’ ovaries (Bao et al., 1997; Tanaka et al., 2001). The emerging hypothesis from our study is that maternal over nutrition may trigger increased pituitary expression of FSHB and increased ovarian expression of FSHR with consequence to folliculogenesis, observed as increased numbers of preantral and antral follicles.
expression was correlated with follicular atresia. Moreover, studies in mouse fetal ovary showed that apoptosis of germ cells is correlated with increased levels of Bax in the absence of any change in Bcl2 levels (Felici et al., 1999). It is possible that the maternal overnutrition could lead to oxidative stress resulting in greater loss of germ cells and follicles during gestation, which in turn may reduce ovarian reserve and subsequent fertility in their offspring.
No changes in ERα expression levels were observed. However, the expression of the P450arom and StAR gene was higher in fetuses’ ovaries from H than M intake cows. The enzyme StAR is a rate-limiting enzyme in steroidogenesis (Lin et al., 1995). The enzyme P450arom catalyzes the conversion of androgens to estrogens (Meinhardt and Mullis, 2002), and it is found in granulosa cells of primary, preantral and antral follicles in fetal bovine ovaries at 190DG (Burkhart et al., 2010). Up-regulation of the P450arom and StAR genes could be the factor in the increment of primary, preantral, and antral follicle numbers in fetuses from H intake cows. This observation corroborate early studies that reported estrogens regulated early follicular growth (Britt et al., 2000; Drummond et al., 2002) and have a direct effect on the number and size of ovarian follicles (Nayudu and Osborn, 1992; Hulshof et al., 1995).
The IGF-1 plays a major role in the proper development and function of the testis (Baker et al., 1996; Froment et al., 2004; Griffeth et al., 2014), and it is produced by Leydig, Sertoli, and germ cells; and IGF1R is found in the germ cells and somatic testicular cells in human and rats (Vannelli et al., 1988; Cailleau et al., 1990). Pitetti et al (2013) have reported that inactivation of IGF1R in mouse pre-Sertoli cells reduced its proliferation during late gestation, which resulted in 79% reduction in daily sperm production in adulthood. Our results suggest that lower expression of IGF1, IGF2 and IGF1R receptor genes in fetal testis from H intake cows could explain detrimental changes in testicular structure. Less seminiferous cord tissue could mean lower proliferation of pre-spermatogonia and pre-Sertoli cells, consistent with earlier studies in rats that reported IGF1 and IGF2 as regulators of germ cell proliferation and survival/maturation of Sertoli and Leydig cells during testis development (Sorder et al., 1992; Pitetti et al., 2013). Moreover, according to Hochereau-de Reviers et al. (1987), the diameter of seminiferous tubules in adults is highly correlated with the number of germ cells, so the lower seminiferous cords diameter observed in our study may impact on the number of germ and Sertoli cells per seminiferous tubule at postnatal age. Because each Sertoli cell has a fixed capacity for the number of germ cells that it can support (Orth et al., 1988), reduction of Sertoli cell numbers is likely to detrimentally impact offspring fertility. Up-regulation of IGFs may explain the increased expression of StAR and HSD17B3 genes. In vitro, studies have demonstrated that IGF1 influenced the expression of key steroidogenic enzymes in the mouse testis during prenatal development (Villalpando et al., 2003).
As expected, fetal body weight and reproductive organs measured increased in weight during progress of gestation; greater masses were observed at 268 DG for female fetuses and at 241 DG for male fetuses. The greater number of primary, preantral and antral follicles with DG is consistent with Santos et al. (2013) that characterized folliculogenesis in bovine fetal ovary and revealed as fetal age increased, there was tendency for primary and secondary follicles to increase in number. In male fetuses, the volumetric proportion of seminiferous cords decreased during gestation; the greater value was observed at 139 than 199 and 241 DG, whereas interstitium volumetric proportion increased with DG. Moreover, diameter and length of seminiferous cords were similar during gestational period evaluated, consistent with reported by Abd Elmaksoud (2005) that shown an increase in testicular differentiation and size during mid and late gestation in bovine fetuses.
We observed an increased in FSHB gene expression with DG in both sexes, consistent with a previous study in bovine fetuses demonstrating a gradual increase in pituitary content of FSH for both sexes with DG (Workewych and Cheng, 1979). Furthermore, the expression level of LHB was increased with DG in male fetuses, but it was not differentially expressed in female fetuses. Our results differed from Workewych and Cheng (1979), who reported increase in pituitary content of LH for both sexes with DG.
and P450arom genes at 268 than at 199 DG, irrespective of maternal intake could be explained by greater number of follicles at late stage that are secreting estrogen. As the follicles grow and differentiate, the production of estrogen increases (Fortune, 1994).
The greater expression of IGF1, IGF2 and its receptor at 139 than at 199 DG may reflect differences in the age of fetuses associated to stage of testicular development and also a stimulatory effect of these growth factors during testis development by increasing cell proliferation and differentiation which in turn increased testicular size. Similarly, the greater expression of IGF1, IGF2 and IGF1R at 241 than at 199 DG observed in our study could reflect an increase in connective tissue related to fetal growth (Abd Elmaksoud, 2005). Despite IGFs up-regulation, StAR and HSD17B3 expression were decreased at later stages of gestation and may reflect differences in steroidogenic capacity across stages of testicular development. In later stages of gestation, pre-Leydig cells are reduced due to regression or dedifferentiation to mesenchymal cells (Abd Elmaksoud, 2005).
CONCLUSIONS
TGFBR1, GDF9, FSHR, Bax, CASP3, HSD17B3, IGF1, IGF2 and IGF1R. The functional meaning of the observed differential gene expression in terms of offspring reproductive potential should be the focus of further investigations, especially considering a larger sample size to reduce the chances of type I errors as the small sample size was a major limitation of this study.
ACKNOWLEDGMENTS
The authors gratefully acknowledge Conselho Nacional de Desenvolvimento Científico e Tecnológico (CNPq), Fundação de Amparo à Pesquisa do estado de Minas Gerais (FAPEMIG), Instituto Nacional de ciência e Tecnologia de ciência animal (INCT-CA) and Coordenação de Aperfeiçoamento de Pessoal de Nível Superior (CAPES, (Project PVE A125/2013) for their financial support.
REFERENCES
Abd-Elmaksoud, A. 2005. Mophological, Glycohistochemical, and Immunohistochemical Studies on embryonic and adult bovine testis. DS Thesis. Ludwig-Maximilians Univ., Munich.
Baker, J., M. P. Hardy, J. Zhou, C. Bondy, F. Lupu, A. R. Bellvé, and A. Efstratiadis. 1996. Effects of an Igf1 gene null mutation on mouse reproduction. Mol. Endocrinol. 10:903–918. http://dx.doi.org/10.1210/endo.131.5.1425434.
Bao, B., H. A. Garverick, G. W. Smith, M. F. Smith, B. E. Salfen, and R. S. Youngquist. 1997. Changes in messenger RNA encoding LH receptor, cytochrome P450 side chain cleavage, and aromatase are associated with recruitment and selection of bovine ovarian follicles. Biol. Reprod. 56:1158-1168.
Bernal, A. G., M. H. Vickers, M. B. Hampton, R. A. Poynton, and D. M. Sloboba. 2010. Maternal Undernutrition Significantly Impacts Ovarian Follicle Number and Increases Ovarian Oxidative Stress in Adult Rat Offspring. PloS ONES 5(12):e15558. http://dx.doi.org/10.1371/journal.pone.0015558.
Bodensteiner, K. J., C. M. Clay, C. L. Moeller, and H. R. Sawyer. 1999. Molecular cloning of the ovine Growth/Differentiation factor-9 gene and expression of growth/differentiation factor-9 in ovine and bovine ovaries. Biol. Reprod. 60:381-386.
Britt, K. L., A. E. Drummond, V. A. Cox, M. Dyson, N. G. Wreford, M. E. Jones, E. R. Simpson, and J. K. Findlay. 2000. An age-related ovarian phenotype in mice with targeted disruption of the Cyp 19 (aromatase) gene. Endocrinology 141: 2614–2623. http://dx.doi.org/10.1210/endo.141.7.7578.
Burkhart, M. N., J. L. Juengel, P. R. Smithb, D. A. Heathb, G. A. Perry, M. F. Smith, and H. A. Garverick. 2010. Morphological development and characterization of aromatase and estrogen receptors alpha and beta in fetal ovaries of cattle from days
110 to 250. Anim. Reprod. Sci. 117:43-54.
http://dx.doi.org/10.1016/j.anireprosci.2009.02.010.
Cailleau, J., S. Vermeire, and G. Verhoeven. 1990. Independent control of the production of insulin-like growth factor I and its binding protein by cultured testicular cells. Mol. Cell. Endocrinol. 69:79–89.
Chadio, S., B. Kotsampasi. 2014. The role of early life nutrition in programming of reproductive function. J. Dev. Orig. Health Dis. 5:2-15. http://dx.doi.org/10.1017/S204017441300038X.
Cheng, G., Z. Weihua, S. Makinen, S. Makela, S. Saji, M. Warner, J. A. Gustafsson, and O. Hovatta. 2002. A role for the androgen receptor in follicular atresia of estrogen receptor beta knockout mouse ovary. Biol. Reprod. 66:77–84. http://dx.doi.org/10.1095/biolreprod66.1.77.
Chavatte-Palmer, P., C. Dupont, N. Debus, and S. Camous. 2014. Nutritional programming and the reproductive function of the offspring. Anim. Prod. Sc. 54: 1166-1176. http://dx.doi.org/10.1071/AN14470.
Connor, K. L., M. H. Vickers, J. Beltrand, M. J. Meaney, and D. M. Sloboda. 2012. Nature, nurture or nutrition? Impact of maternal nutrition on maternal care, offspring development and reproductive function. J. Physiol. 1:2167-2180. http://dx.doi.org/ 10.1113/jphysiol.2011.223305.
expression and gonadal morphology in female and male foetal sheep at day 103 of gestation. Placenta 24:248-257.
Drummond, A. E., K. L. Britt, M. Dyson, M. E. Jones, J. B. Kerr, L. O’Donnell, E. R. Simpson, and J. K. Findlay. 2002. Ovarian steroid receptors and their role in ovarian function. Mol. Cell. Endocrinol. 191:27–33.
Erickson, D. H. 1966. Development and radio-response of the prenatal bovine ovary. J. Reprod. Fertil. 11:97-105.
Felici, M. D., A. D. Carlo, M. Pesce, S. Iona, M. G. Farrace, and M. Piacentini. 1999. Bcl-2 and Bax regulation of apoptosis in germ cells during prenatal oogenesis in the mouse embryo. Cell Death Differ. 6:908–915.
Fortune, J. E. 1994. Ovarian follicular growth and development in mammals. Biol. Reprod. 50:225-232. http://dx.doi.org/10.1095/biolreprod50.2.225.
Froment, P., C. Staub, S. Hembert, C. Pisselet, M. Magistrini, B. Delaleu, D. Seurin, J. E. Levine, L. Johnson, M. Binoux, and P. Monget. 2004. Reproductive abnormalities in human insulin-like growth factor-binding protein-1 transgenic male mice. Endocrinology 145:2080–2091. http://dx.doi.org/10.1210/en.2003-0956. Gougeon, A., and G. B. N. Chainy. 1987. Morphometric studies of small follicles in
ovaries of women at different ages. J. Reprod. Fertil. 81:433–42.
Griffeth, R. J., V. Bianda, and S. Nerf. 2014. The emerging role of insulin-like growth factors in testis development and function. Basic. Clin. Androl. 24:1-12.
Harding, J. E., and B. M. Johnston. 1995. Nutrition and fetal growth. Reprod. Fertil. Dev. 7:539–547.
Hawkins, P., C. Steyn, T. Ozaki, T. Saito, D. E. Noakes, and M. A. Hanson. 2000. Effect of maternal undernutrition in early gestation on ovine fetal blood pressure and cardiovascular reflexes. Am. J. Physiol. Regul. Integr. Comp. Physiol. 279:R340– R348.
Hochereau-de Reviers, M. T., C. Monet-Kuntz, and M. Courot. 1987. Spermatogenesis and Sertoli cell numbers and function in rams and bulls. J. Reprod. Fertil. Suppl. 34:101–114.
Hulshof, S. C. J., J. R. Figueiredo, J. F. Beckers, M. M. Beyers, J. A. van der Donk, and R. Van Den Hurk. 1995. Effects of fetal bovine serum, FSH, and 17b-estradiol on the culture of bovine preantral follicles. Theriogenology 44:217–226. http://dx.doi.org/10.1016/0093-691X(95)00171-4.
Hussein, M. R. 2005. Apoptosis in the ovary: molecular mechanisms. Hum. Reprod. Update 11:162-178. http://dx.doi.org/ 10.1093/humupd/dmi001.
Ingelfinger, J. R., and A. M. Nuyt. 2012. Impact of fetal programming, birth weight, and infant feeding on later hypertension. J. Clin. Hypertens. (Greenwich) 14: 365–371. Jones, R. H., and S. E. Ozanne. 2009. Fetal programming of glucose-insulin metabolism.
Mol. Cell. Endrocrinol. 297:4-9.
Lea, R. G., L. P. Andrade, M. T. Rae, L. T. Hannah, C. E. Kyle, J. F. Murray, S. M. Rhind, and D. W. Miller. 2006. Effects of maternal undernutrition during early pregnancy on apoptosis regulators in the ovine fetal ovary. Reproduction 131:113-124. http://dx.doi.org/10.1530/rep.1.00844.
Leveillé, P., A. Tarrade, C. Dupont, T. Larcher, M. Dahirel, E. Poumerol, A.G. Cordier, O. Picone, B. Mandon-Pepin, G. Jolivet, R. Lévy, and P. Chavatte-Palmer. 2014. Maternal high fat diet induces follicular atresia but does not affect fertility in adult rabbit offspring. J. .Dev. Orig. Health Dis. 5:88–97. http://dx.doi.org/ 10.1017/S2040174414000014.
Livak, K. J., and T. D. Shmittgen. 2001. Analysis of relative expression data using real time quantitative PCR and the 2-ΔΔCt method. Methods 25:402-408.
Lin, D., T. Sugawara, J. F. Strauss, B. J. Clark, D. M. Stocco, P. Saenger, A. Rogol, and W. L. Miller. 1995. Role of steroidogenic acute regulatory protein in adrenal and gonadal steroidogenesis. Science 267:1828-1831.
Long, N.M., P.W. Nathanielsz, and S. P. Ford. 2012. The impact of maternal overnutrition and obesity on hypothalamic-pituitary-adrenal axis response of offspring to stress. Domest. Anim. Endocrinol. 42:195-202. http://dx.doi.org/10.1016/j.domaniend.2011.12.002.
Mazerbourg, S., C. Klein, J. Roh, N. Kaivo-Oja, D. G. Mottershead, O. Korchynskyi, O. Ritvos, and A. J. Hsueh. 2004. Growth differentiation factor-9 signaling is mediated by the type I receptor, activin receptor-like kinase 5. Mol. Endocrinol. 18:653–665. Meinhardt, U., and P. E. Mullis. 2002. The essential role of the aromatase/p450arom.
Semin. Reprod. Med. 20:277-284. http://dx.doi.org/10.1055/s-2002-35374.
Mossa, F., D. Kenny, F. Jimenez-Krassel, G. W. Smith, D. Berry, S. Butler, T. Fair, P. Lonergan, J. J. Ireland, and A. C. O Evans. 2009. Undernutrition of Heifers during the First Trimester of Pregnancy Diminishes Size of the Ovarian Reserve in Female Offspring. Page 77 in 42nd Annual Meeting of the Society for Study of Reproduction, Pittsburg, PA.
Nandedkar, T. D., and S. J. Dharma. 2001. Expression of bcl(xs) and c-myc in atretic follicles of mouse ovary. Reprod. Biomed. Online 3:221–225.
Nayudu, P.L., and S. M. Osborn. 1992 Factors influencing the rate of preantral and antral growth of mouse ovarian follicles in vitro. J. Reprod. Fertil. 95:349–362. http://dx.doi.org/10.1530/jrf.0.0950349.
Nilsson, E. E., and M. K. Skinner. 2002. Growth and Differentiation Factor-9 Stimulates Progression of Early Primary but Not Primordial Rat Ovarian Follicle Development. Biol. Reprod. 67:1018–1024. http://dx.doi.org/10.1095/biolreprod.101.002527. Orth, J. M., G. L. Gunsalus, and A. A. Lamperti. 1988. Evidence from Sertoli
Orth, J. M. 1993. Cell biology of testicular development in the fetus and neonate. In: Cell and Molecular Biology of the Testis. Desjardins C, Ewing LL ed. Oxford University Press, Oxford, UK.
Paradis, F., S. Novak, G. K. Murdoch, M. K. Dyck, W. T. Dixon, and G. R. Foxcroft. 2009. Temporal regulation of BMP2, BMP6, BMP15, GDF9, BMPR1A, BMPR1B, BMPR2 and TGFBR1 mRNA expression in the oocyte, granulosa and theca cells of developing preovulatory follicles in the pig. Reproduction 138:115–129. http://dx.doi.org/10.1530/REP-08-0538.
Parlee, S. D., and O. A. Macdougald. 2014. Maternal nutrition and risk of obesity in offspring: The Trojan horse of developmental plasticity. Biochim. Biophys. Acta 1842:495–506. http://dx.doi.org/10.1016/j.bbadis.2013.07.007.
Piotrowska, H., B. Kempisty, P. Sosinska, S. Ciesiolka, D. Bukowska, P. Antosik, M. Rybska, K. P. Brussow, M. Nowicki, and M. Zabel. 2013. The role of TGF superfamily gene expression in the regulation of folliculogenesis and oogenesis in mammals: a review. Vet. Med. 10:505-515.
Pitetti, J. L., P. Calvel, C. Zimmermann, B. Conne, M. D. Papaioannou, F. Aubry, C. R. Cederroth, F. Urner, B. Fumel, M. Crausaz, M. Docquier, P. L. Herrera, F. Pralong, M. Germond, F. Guillou, B. Jegou, and S. Nef . 2013. An essential role for insulin and IGF1 receptors in regulating sertoli cell proliferation, testis size, and FSH action in mice. Mol. Endocrinol. 27:814–827. http://dx.doi.org/10.1210/me.2012-1258. Manly, B. F. J. 1997. Randomization, Bootstrap and Monte Carlo Methods in Biology.
Marshall, G. R., and T. M. Plant. 1996. Puberty occurring either spontaneously or induced precociously in rhesus monkey (Macaca mulatta) is associated with a marked proliferation of Sertoli cells. Biol. Reprod. 54:1192-1199.
Plant, T. M., G. R. Marshall. 2001. The functional significance of FSH in spermatogenesis and the control of its secretion in male primates. Endocr. Rev. 22:764-786.
Poljicanin, A., T. Vukusic-Pusic, K. Vukojevic, A. Caric, K. Vilovic, S. Tomic, V. Soljic, and M. Saraga-Babic. 2013. The expression patterns of pro-apoptotic and anti-apoptotic factors in human fetal and adult ovary. Acta Histochem. 115:533-540. http://dx.doi.org/10.1016/j.acthis.2012.11.009.
Portha, B., A. Chavey, and J. Movassat. 2011. Early-life origins of type 2 diabetes: fetal programming of the beta-cell mass. Exp. Diabetes Res. 2011:105076. http://dx.doi.org/10.1155/2011/105076.
Rae, M. T., S. Palassio, C. E. Kyle, A. N. Brooks, R. G. Lea, D. W. Miller, and S. M. Rhind. 2001. Maternal undernutrition during pregnancy retards early ovarian development and subsequent follicular development in fetal sheep. Reproduction 122: 915–922. http://dx.doi.org/10.1530/rep.0.1220915.
Rae, M. T., S. M. Rhind, P. A. Fowler, D. W. Miller, and A. N. Brooks. 2002. Effect of maternal undernutrition on fetal testicular steroidogenesis during the CNS androgen-responsive period in male sheep fetuses. Reproduction 124: 33–39. http://dx.doi.org/ 10.1530/rep.0.1240033.
Richards, J.S. 1994. Hormonal control of gene expression in the ovary. Endocr. Rev. 15:725–751.
Rodríguez-González, G. L., C. C. Vega, L. Boeck, M. Vázquez, C. J. Bautista, L. A. Reyes-Castro, O. Saldaña, D. Lovera, P. W. Nathanielsz and E. Zambrano. 2015. Maternal obesity and overnutrition increase oxidative stress in male rat offspring reproductive system and decrease fertility. Int. J. Obes. 39:549-556 http://dx.doi.org/10.1038/ijo.2014.209.
Rotta, P. P., S. C. Valadares Filho, T. R. Santos, L. F. Costa e Silva, T. E. Engle, M. I.Marcondes, F. S. Machado, F. A. C. Villadiego, and L. H. R. Silva. 2014. Effects of days of gestation and feeding regimen in Holstein × Gyr cows: I. Apparent total tract digestibility, nitrogen balance, microbial protein supply, and fat deposition. J. Dairy Sci. in press
Russell, L. D., H. P. Ren, I. Sinha Hikim, W. Schulze W, and A. P. Sinha Hikim. 1990. A comparative study in twelve mammalian species of volume densities, volumes, and numerical densities of selected testis components, emphasizing those related to the Sertoli cell. Am. J. Anat. 188:21–30.
Santos, S. S. D., M. A. P. Ferreira, J. A. Pinto, R. V. Sampaio, A. C. Carvalho, T. V. G. Silva, N. N. Costa, M. S. Cordeiro, M. S. Miranda, H. F. L. Ribeiro, and O. M. Oashi. 2013. Characterization of folliculogenesis and the occurrence of apoptosis in the development of bovine fetal ovary. Theriogenology 79:344-350. http://dx.doi.org/10.1016/j.theriogenology.2012.09.026.
Seet, E. L., J. K. Yee, J. K. Jellyman, G. Han, M. G. Ross, M. Desai. 2015. Maternal high-fat-diet programs rat offspring liver fatty acid metabolism. Lipids. 50:565-73. http://dx.doi.org/10.1007/s11745-015-4018-8.
Sharpe, R. M., C. McKinnell, C. Kivlin, and J. S. Fisher. 2003. Proliferation and functional maturation of Sertoli cells, and their relevance to disorders of testis function in adulthood. Reproduction. 125:769–784.
Sloboda, D. M., G. J. Howie, A. Pleasants, P. D. Gluckman, and M. H. Vickers. 2009. Pre- and postnatal nutritional histories influence reproductive maturation and
ovarian function in the rat. PloS ONE 4:e6744.
http://dx.doi.org/10.1371/journal.pone.0006744.
Sorder, O., P. Bang, A. Wahab, and M. Parvinen. 1992. Insulin-like growth factors selectively stimulate spermatogonial, but not meiotic, deoxyribonucleic acid synthesis during rat spermatogenesis. Endocrinology 131:2344-2350.
Steibel, J. P., R. Poletto, P. M. Coussens, and G. J. M. Rosa. 2009. A powerful and flexible linear mixed model framework for the analysis of relative quantification RT-PCR data. Genomics 94:146–152.
Sun, L. W., H. Y. Zhang, L. Wu, S. Shu, C. Xia, C. Xu, and J. S. Zheng. 2014. (1)H Nuclear magnetic resonance-based plasma metabolic profiling of dairy cows with clinical and subclinical ketosis. J. Dairy Sci. 97:1552–1562. http://dx.doi.org/10.3168/jds.2013-6757.
Tanaka, Y., K. Nakada, M. Moriyoshi, and Y. Sawamukai. 2001. Appearance and number of follicles and change in the concentration of serum FSH in female bovine foetuses. Reproduction 121:777-82.
Tenenbaum-Gavish K., and M. Hod.2013. Impact of maternal obesity on fetal health. Fetal Diagn. Ther. 34:1-7. http://dx.doi.org/10.1159/000350170.
Tong, J.F., X. Yan, M. J. Zhu, S. P. Ford, P. W. Nathanielsz and M. Du. 2009. Maternal obesity downregulates myogenesis and b-catenin signaling in fetal skeletal muscle. Am. J. Physiol. 296: E917–E924.
Vandesompele, J., K. Preter, F., Pattyn, B. Poppe, N. Van Roy, A. De Paepe, F. Speleman. 2002. Accurate normalization of real-time quantitative RT-PCR data by geometric averaging of multiple internal control genes. Genome Biol. 3: RESEARCH0034.
Vannelli, B. G., T. Barni, C. Orlando, A. Natali, M. Serio, and G. C. Balboni.1988. Insulin-like growth factor-I (IGF-I) and IGF-I receptor in human testis: an immunohistochemical study. Fertil. Steril. 49:666–669.
Villalpando, I., V. Lopez-Olmos. 2003. Insulin-like growth factor I (IGF-I) regulates endocrine activity of the embryonic testis in the mouse. J. Steroid. Biochem. Mol. Biol. 86:151–158.
Vitt, U. A., E. A. McGee, M. Hayashi, and A. J. Hsueh. 2000. In Vivo Treatment with GDF-9 Stimulates Primordial and Primary Follicle Progression and Theca Cell Marker Cyp17 in Ovaries of Immature Rats. Endocrinology 141:3814–3820.
Williams L, Seki Y, Vuguin PM, Charron MJ. Animal models of in utero exposure toa high fat diet: a review. Biochim Biophys Acta 2014; 1842: 507–519.
Workewych, J., and K. W. Cheng. 1979. Development of glycoprotein hormones and their alpha- and beta-subunits in bovine fetal pituitary glands. I. Quantitation of thyrotropin, follicle-stimulating hormone, and luteinizing hormone by radioligand receptor assays. Endocrinology 104:1069-1074.
Wrobel, K. H. 2000. Prespermatogenesis and spermatogoniogenesis in the bovine testis. Anat. Embryol. 202: 209-222.
Yoon, S. J., K. H. Choi, and K. A. Lee. 2002. Nitric oxide-mediated inhibition of follicular apoptosis is associated with HSP70 induction and Bax suppression. Mol. Reprod. Dev. 61:504– 510.
Zambrano, E., C. Guzmán, G. L. Rodriguez-González, M. Durand-Carbajal, and P. W. Nathanielsz. 2014. Fetal programming of sexual development and reproductive
function. Mol. Cell. Endocrinol. 382:538-549.
http://dx.doi.org/10.1016/j.mce.2013.09.008.
Table 2 - Effects of maternal intake and days of gestation on bovine female fetuses characteristics
Maternal intake Days of gestation SEM1 P-value
Moderate High 199 268 DG2 MI3 MI x DG4
Fetal weight (kg) 21.15 23.15 10.94B 34.00A 1.06 <0.001 0.480 0.495
Reproductive organ weight (g) 24.06 21.28 10.85B 34.50A
2.27 <0.001 0.558 0.217
Ovarian weight (mg) 299.83 326.67 257.33B 369.17A 0.08 0.041 0.712 0.543
Max cortical layer width (µm) 240.23 256.84 258.25 238.82 8.49 0.286 0.357 0.375
Min cortical layer width (µm) 200.86 218.84 218.11 201.59 5.25 0.154 0.124 0.170
Numbers of primordial follicles 332.56a 220.90b 216.92 229.94 27.59 0.497 0.045 0.620
Numbers of primary follicles 79.27b 99.98a 80.81 90.45 11.53 0.062 0.044 0.951
Numbers of preantral follicles 4.0b 8.5a 4.06B 7.93A 0.60 0.036 0.041 0.688
Numbers of antral follicles 1.50b 5.80a 3.5B 6.2A 0.80 0.048 0.038 0.551
Total number of follicles 417.33a 332.88b 305.29 334.52 28.46 0.062 0.026 0.877
1Standard error of the mean. Different lowercase letters represent statistical difference (P < 0.05) between maternal intakes. Different
uppercase letters represent statistical difference (P < 0.05) between days of gestation. 2Days of gestation main effects. 3Maternal intake
main effects.4Interaction between maternal intake and days of gestation.
Maternal intake Days of gestation SEM P-value
Moderate High 139 199 241 DG1 MI2 MI x DG3
Fetal weight (kg) 11.33 10.25 1.77C 9.10B 23.75A 0.79 <0.001 0.397 0.654
Reproductive organ weight
(g) 17.30 20.57 4.47
C 14.45B 37.91A 1.66 <0.001 0.342 0.607
Testicular weight (mg) 865.33 797.56 316.30C 690.20B 1487.8A 0.08 <0.001 0.460 0.100 seminiferous cords (%)4
46.17a 41.43b 45.77A 41.29B 42.80B 0.78 0.045 0.035 0.577 Interstitium (%)4
53.83b 58.57a 54.22B 58.61A 57.48A 0.80 0.034 0.042 0.541 Seminiferous cords diameter
(µm) 42.60a 38.76b 43.59 41.91 41.50 0.26 0.446 0.034 0.377
Seminiferous cords length
(cm/g testis) 0.037a 0.030b 0.031 0.032 0.033 0.004 0.524 0.042 0.124
1Days of gestation main effects. 2Maternal intake main effects. 3Interaction between maternal intake and days of gestation. 4%=volumetric proportion. Different lowercase letters represent statistical difference (P < 0.05) between maternal intakes. Different
Weller Figure 3
dD cC
b
a
a
a
b
a
a a a a
A B
C D
a a
cC
cC
b bB
A dD
dD
a cA
cA
a
b dB
E F
G H
Weller figure 5
cA aA
cA aA
dB bB
bB
dB
aA aA
cC bB
cC bB
A
B
C
aA
cC
bB
dD
eE eE
aA
cC
bB
eE eE
dD
eA aA
cC
fB dD
D
E
Weller Figure 6
aA eA
cC
bB fB
dD
aA eA
cC
bB fB
Figure 1. Fetal ovary of a representative bovine fetus from the (A) high and (B) moderate intake cows at 268 days of gestation.
Figure 2. Testicular parenchyma in a bovine fetus from high (A) and (B) moderate intake cows at 199 days of gestation. Each seminiferous cords is composed of pre-espermatogonia (*) centrally located in the middle of the cord and pre-Sertoli cells (arrows) located at the periphery.
Figure 3. Box plot for relative mRNA abundance of FSHB in pituitary gland of female fetuses from high (H) and moderate (M) intake cows at 199 and 268 days of gestation (DG). Different lowercase letters represent difference (P < 0.05) between maternal intakes within DG. Different uppercase letters represent difference (P < 0.01) between DG within maternal intake.
Figure 4. Box plot for relative mRNA abundance of FSHB and LHB in pituitary gland of male fetuses from high (H) or moderate (M) intake cows at 139, 199 and 241 days of gestation (DG). No difference between maternal intakes within DG, which were represent by lowercase letters. Different uppercase letters represent difference (P < 0.01) between DG within maternal intake.
within DG. Different uppercase letters represent difference (P < 0.01) between DG within maternal intake.
CHAPTER II (Article II)
Interpretative summary
Nutrient intake level changes mammary parenchyma growth and gene expression in crossbreed prepubertal heifers
Weller
This study reported that elevated nutrient intake level by prepubertal heifers reduced mammary parenchyma (PAR) growth, changed its composition and increased mammary extraparenchymal fat. Higher expression of PAR lipogenic enzymes in response of augmented nutrient intake, suggesting adipocytes hypertrophy was also observed. These results will provide better understanding of prepubertal mammary gland development and in the future achieve optimal nutritional management for maximizing milk yield.
NUTRIENT INTAKE LEVEL AND MAMMARY GLAND DEVELOPMENT Effects of nutrient intake level on mammary parenchyma growth and gene
expression in prepubertal heifers
M. M. D. C. A. Weller*, Ronan L. Albino*, M. I. Marcondes*, M. S. Duarte, M.L.
Mescouto*F. F. Silva*, S. E. F. Guimarães*1
*Animal Science Department, Universidade Federal de Viçosa, 36570-000, Viçosa,
Minas Gerais, Brazil.
†Embrapa Gado de Leite, 36038-330, Juiz de Fora, Minas Gerais, Brazil.
1Corresponding author: Simone Eliza Facioni Guimarães, P.H. Rolfs avenue, Viçosa,
ABSTRACT
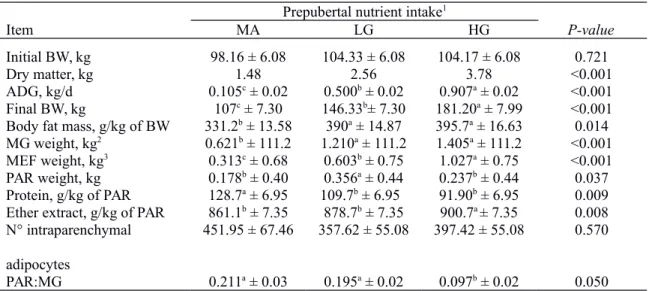
This study was designed to evaluate effects of increased nutrient intake of same diet on prepubertal mammary parenchyma (PAR) development in crossbreed dairy heifers. Eighteen heifers between 3-4 mo old were fed 1 of 3 nutrient intake levels (n = 6/treatment) designed to sustain an average daily gain (ADG) as follows: 0.0 kg/d (maintenance; MA), 0.5 kg/d (low gain; LG), or 1.0 kg/d (high gain; HG). Serum blood samples collected on d 42 and 84 after a 12h fast were analyzed for triglycerides (TRI), leptin, insulin and insulin-like growth factor 1 (IGF1). Liver and mammary parenchyma (PAR) were biopsied on d 42 and harvested on d 84 for gene expression analysis. Also, PAR samples were used for biochemical and histological analysis. Mammary PAR weight was lower in HG than MA and LG heifers, whereas mammary extraparenchymal fat was greater in HG heifers than other groups. Heifers fed the HG had a greater fraction of lipids in their PAR than others, and smaller fraction of protein in their PAR than MA heifers. Nutrient intake had no effect on the number of intraparenchymal adipocytes. Only serum insulin and IGF1 were affected by nutrient intake level. Heifers fed the HG had greater serum IGF1 than others, and serum insulin was lower in MA than HG and LG heifers. The liver GHR, IGF1 and IGFBP3 mRNA was higher whereas IGFBP2 mRNA was lower in HG heifers compared to others. The expression of CD36, ACCA, FASN and ADIPOR1 were up regulated by nutrient intake level. Overall, our data demonstrated that enhancing nutrient intake favored to fat accumulation on body and resulted adipocyte hypertrophy in the PAR of HG heifers. The implications of these results to future milk yield remains to be elucidated.
INTRODUCTION
In prepubertal dairy heifers (3 to 10 mo of age), high levels of nutrient intake sustaining average daily gains (ADG) more than 0.7 kg/d can result in decreased mammary parenchymal growth (Sejrsen et al., 1982, 2000; Capuco et al., 1995) milk yield production (Sejrsen and Purup, 1997; Petitclerc et al., 1999; Radcliff et al., 2000) and increased fat deposition in the mammary gland (Swanson, 1960; Radcliff et al., 1997; Meyer et al., 2006). The mechanisms whereby elevated nutrient intake cause this effect remain undefined. Several hypotheses have been proposed to explain this phenomenon. Previous studies focused on hormones such as, growth hormone and leptin that may be involved as mediator of nutritional-impaired prepubertal mammary parenchyma development (Sejrsen et al., 1983; Silva et al., 2002). However, early evidences indicates that mammary-derived factors could be more important (Akers et al., 2000; Purup et al., 2000a, b). Piantoni et al. (2012) reported that doubling nutrient intake from standard feeding rates decreased expression of genes related to molecular transport and lipid metabolism in mammary parenchyma of preweaned heifers. Thus, this finding in preweaned heifers raises the hypothesis that elevated nutrient intake could also alter the expression of genes associated with lipogenesis.
conflicting results demonstrate the need for further evaluation of the role of GH/IGF1 axis in the development of prepubertal bovine mammary gland.
This study addresses the hypothesis that increased nutrient intake by Holstein x Gyr heifers reduces mammary parenchyma (PAR) weight and increases mammary extraparenchymal fat (MEF). We further hypothesized that this occurs in concert with in alterations in systemic hormone concentrations and local changes, not only on expression of lipogenic enzyme genes in PAR but also on expression of relevant genes in liver. There were 2 experimental objectives: the first was investigate effects of high nutrient intake level on hormone concentrations, expression of lipogenic genes (CD36, ACCA, FASN, ADIPOR1), and mammary composition in prepubertal heifers. The second objective was to examine the relationship between liver GHR, IGF1, IGFBP2 and IGFBP3 gene expression to prepubertal bovine mammary gland development. Therefore, identify molecular mechanisms that are susceptible to different levels of nutrient intake in PAR of prepubertal heifers might help us better understand mammary gland development during this allometric phase and, in the future, achieve practical goals that maximize milk production by suggesting appropriated nutritional management to maximize milk production
MATERIALS AND METHODS
Experimental design and Animal management
Eighteen crossbred (Holstein × Gyr) heifers with an average initial body weight (BW) of 102.2 ± 3.4 kg and between 3 and 4 month of age were used. Heifers were individually housed and fed for the duration of the 84 d experiment. The experimental unit was heifer. Before the start of the experiment, all heifers were allowed ad libitum acess to a corn silage-based diet for 15d to minimize potential compensatory gain effects in the treatment period. Afterwards, heifers were assigned in a completely randomized design to 1 of 3 nutrient intake levels (n=6/treatment) designed to sustain an average daily gain (ADG) of either: 0.0 kg/d (maintenance; MA), 0.5 kg/d (low gain; LG), or 1.0 kg/d (high gain; HG). All heifers were fed twice daily at 08:00 a.m and 04:00 p.m with the same diet throughout the experiment (Table 1). The HG diet was formulated based on metabolizable energy (ME) requirements of large breed dairy heifers weighing 150 kg and gaining 1.0 kg/d of BW (NRC, 2001). Feed intake for LG was adjusted to support daily gains of 0.5 kg/d; the same was done for MA sot that initial BW was maintained throughout the experiment. All heifers were weighed every 14 days in order to compare the performance achieved within the planned and correcting the amount of supplied diet according to the animal weight.
Blood Sampling and Analysis
Tissue Sampling
Liver and mammary parenchyma (PAR) biopsies were harvestedon day 42 of experiment from three heifers per treatment chosen randomly, and then they were immediately immersed in 5 ml of RNAholder (BioAgency, São Paulo, Brazil). The PAR samples from each heifer were taken from left rear-quarter. After 24 hours, the collected material was removed from RNAholder, drained and stored in an ultra-freezer (-80ºC) until RNA extractions were carried out.
Pre-harvest handling on 84º day was in accordance with good animal welfare practices, and the heifers were harvested by stunning with a captive bolt followed by exsanguination. At harvest, the liver was removed and a sample collected for RNA analysis. Following collection of liver, the whole udder was removed, weighed, skinned and bisected into right and left halves at the median suspensory ligament. The skin and teats from the whole udder were discarded. At this time, the skinned right and left hemi-udder were dissected to collect parenchymal tissue. The weight of PAR tissue was recorded after extraparenchymal fat and lymph nodes were removed. The weight of mammary extraparenchymal fat (MEF) was also recorded. The left skinned hemi-udder was used to obtain samples of PAR for later RNA extraction whereas the right skinned hemi-udders was used to obtain PAR samples that were frozen at -80ºC until later biochemical compositional and histological analyses. The samples of PAR and liver collected for RNA analysis were immediately immersed in 5 ml of RNAholder and the same procedure was performed as mentioned above for the biopsies samples.
determination of body fat mass by ether extract analysis (EE; method 920.85; AOAC, 1990). The final EE was corrected by adding the fat lost during the partial defatting process.
Biochemical Analysis of dAR
Dissected PAR samples were removed from freezer, allowed to partially thaw, and then lyophilized for composition analysis. The lipid content was determined by ether extract (EE; method 920.85; AOAC, 1990). The final EE was corrected by adding the fat lost during the partial defatting process. The nitrogen content was analyzed by a Kjeldahl procedure (AOAC, 1990). The crude protein (CP) content was calculated as N × 6.25.
Histology Analysis of dAR
Formalin-fixed PAR samples were dehydrated in increasing concentrations of ethanol (70ºC, 95ºC and 100ºC), cleared in Histochoice® (Sigma-Aldrich) and embedded in Paraplast (Sigma-Aldrich). Paraplast embedded blocks were sectioned serially at 10 µm thick slices and stained with Haematoxylin–Eosin for examination of number of intraparenchymal adipocytes.