Design and Implementation of Real Time Remote Supervisory
System
Mr. Mudit Goenka, Miss. Anumeha Srivastava, Prof. Sushant Pawar
Department of Electronics and Telecommunication, Sandip Institute of Technology and Research center, Nasik, India
Department of Electronics and Telecommunication, Sandip Institute of Technology and Research center, Nasik, India
Department of Electronics and Telecommunication, Sandip Institute of Technology and Research center, Nasik, India
Abstract
In today’s fast growing communication environment and rapid exchange of data in networking field has triggered us to develop a home based remote supervisory monitoring system. In the present paper the physiological parameters of the patient such as body temperature, ECG, Pulse rate and Oxygen Saturation is displayed in MATLAB graphical user interface which is processed using ARM7 LPC2138. In case any emergency persist and parameters goes abnormal over the optimum level then a buzzer will ring to alert the caretaker. And the vital parameters will be displayed on the patient side computer and an automatic SMS will be sent to the doctor using GSM interface.
Keywords
: ECG, Pulse Rate, Temperature, Oxygen Saturation ARM processor, GSM module, MATLABI.
I
NTRODUCTIONAs new technologies are emerging everyday in our lives, the improvement in health care industry becomes even more vital. Remote monitoring of the patient is a contemporary approach that has been implemented using the current advancements in technology. Today due to enhancements in the electronics that are now also being implemented in the biomedical and Intensive Critical Care Unit and Intensive Care Unit, people have become more apprehensive towards their health. Real Time Remote Supervisory system is basically used for data acquisition, electronic communication and information technology to allow interaction between the Doctors and the patient.[1]
Emerging augmentation in the networking and communication has forced the Electronics and Telecommunication engineer to develop a home based monitoring system, which will assist the doctor to display and transmit the signal from the human body using the various sensors and display the data on the Personal Computer.
ECG Waveform and filtering tool for ECG waveform has been displayed using MATLAB which is computer based processing, acquisition and analysis system. The acquisition of physiological Parameters are discussed in this paper, like Electronic Cardiogram, Body Temperature, Pulse rate, oxygen saturation. As the signal obtained from the sensor will be in the analog domain, hence a signal conditioning device such as instrumentation
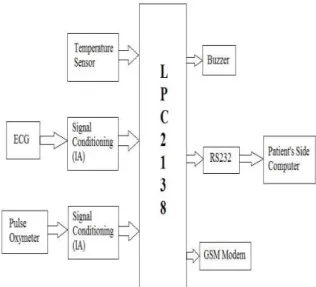
amplifier is used. The following figure represents the block diagram of remote supervisory system. [1]
The analog signal can be directly fed in the ARM7 LPC2138 processor as it has inbuilt analog to digital converter. The processor is connected to the patient side computer using a serial interface RS232 cable. It will perform the operations on signal and transfer the data on the patient side computer through a serial port. In this way the system is expected to monitor the patient under critical condition more conveniently and accurately without the physical
presence of the doctor near the patient’s bed.[1]
The second section describes the system representation, third section describes the hardware design of the system, the fourth section includes the software development tools and graphical user interface in MATLAB, and the last section will be followed by the result, conclusion and reference.
II.
SYSTEM
REPRESENTATION
The data obtained from the physiological parameters will be processesed using LPC2138 and displayed on the patient side computer using the MATLAB GUI software, which will display numerical value of the Body Temperature, Pulse Rate, Oxygen Saturation and graphical display of the Electronic Cardiogrma. As the data is converted it is then processed by the microprocessor and it will be displayed on the patients personal side computer using the RS232 data bus. On the patient's personal computer LPC2138 will be interfaced using the Matrix Laboratory Software which will display thedetailed information about the parameters in numerical values and it will display a graphical representation of the Electronic Cardiogram on Graphical User Interface tool of the MATLAB software.
Fig. 1 Block Diagram of Remote Supervisory system
In case if any parameters goes abnormal over the optimum level then a buzzer will ring to alert the caretaker of the patient and an automatic SMS will be sent to the doctor using a GSM interface. These systems did not involve the patient to be admitted in the hospital and the monitoring could be achieved by allowing him/her to remain at home. By far the most key benefits of this system is that it eradicates the high cost obstacle. This system effectively reduces the cost by enabling in-home monitoring of patients, and also eliminate the need for employment of expensive amenities, and reducing the call for hauling of patients to physicians and medical centres. Also using it becomes exceptionally effortless due to user friendly interface and no particular training is essential for the personnel. Due to the interactive nature of the system, it becomes easier for the doctor to monitor the patient and provide with suitable course
of action.
III.
HARDWARE DESIGN OF THE
SYSTEM
The hardware design includes designing of Temperature, Pulse Oximeter, signal conditioning and ECG measurement.
A. Temperature sensor
LM35 is a precision IC temperature sensor with its output proportional to the temperature (in °C). The sensor circuitry is sealed and therefore it is not subjected to oxidation and other processes. With
LM35, temperature can be measured more accurately than with a thermistor. It also possess low self heating and does not cause more than 0.1 °C temperature rise in still air. The operating temperature range is from -55°C to 150°C. The output voltage varies by 10mV in response to every °C rise/fall in ambient temperature, i.e., its scale factor is 0.01V/ °C
Fig. 2. IC LM35
B. Pulse Oximeter
In its most common (transmissive) application mode, a sensor is placed on a thin part of the patient's body, usually a fingertip or earlobe, or in the case of an infant, across a foot. Light of two wavelengths is passed through the patient to a photo detector. The changing absorbance at each of the wavelengths is measured, allowing determination of the absorbance due to the pulsing arterial blood alone, excluding venous blood, skin, bone, muscle, fat, and (in most cases) nail polish.
the peaks, and _lter out noise. Both op-amps are contained in a single integrated circuit (IC or chip), and hooking them up is really just a matter of interconnecting the pins correctly.
C. Signal conditioning 1. Protection Circuit
Diode (D1, D2, D3, D4) are used to protect IC from voltage when input voltage reaches to 0.7V then Diode get clamped and over voltage condition is avoided. Because of this input to instrumentation Amplifier will always be less than 0.7V.[1]
2. Instrumentation Amplifier
The instrumentation amplifier used is AD8320 which has a very high CMRR (90dB) and high gain (1000). The AD8320 is a low cost, high accuracy amplifier which requires only one external resistor to set gain of the amplifier.[1]
Fig. 3. IC for AD8320
3. Isolation Circuit (IC: MCT2E)
It is NPN silicon planar phototransistor optically coupled to a gallium arsenide infrared emitting diode. Isolation circuit is used to provide isolation between input and output. It protect patient from shock. For checking the ECG signals on CRO we measure the ECG signals via CRO probes In most of the cases the Patient electrode ground and CRO ground is not the same, for such cases if the CRO ground is not properly earthed then the patient may get a Shock so for this reason we are interfacing a Opto- isolator which provides a optical insulation between the Electrode circuit and the Output circuit. [1].
4. Notch Filter
Notch filter is used to provide zero output at particular freq. It eliminates power line noise at 50Hz. It contains H.P.F and L.P.F called twin-T network. Signal having frequency between 47HZ to 53HZ .Output of notch filter is +2.5V.Output of notch filter is 2.5V. It connects to input of adder circuit. Adder circuit shifts the signal from 2.5V to
0-5V. And this output gives to ADC of ARM7 LPC 2138[1].
5. Amplifier OP07
8 pin DIP package, low input offset voltage and high open loop gain. This non- inverting amplifier is used for signal conditioning purpose, gain provided by amplifier is 143. Total gain required for ECG circuit is 1000.Using variable resister gain adjust to 143.[1]
IV.
SOFTWARE DEVELOPMENT
IMPLEMENTATION AND TOOLS
A. ECG measurement
Electrodes are placed on human body to capture small electrical voltage produced by contracting muscle due to each heartbeat. The ECG signal obtained by the electrodes is in the range of 1 to 5mV. Due to the weak voltage level, the signal is fed into an instrumentation amplifier to amplify and filter the acquired signal. The fig. shows circuit diagram of ECG measurement. The amplified signal is then fed into the ARM7 LPC 2138 having inbuilt A/D converter. Digital output of the ADC is sent to local terminal (patient’s terminal) via an RS232 interface circuit.
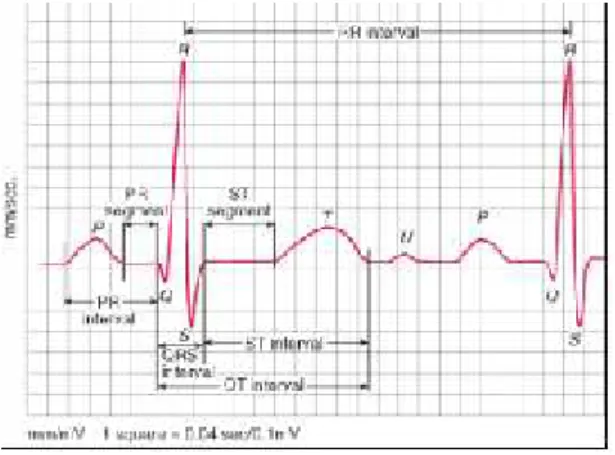
FIG. 4. ECG Waveform
A. Algorithm
1. Patient
2. Initialize the LPC2138 (ARM7) Processor. 3. Select the Physiological parameter.
4. Generate the start of conversion (SOC) signal for ADC.
5. Wait for end of conversion (EOC) signal from the ADC.
6. Check the Optimum Limit of Individual Parameter.
7. If satisfied repeat the above steps.
8. If not satisfied with optimum data, then a buzzer will ring and automatic SMS will be sent using GSM modem.
C. Graphical user interface in MATLAB
Fig. 5. Front panel of the GUI
This above figure shows how the front panel of the GUI will look after the implementation of MATLAB code on it , which will graphically display ECG and digitally display the values of Body Temperature, Pulse Rate and Oxygen Saturation.[5]
V.
RESULT AND DISCUSSION
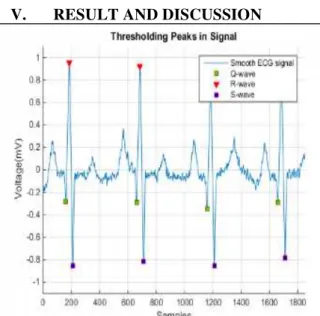
Fig. 6. Simulation of ECG Waveform in MATLAB
The above waveform shows the ECG signal and it is periodic with fundamental frequency determined by heartbeat. The fig.4 shows the single period of an ECG signal which is a mixture of sinusoidal wave and triangular wave forms. Each significant feature of ECG signal can be represented by shifted and scaled versions one of these waveforms as shown above. Such an ECG simulator technique is advantageous as it can eliminate the problem of taking a real time signal as well as saves time.
Fig.5 will show the detected ECG signal and other parameters of the patient which are monitored using the processor ARM7 LPC2318. The format will also display the other information of the patient.
The MATLAB GUI program includes the patient’s
name, age, date, patient report, frequency domain window display will also display heart rate in beats per minutes. The waveform and other parameters are observed on the patient side monitor if any abnormality occurs then the alert will be given using a buzzer and an SMS will be sent to the doctor.
VI.
FUTURE SCOPE
In the future, this monitoring application can be expanded which will allow the doctor to diagnose his
patient’s vital parameters distantly and progressively in his computer and further in a web page in more real time and does not require to have any special software on his PC. Without any installation of any software, through the internet access the patient can be monitored and diagnosed. Further using a Lab VIEW
an alert system can be established on the patient’s side
monitor, which will automatically send a mail using Email notification application.
VII.
CONCLUSION
This system will be beneficial and has a greater advantage to our society by reducing the cost of travelling of the patient, save huge amount of the hospital bills and conserve the time of the doctors. This home based supervisory system will provide a constant monitoring to the patients condition.
VIII.
ACKNOWLEDGMENT
We wish to express our deep gratitude to Guide Prof. Sushant J.Pawar, who on regular interval solved our problems which came through us in MATLAB and always encouraged, enlightened and enriched us in making this project.We would like to specially thank Head Of Department Prof. G. M. Phade and to Principal Dr. S. T. Gandhe.
Finally, we are ending this acknowledgement with deep indebtedness to our friends who have contributed their immense time in explaining about the LPC2138 processor, helping us in writing the program code and also helped us in interfacing LPC2138 processor with the Matrix Laboratory software.
R
EFERENCES[1] Suhas Kale, C. S. Khandelwal. Design and Implementation of Real Time Embedded Tele-Health Monitoring System. IJCSN International Journal of Computer Science and Network, Vol 2, Issue 1, 2013.
[3] M.R. Mhetre, Advait Vaishampayan."ECG Processing & Arrhythmia Detection: An Attempt". International Journal of Engineering and Innovative Technology (IJEIT) Volume 2, Issue 10, April 2013. [4] Durgesh Kumar Ojha, Monica Subashini.
"Analysis of Electrocardiograph (ECG) Signal for the Detection of Abnormalities Using MATLAB". World Academy of Science, Engineering and Technology International Journal of Medical, Health, Pharmaceutical and Biomedical Engineering Vol:8 No:2, 2014.
[5] MATLAB Graphical User Interface Guide, MATLAB.
[6] ARM7 Data Sheet, Document Number: ARM DDI 0020CIssued: Dec1994
[7] R.S. Khandpur handbook of Biomedical Instrumentation.
[8] http://en.wikipedia.org/wiki/Electrocardiogr aphy
[9] http://in.mathworks.com/help/signal/exampl
es/peak-analysis.html
[10]
http://www.patient.co.uk/doctor/pulse-oximetry
[11] Embedded Systems: Real-Time Interfacing
to Arm(r) Cortex -M Microcontrollers:
Volume 2; by Jonathan W.Valvano ; 10 Nov
2011.
[12] MATLAB & its application in Engineering;
byRaj Kumar Bansal ; 15 June 2009.
[13] MATLAB and Simulink for Engineers
(Oxford Higher Education); by Agam