DOI: 10.5562/cca2769
Metal Nanoparticles Deposited on Porous Silicon
Templates as Novel Substrates for SERS
Lara Mikac,1,2 Mile Ivanda,1,2,* Marijan Gotić,1,3 Aleksandar Maksimović,1,2 Sebastiano Trusso,4 Cristiano D’Andrea,4,5
Antonino Foti,4 Alessia Irrera,4 Barbara Fazio,4 Pietro Giuseppe Gucciardi4
1 Center of Excellence for Advanced Materials and Sensing Devices, Research Unit New Functional Materials, Bijenička c. 54, Zagreb, Croatia 2 Ruđer Bošković Institute, Division of Materials Physics, Laboratory for Molecular Physics, Bijenička c. 54, Zagreb, Croatia
3 Ruđer Bošković Institute, Laboratory for Synthesis of New Materials, Bijenička c. 54, Zagreb, Croatia 4 CNR IPCF Istituto per i Processi Chimico-Fisici, Viale F. Stagno D'Alcontres 37, I-98156, Messina, Italy 5 Matis CNR – IMM – Istituto per la Microelettronica e Microsistemi – via S. Sofia 64, I-95123 Catania, Italy
* Corresponding author’s e-mail address: ivanda@irb.hr
RECEIVED: October 24, 2015 REVISED: November 27, 2015 ACCEPTED: November 30, 2015
THIS PAPER IS DEDICATED TO DR. SVETOZAR MUSIĆ ON THE OCCASION OF HIS 70TH BIRTHDAY
Abstract: In this paper, results on preparation of stable and uniform SERS solid substrates using macroporous silicon (pSi) with deposited silver and gold are presented. Macroporous silicon is produced by anodisation of p-type silicon in hydrofluoric acid. The as prepared pSi is then used as a template for Ag and Au depositions. The noble metals were deposited in three different ways: by immersion in silver nitrate solution, by drop-casting silver colloidal solution and by pulsed laser ablation (PLA). Substrates obtained by different deposition processes were evaluated for SERS efficiency using methylene blue (MB) and rhodamine 6G (R6G) at 514.5, 633 and 785 nm. Using 514.5 nm excitation and R6G the limits of detection (LOD) for macroporous Si samples with noble metal nanostructures obtained by immersion of pSi sample in silver nitrate solution and by applying silver colloidal solution to pSi template were 10–9 M and 10–8 M respectively. Using 633 nm laser and MB the most noticeable
SERS activity gave pSi samples ablated with 30000 and 45000 laser pulses where the LODs of 10–10 M were obtained. The detection limit of
10–10 M was also reached for 4 mA cm–2-15 min pSi sample, silver ablated with 30000 pulses. Macroporous silicon proved to be a good base for
the preparation of SERS substrates.
Keywords: macroporous silicon, SERS, substrate, laser ablation.
INTRODUCTION
AMAN spectroscopy is an important technique for identification as well as for structural characterization of wide number of analytes. Raman scattering is known to be a very inefficient process due to its low scattering cross-section. In order to improve the sensitivity of the process, surface enhanced Raman spectroscopy (SERS) has been used for several decades.[1] A lot has been written about the
mechanism of the SERS but it is now widely accepted that there are two main factors affecting SERS: electromagnetic, due to the generation of localized plasmon near the metal surface, and chemical, due to the interaction between the analyte and metal surface.[2,3] Silver and gold are very good
for fabrication of SERS substrates because of surface
plasmon resonances in the visible region of the spectra, yielding high field enhancement and confinement.[4]
Today, there is a growing need for the development of stable, sensitive, reproducible and portable SERS-active substrates for use in different fields. Some of the most extensively used SERS substrates are metal colloids because of their simplicity of preparation and strong Raman enhancement.[5,6] However, the use of the colloid solutions
for SERS deals with important issues, like stability and reproducibility.[7] Nanostructures can also be fabricated
electrochemically and with methods that allow high organization in the structure, like lithography methods and Langmuir-Blodgett technique.[8–12] Other popular types of
Croat. Chem. Acta 2015, 88(4), 437–444 DOI: 10.5562/cca2769
semiconducting material typically obtained by electrochemical etching in hydrofluoric acid (HF).[14,15] After the etching,
material is consisted of a network of pores with different diameters and depth, depending on the etching conditions. Due to its high surface-to-volume ratio this is an interesting material for photonic and sensing devices, drug delivery systems as well as for use in SERS.[16–19]
The formation of metal nanostructures on the surface of porous Si could be performed in several ways. One of the methods includes immersion of porous Si in an aqueous solution of metal salt.[13,20,21] In this case, porous Si has the
ability to reduce the metal ions so they form nanoparticles. Another method is the immersion into colloidal solution or drop casting colloidal solution onto porous Si template.[22,23]
The formation of silver and gold thin films on the porous Si can be obtained, also, by pulsed laser ablation (PLA).[24] In this method power laser pulses are used to
evaporate material from the target surface which results in the formation of plasma plume. The ablated material is then collected on a substrate. The biggest advantage of this technique is easy manipulation with the parameters which leads to good control of the size and distribution of nanoparticles. This method is also considered ‘clean’ because, unlike in colloid, it is not necessary to use the molecules for stabilization. In particular, different surface morphologies, and optical properties, can be obtained by changing the Ar pressure and the deposition time, while keeping all the other relevant deposition parameters fixed. It has been shown that, fixed the Ar pressure, at low laser pulses number, isolated nearly spherical nanoparticles are obtained, while at increasing laser pulses number clustered nanoparticles, islands and finally nearly percolated structures are observed on the samples surface.[24] The Ar pressure plays a similar role on the film
morphologies at decreasing values, having fixed the laser pulse number.
In this paper we investigated the SERS amplification of two probe molecules, Rhodamine 6G (R6G) and Methylene Blue (MB), absorbed on a porous Si template on the surface of which silver or gold nanoparticles have been deposited by three different methods, i.e. immersion in AgNO3 solution, drop casting silver colloidal solution and
laser ablation with silver and gold. Our goal was to investigate whether a porous silicon substrate gives strong enhancement of the signal and is therefore suitable for solid SERS substrates production.
EXPERIMENTAL
Preparation of Macroporous Silicon Samples
Silicon wafers (100) of p-type (boron-doped), with a resistivity of ~ 20 Ωcm and 525 ± 25 µm thickness, were cutinto ~ 2.5×2.5 cm pieces and degreased by sonication in acetone and ethanol and rinsed with ultra-pure water. All chemicals were of p.a. grade. Electrochemical experiments were performed with home-made two-electrode Teflon cell in 12 %wt hydrofluoric acid solution. The working electrode was silicon wafer and counter electrode was Pt wire. Electrical contact on the back side of the back side of silicon piece was made using Ga/In and silver paint. The constant current densities used were 4 mA cm–2 for 15 min (sample
#1), 4 mA cm–2 for 30 min (sample #2) and 10 mA cm–2 for
30 minutes (sample #3) in 12 wt% HF acid. The pSi prepared were immersed for one minute in 32 %wt HF - ethanol solution to remove luminescent micro pSi layer and silicone oxide, rinsed with ethanol and dried in air. By this method porous silicon with pore width larger than 50 nm is formed (macroporous silicon).
Preparation of SERS Substrates
IMMERSION PLATING
In the case of immersion plating, silver was deposited on the surface of pSi by dipping the pSi samples in 0.01 and 0.001 M aqueous silver nitrate (AgNO3) solution. Different
immersion times (1, 2, 3, 4 and 5 minutes) were studied. After the immersion, the pSi samples were washed with ultra-pure water and left to air dry at room temperature.
DROP CASTING OF THE COLLOIDAL SOLUTION
In the case of drop casting, the drop of previously prepared silver colloidal solution was placed on macroporous Si samples and left to air dry at room temperature. The silver colloidal solution was synthesized using ascorbic acid as reducing agent and citrate as stabilizer. The average size of the nanoparticles in this colloid solution was 17 nm.[26]
PULSED LASER ABLATION (PLA)
Silver and gold nanoparticles have been grown by pulsed laser ablation of solid targets in presence of a controlled Ar atmosphere. The deposition conditions adopted in this work were chosen on previous studies using a KrF excimer laser (λ = 248 nm, pulse width 25 ns, repetition rate 10 Hz).[25,27,28]
Silver and gold targets are positioned inside a vacuum chamber on a rotating holder. Macroporous Si pieces are positioned 35 mm far from the target. Ar pressure is 70 Pa for the deposition of silver and 100 Pa for gold deposition. Laser fluence is about 2.0 ± 0.2 J cm–2. The silver deposition is
DOI: 10.5562/cca2769 Croat. Chem. Acta 2015, 88(4), 437–444
Morphological and Spectroscopic
Characterization
The morphology of the resulting structures was examined with Jeol JSM 7000F field emission scanning electron micro-scope (FE SEM) coupled with Energy-dispersive spectros-copy (EDS). The particle size distribution was determined using modified level set algorithm.[29]
Surface-enhanced Raman spectra were recorded by Horiba JobinYvonHR800 and T64000 micro Raman systems. The exciting lines were 514.5 (Ar laser), 632.8 (He-Ne laser) and 785 nm. In order to reduce the photo degradation of the analyte, filters were used, and the laser excitation power was kept low, about 6 mW for 514.5 nm and 6 µW for 632.8 nm excitation, unless stated otherwise. SERS spec-tra were acquired using 100× microscope objective result-ing in a probe area of about 1 micron. The accumulation times were varied between 1 and 30 s and experiments were carried out at room temperature. Prior to recording the SERS spectra, the samples were soaked in aqueous solutions of testing molecules at different concentrations for 30 minutes (Figure S2, Supporting Information). As testing molecules rhodamine 6G (R6G) and methylene blue (MB) were used. The concentration range tested was from 10–4 to 10–12 M. The spectral region of investigation for R6G
was 300–1000 cm–1 where several most intense bands are
expected (620 cm–1 - C–C–C ring in-plane bend and 778 cm–1
- C–H out of plane bend).[30] The 400–1800 region was
investigated for MB where characteristic bands are around 1624 cm–1 (C–C stretching), 450 and 504 cm–1 (C–N–C
skel-etal bending).[31]
RESULTS AND DISCUSSION
The electrochemical etching of silicon samples for both current densities and etching times resulted in the formation of macro pores with ~ 1 µm width and variable lengths. The etched samples are then coated with noble metals in three ways: a) immersion in AgNO3 solution, b)drop casting silver colloidal solution and c) laser ablation. For the latter experiment we changed materials (silver, gold) and number of pulses to control the particles morphology. For each SERS substrate we looked for the limit of detection (LOD) achievable using laser excitations at 515 nm, 633 nm or 785 nm. Substrates prepared by immersion plating and application of previously prepared colloid were tested on their SERS activity using R6G and 514.5 nm excitation, while ablated samples were tested using MB and 633 and 785 nm excitation. The detailed scheme of the experiments is shown in Figure 1. It should be noted that in Figure 1 give are detection limits for the samples with the best enhancement.
A SEM micrograph of the SERS substrates obtained by immersion of pSi etched 30 min at 4 mA cm–2 in 0.01 M
AgNO3 solution is presented in Figure 2a. The silver layer is
composed of homogeneously distributed nanoparticles that cover the surface leaving the larger macro pores open. The average size of the nanoparticles is around 100 nm but there are also some aggregates.
On the micrograph of the pSi with drop casted silver colloidal solution (Figure 2b), it can be observed that micron scale agglomerates of silver nanoparticles are formed at the entrances of the pores. The average size of the single silver nanoparticles is around 70 nm, but some smaller particles are present as well.
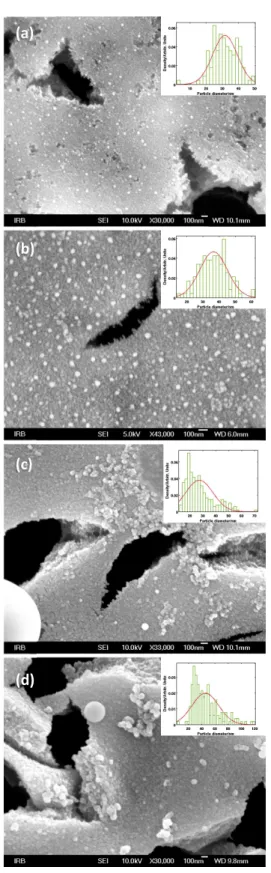
Micrographs of pSi with ablated silver and gold are shown in Figures 3 and 4. The mean silver particle size on macroporous Si surface for both silver ablations and gold ablation was calculated to be in the range from 20 to 40 nm. We measured the LSPR on glass substrates placed in the PLD chamber during the deposition. Broad plasmon peaks (LSPR) were at 610, 890 and 680 nm for first silver ablation, second silver ablation and gold ablation, respectively (re-sults not shown). Furthermore, as seen on Figures 3 and 4, present are spherical structures that usually emerge during ablation process.[25] These micrometric or submicrometric
particulates are generated during ejection from the target surface. If we compare pores for the samples etched 15 and 30 minutes at 4 mA cm–2, (Figure S1, Supporting
Infor-mation) we can see that the pores for longer etched samples are elongated (several micrometers). The samples etched with 10 mA cm–2 current density (Figure 3d and 4b),
have wider pores i.e. higher porosity.
The next step was testing Ag and Au coated macroporous Si surfaces for their SERS activity using two common chromophores, rhodamine 6G (R6G) and methylene blue (MB), two probe molecules typically used in SERS.[27,32]
In order to evaluate the efficiency of the SERS substrates, we wanted first to find the best parameters for immersion of pSi samples in AgNO3 solution. For such
purpose five different immersion time intervals for 0.01 M
Croat. Chem. Acta 2015, 88(4), 437–444 DOI: 10.5562/cca2769
AgNO3 concentration (1, 2, 3, 4 and 5 minutes) and one time
interval (5 min) for 0.001 M AgNO3 concentration were
investigated using 10–8 M solution of rhodamine 6G. The
best Raman signal for R6G was obtained for the pSi samples that were immersed 1 minute in the 0.01 M AgNO3 solution
(Figure 5). The signal significantly decreased for immersion times higher than 3 minutes. Immersion in 0.001 M silver nitrate solution for 5 minutes gave similar Raman signal for R6G like 1 min immersion in higher concentration. In this case 10–9 M concentration of R6G could not be detected
which was not the case for the pSi sample immersed one minute in 0.01 M solution. For this reason and because of the lower photoluminiscent background, we have used 2 minute immersion time in 0.01 M silver nitrate solution for further investigations.
The Raman spectra for a sequence of R6G samples at increasing concentrations were recorded on substrates pre-pared by immersion plating. Results are shown in Figure 6a. The excitation wavelength for these samples was 514.5 nm, which means that Surface Enhanced Resonant Raman was measured. As regards the limit of detection for R6G on pSi with silver nanostructures obtained by immersion plating with conditions described above, we were able
Figure 2. SEM micrographs of silver nanostructures depos-ited on pSi (sample #2) (a) from 0.01 M AgNO3 solution during two minutes and (b) with drop casted silver colloid, with particle size distributions (insets). Scale bar 100 nm.
Figure 3. SEM images of pSi samples ablated with silver: (a) 30000 pulses, sample #1; (b) 30000 pulses, sample #2; (c) 45000 pulses, sample #2; and (d) 45000 pulses, sample #3, and their corresponding particle size distributions. Scale bar 100 nm.
(a)
(b)
(a)
(b)
(c)
DOI: 10.5562/cca2769 Croat. Chem. Acta 2015, 88(4), 437–444
to detect the 10–9 M concentration of R6G. In all the spectra
we can observe the peaks at 612 and 776 cm–1, but for 10–8
and 10–9 M concentrations there are differences in the
1200–1700 cm–1 range coming from amorphous carbon
(spectra not shown).
The second SERS surface preparation method investigated was drop casting of Ag colloid. R6G was used as probe molecule. SERS spectra are showed on Figure 6b. We were able to detect the R6G at concentration of 10–8 M.
On the basis of previous papers we expect a better efficiency of our pSi samples in the red-NIR part of the visible range.[27,28] For this reason the samples that were
laser ablated were tested on methylene blue with 633 nm excitation, which resulted in resonant SERS. Furthermore, the penetration depth in Si for 633 nm is 3 µm, while for 514 nm is 0.7 µm which allows us a better insight into the influence of the pores. The macroporous Si samples etched 15 and 30 minutes (with 4 mA cm–2 current) were decorated
with silver nanoparticles produced by ablation using 30000 pulses. The sample etched 15 minutes showed good SERS activity with nice spectrum for MB at the concentration of 10–10 M (Figure 7a). With 30 min etched sample we have
only detected 10–6 M MB solution. It is known that
prolonged etching time induces an increase in macropore
depth to a certain etching time. Then a decrease in porosity due to the chemical dissolution of pSi is possible.[32] In our
case, on SEM images, pore elongation with prolonged etching time is observed. The reason why, for the silver deposition of 30000 pulses, 15 min etched sample is better for SERS measurements than 30 min etched sample, might lie in the fact that 30 min etched sample has thicker porous layer and more dye molecules enter deeper into the silicon which means that they are not available for detection because of the relatively shorter light penetration depth.
On the basis of previous papers we expect a better efficiency of our pSi samples in the red-NIR part of the visible range.[27,28] For this reason the samples that were
laser ablated were tested on methylene blue with 633 nm excitation, which resulted in resonant SERS. Furthermore, the penetration depth in Si for 633 nm is 3 µm, while for 514 nm is 0.7 µm which allows us a better insight into the influence of the pores. The macroporous Si samples etched 15 and 30 minutes (with 4 mA cm–2 current) were decorated
with silver nanoparticles produced by ablation using 30000 pulses. The sample etched 15 minutes showed good SERS activity with nice spectrum for MB at the concentration of
Figure 4. SEM images of pSi samples ablated with gold: (a) sample #2; and (b) sample #3 and their corresponding particle size distributions. Scale bar 1 µm.
Figure 5. (a) SERS spectra of 10-8 M R6G on macroporous Si sample #2 for different AgNO3 immersion times and concen-trations (the time increases from top to bottom, concentra-tion 10–3 M showed at the bottom); excitation 514.5 nm; laser power 1 mW; accumulation time 10 s, unless stated other-wise; (b) plot of SERS intensity for 612 cm–1 and 776 cm–1 R6G Raman bands vs. immersion times; filled markers represent 10–3 M AgNO3 concentration.
(a)
(b)
(a)
Croat. Chem. Acta 2015, 88(4), 437–444 DOI: 10.5562/cca2769
Figure 7. SERS spectra of MB: a) 10–6, 10–8 and 10–10 M concentrations (from top to bottom) on pSi sample #1 ablated with silver (30000 pulses); laser power 0.6 µW (D4), laser power 6 µW (D3); b) 10–8 and 10–10 M concentrations (from top to bottom) on pSi sample #1 ablated with silver (45000 pulses); c) 10–6, 10–8 and 10–10 M concentrations (from top to bottom) on pSi sample #2 ablated with silver (45000 pulses) and d) 10–8 and 10–10 M concentrations (from top to bottom) on pSi sample #3 ablated with silver (45000 pulses). For all the samples excitation 633 nm; laser power 6 µW, unless stated otherwise; accumulation time 10 s.
Figure 6. (a) SERS spectra of R6G (10–6, 10–7, 10–8 and 10–9 M from top to bottom) on pSi sample #2 with silver obtained by immersion plating; laser power 1 mW; (b) SERS spectra of R6G (10–6, 10–7 and 10–8 M from top to bottom) on pSi sample #2 with drop casted Ag colloid; laser power 6 mW; excitation 514.5 nm; accumulation time 10 s.
(a) (b)
(a) (b)
DOI: 10.5562/cca2769 Croat. Chem. Acta 2015, 88(4), 437–444
10–10 M (Figure 7a). With 30 min etched sample we have
only detected 10–6 M MB solution. It is known that
prolonged etching time induces an increase in macropore depth to a certain etching time. Then a decrease in porosity due to the chemical dissolution of pSi is possible.[32] In our
case, on SEM images, pore elongation with prolonged etching time is observed. The reason why, for the silver deposition of 30000 pulses, 15 min etched sample is better for SERS measurements than 30 min etched sample, might lie in the fact that 30 min etched sample has thicker porous layer and more dye molecules enter deeper into the silicon which means that they are not available for detection because of the relatively shorter light penetration depth.
In the second attempt to make good SERS substrate on pSi we have chosen to ablate silver with the higher number of pulses. In the second silver ablation 45000 pulses were used, resulting in thicker silver layer. In this case, both 15 and 30 min etched samples showed good SERS activity (Figure 7b and 7c), as well as the sample etched with 10 mA cm–2 current density for 15 minutes
(Figure 7d). In fact, for this sample (sample #3, 45000 pulses) we observed a band for 10–12 M concentration but
it cannot be said with certainty that it belongs to MB. So, detection limit of MB for all three pSi samples prepared with 45000 pulses was between 10–10 M and 10–12 M. Of the
samples that were ablated with gold the lowest limit of detection of MB (that lies between 10–6 and 10–8 M) was
obtained on sample #2 (Figure 8).
The measurements on pSi samples ablated with silver with 45000 pulses were also performed with 785 excitation line. In these spectra the MB band at 450 cm–1
was not present. The MB band at 1624 cm–1 was barely
detected up to the concentration of 10–10 M in sample #1
and sample #2 (Figure S3, Supporting Information). It should be pointed out that with bare pSi samples (without Ag nanostructures on the surface) the MB was detected up to the concentration of 10–4 M.
CONCLUSION
Several types of SERS substrates were prepared using macroporous Si as template. Their efficiency was tested using dye molecules, methylene blue and rhodamine 6G at different wavelengths.
Using 514.5 excitation line and R6G as test molecule, we have compared the limit of detection for macroporous Si samples with noble metal nanostructures obtained in two different ways. In the case of immersion of pSi sample in silver nitrate solution the lowest R6G concentration detected was 10–9 M. When silver colloidal solution was
applied to pSi template, the lowest R6G concentration that was detected was 10–8 M.
Using 633 nm laser wavelength and MB, we have investigated the limit of detection for silver and gold ablated macroporous Si samples with variation in etching time and current density. The most pronounced SERS activity gave pSi samples ablated with 45000 laser pulses. For these samples nice spectra for 10–10 M concentration of
MB were obtained. The detection limit of 10–10 M was also
reached for 4 mA cm–2-15 min pSi sample, silver ablated
with 30000 pulses. For the gold ablated pSi samples, the lowest concentration detected was barely 10–8 M. When
using near-infrared excitation, the detection limit of MB was 10–10 M (samples 4 mA cm–2- 15 and 30 min). In
conclusion, stable and reproducible SERS substrates were successfully prepared using macroporous Si template.
Acknowledgment. This work has been supported by Croatian Science Foundation under the project (IP-2014-09-7046). Financial support by the European Cooperation in Science and Technology through COST Action MP1302 Nanospectroscopy is gratefully acknowledged.
Supplementary Information. Supporting information to the paper is enclosed to the electronic version of the article at: http://dx.doi.org/10.5562/cca2769.
REFERENCES
[1] C. L. Haynes, C. R. Yonzon, X. Zhang, R. P. Van Duyne, J. Raman Spectrosc.200536,471.
[2] G. C. Schatz, M. A. Young, R. P. Van Duyne, Top. Appl. Phys. 2006, 103, 19.
[3] S. M. Morton, L. Jensen, J. Am. Chem. Soc.2009, 131, 4090. [4] K. A. Willets, R. P. Van Duyne, Annu. Rev. Phys. Chem.
2007, 58, 267.
[5] L. Rivas, S. Sanchez-Cortes, J. V. Garcia-Ramos, G. Morcillo, Langmuir2000, 16, 9722.
[6] A. Guerrero-Martinez, S. Barbosa, I. Patoriza-Santos, L. M. Liz-Marzan, Curr. Opin. Colloid Interface Sci.
2011, 16, 118.
Croat. Chem. Acta 2015, 88(4), 437–444 DOI: 10.5562/cca2769
[7] R. Tantra, R. J. C. Brown, M. J. T. Milton, J. Raman Spectrosc.2007, 38, 1469.
[8] M. O. Finot, G. D. Braybrook, M. T. McDermott, J. Electroanal. Chem.1999, 466, 234.
[9] N. A. Abu Hatab, J. M. Oran, M. J. Sepaniak, ACS Nano
2008, 2, 377.
[10] M. Green, F. M. Liu, J. Phys. Chem. B2003, 107, 13015. [11] E. C. Le Ru, P. G. Etchegoin, J. Grand, N. Felidj, J. Aubard, G. Levi, A. Hohenau, J. R. Krenn, Curr. App. Phys. 2008, 8, 467.
[12] A. Tao, F. Kim, C. Hess, J. Goldberg, R. He, Y. Sun, Y. Xia, P. Yang, Nano Lett. 2003, 3, 1229.
[13] H. Lin, J. Mock, D. Smith, T. Gao, M. J. Sailor, J. Phys. Chem. B2004, 108, 11654.
[14] D. Fahlman Bradley, A. Ramírez-Porras in Advances in Chemical Sensors, Vol. 7 (Ed. P.W. Wang), InTech,
2012.
[15] M. J. Sailor, Porous Silicon in Practice: Preparation, Characterization, and Applications, Wiley-VCH, Weinheim, Germany, 2012.
[16] M. P. Stewart, J. M. Buriak, Adv. Mater.2000, 12, 859. [17] I. Schechter, M. Ben-Chorin, A. Kux, Anal. Chem.
1995, 67, 3727.
[18] E. J. Anglin, L. Cheng, W. R. Freeman, M. J. Sailor, Adv. Drug Delivery Rev.2008, 60, 1266.
[19] M. V. Chursanova, L. P. Germash, V. O. Yukhymchuk, V. M. Dzhagan, I. A. Khodasevich, D. Cojoc, Appl. Surf. Sci.2010, 256, 3369.
[20] F. Giorgis, E. Descrovi, A. Chiodoni, E. Froner, M. Scarpa, A. Venturello, F. Geobaldo, Appl. Surf. Sci.
2008, 254, 7494.
[21] H. Lin, J. Movk, D. Smith, T. Gao, M. J. Sailor, J. Phys. Chem. B2004, 108, 11654.
[22] J. Zhu, H. Bart-Smith, M. R. Begley, G. Zangari, M. L. Reed, Chem. Mater.2009, 21, 2721.
[23] O. Rabin, S. Y. Lee, J. Nanotechnol.2012, 2012, 12. [24] G. N. Makarov, Phys.-Usp.2013, 56, 643.
[25] E. Fazio, F. Neri, P. M. Ossi, N. Santo, S. Trusso, Appl. Surf. Sci.2009, 255, 9676.
[26] L. Mikac, M. Ivanda, M. Gotic, T. Mihelj, L. Horvat, J. Nanopart. Res.2014, 16, 2748.
[27] C. D'Andrea, F. Neri, P. M. Ossi, N. Santo, S. Trusso, Nanotechnology2009, 20, 245606.
[28] E. Fazio, F. Neri, C. D'Andrea, P. M. Ossi, N. Santo, S. Trusso, J. Raman Spectrosc.2011, 42, 1298. [29] C. Li, C. Xu, C. Gui, M. D. Fox, Proceedings of the IEEE
Computer Society Conference on CVPR 2005, 1, 430. [30] P. Hildebrandt, M. Stockburger, J. Phys. Chem.1984,
88, 5935.
[31] G.-N. Xiao, S.-Q. Man, Chem. Phys. Lett.2007, 447, 305. [32] B. Fazio, C. D'Andrea, F. Bonaccorso, A. Irrera, G. Calogero, C. Vasi, P.G. Gucciardi, M. Allegrini, A. Toma, D. Chiappe, C. Martella, F. Buatier de Mongeot, ACS Nano2011, 5, 5945.
1
Metal nanoparticles deposited on porous silicon templates as SERS substrates
L. Mikac
a,b, M. Ivanda
a,b, M. Gotić
a,c, A. Maksimović
a,b, S. Trusso
d, C. D’Andrea
d,e, A. Foti
d, A.
Irrera
d, B. Fazio
d, P.G. Gucciardi
d,f,ga Center of Excellence for Advanced Materials and Sensing Devices, Research Unit New Functional Materials,
Bijenička c. 54, Zagreb, Croatia
bRuđer Bošković Institute, Division of Materials Physics, Laboratory for Molecular Physics, Bijenička c. 54,
Zagreb, Croatia
cRuđer Bošković Institute, Laboratory for Synthesis of New Materials, Bijenička c. 54, Zagreb, Croatia
d CNR IPCF Istituto per i Processi Chimico-Fisici, Viale F. Stagno D'Alcontres 37, I-98156, Messina, Italy e Matis CNR – IMM – Istituto per la Microelettronica e Microsistemi – via S. Sofia 64, I-95123 Catania, Italy
f Istituto di Fisica e Scienze della Terra, Università di Messina, Viale F. Stagno D'Alcontres 31, I-98166,
Messina, Italy
g Dipartimento di Energia, Center for Nanoengineered Materials and Surfaces-NEMAS, Politecnico di Milano,
via Ponzio 34-3,20133, Milano, Italy
Correspondence to: Mile Ivanda, Center of Excellence for Advanced Materials and Sensing Devices, Research
2
approximately the same signal while 120 min incubation time resulted in lowest R6G signal.
For the further studies with R6G we used 30 min incubation times.
Figure S1
SERS spectra of 10
-6M R6G on macroporous Si (sample #2) for different
incubation times – 5, 15, 30, 60, 90 and 120 min (the time increases from top to bottom);
excitation 514.5 nm; laser power 1 mW; accumulation time 10 s
Figure S2
SEM images of pSi samples ablated with silver (30000 pulses): a) sample #1 and
b) sample #2. Scale bar 1 µm
400 600 800 1000 1200 1400 1600 1800
Raman shift (cm-1)
In
te
ns
ity
(a
rb
. u
ni
ts
)
1 R6G 10-6M 5min 2 R6G 10-6M 15min 3 R6G 10-6M 30min 4 R6G 10-6M 60min 5 R6G 10-6M 90min 6 R6G 10-6M 120min 1
2
3 4 5
6