www.atmos-meas-tech.net/9/6051/2016/ doi:10.5194/amt-9-6051-2016
© Author(s) 2016. CC Attribution 3.0 License.
Evaluating the influence of laser wavelength and detection stage
geometry on optical detection efficiency in a
single-particle mass spectrometer
Nicholas Marsden1, Michael J. Flynn1, Jonathan W. Taylor1, James D. Allan1,2, and Hugh Coe1
1Centre for Atmospheric Science, School of Earth, Atmospheric and Environmental Sciences,
University of Manchester, Manchester, M13 9PL, UK
2National Centre for Atmospheric Science, University of Manchester, Manchester, UK
Correspondence to:Hugh Coe ([email protected])
Received: 29 April 2016 – Published in Atmos. Meas. Tech. Discuss.: 12 May 2016 Revised: 3 November 2016 – Accepted: 4 November 2016 – Published: 15 December 2016
Abstract. Single-particle mass spectrometry (SPMS) is a useful tool for the online study of aerosols with the ability to measure size-resolved chemical composition with a tem-poral resolution relevant to atmospheric processes. In SPMS, optical particle detection is used for the effective temporal alignment of an ablation laser pulse with the presence of a particle in the ion source, and it gives the option of aerody-namic sizing by measuring the offset of particle arrival times between two detection stages. The efficiency of the optical detection stage has a strong influence on the overall instru-ment performance.
A custom detection laser system consisting of a high-powered fibre-coupled Nd:YAG solid-state laser with a colli-mated beam was implemented in the detection stage of a laser ablation aerosol particle time-of-flight (LAAP-TOF) single-particle mass spectrometer without major modifications to instrument geometry. The use of a collimated laser beam per-mitted the construction of a numerical model that predicts the effects of detection laser wavelength, output power, beam fo-cussing characteristics, light collection angle, particle size, and refractive index on the effective detection radius (R) of the detection laser beam. We compare the model predictions with an ambient data set acquired during the Ice in Clouds Experiment – Dust (ICE-D) project.
The new laser system resulted in an order-of-magnitude improvement in instrument sensitivity to spherical particles in the size range 500–800 nm compared to a focussed 405 nm laser diode system. The model demonstrates that the limit of detection in terms of particle size is determined by the
scat-tering cross section (Csca) as predicted by Mie theory. In
ad-dition, if light is collected over a narrow collection angle, oscillations in the magnitude ofCscawith respect to particle
diameter result in a variation in R, resulting in large particle-size-dependent variation in detection efficiency across the particle transmission range. This detection bias is imposed on the aerodynamic size distributions measured by the in-strument and accounts for some of the detection bias towards sea salt particles in the ambient data set.
1 Introduction
Ambient measurements of aerosol properties are required to further our understanding of the role of aerosol in climate (Boucher et al., 2013) and the detrimental effects on hu-man health (Pope and Dockery, 2006). The dynamic nature of atmospheric processes make the online measurement of aerosol properties very challenging, and the choice of tech-niques depends on the specific aerosol property of interest and the temporal resolution required. In the field of atmo-spheric science, the importance of refractory aerosols in at-mospheric processes (Formenti et al., 2011; Hudson et al., 2011) has increased the demand for online measurement of size-resolved composition at low number concentrations.
time-of-flight mass spectrometry (TOF-MS), providing detailed com-position information on a particle-by-particle basis. This ap-proach allows for aerosol particle number concentrations to be evaluated by particle composition as well as the probing of internal mixing state that cannot be done by bulk analy-sis techniques (e.g. Pratt and Prather, 2010; Zelenyuk et al., 2010; Reitz et al., 2011). The type of material that can be analysed is determined by the power and wavelength of the pulsed laser system, whilst the temporal resolution is related to the probability that a particle will be coincident with the laser pulse in the ion source, a phenomenon often referred to as hit rate. In many systems, optical particle detection is in-corporated into the instrument to provide an external trigger to the pulsed laser – temporally aligning the laser pulse with the presence of a particle in the ionisation region, resulting in an increased hit rate.
The incorporation of two optical detection stages into the instrument allows the determination of particle velocity by measuring the time taken for particles to travel the known distance between two detection stages. When used with an aerodynamic lens inlet, particle velocity is a function of the vacuum aerodynamic diameter, allowing for a particle size measurement to be made in addition to the single-particle composition measurement made by the TOF-MS. In some instruments, the optical detection stage has also been used to optically size particles (Murphy and Thomson, 1995) and to directly measure light-absorbing properties (Moffet and Prather, 2009) by calculating the scattering cross section from the intensity of detected light. These tandem measure-ments of single particles allow for the direct linking of com-position with physical properties such as size, shape, and density (Murphy et al., 2004; Vaden et al., 2011). The de-sign of the optical detection stage has a strong influence on the overall instrument performance and has been the focus of much research (Murphy, 2007). The features of SPMS in-struments have previously been described by Sullivan and Prather (2005), Nash et al. (2006),Murphy (2007), and Hinz and Spengler (2007).
Optical particle detection techniques are well established for the size-resolved counting of particles in optical parti-cle counters (OPCs) (McMurry, 2000), which are similar in many respects to the optical detection systems employed in SPMS. Particles are detected by collecting the scattered light generated from the interaction of a particle beam with a continuous-wave (cw) laser. When employed in SPMS, the scattering signals need only exceed a certain threshold to reg-ister a particle event, unlike standard OPCs, which optically size the particle based on the magnitude of the scattering sig-nal. Incorporating an optical system into the geometry of a SPMS creates additional design challenges.
Advances in laser technology have influenced the design and development of the optical detection stage in SPMS. Early instruments utilised a helium–neon gas laser with a wavelength of 633 nm (Hinz and Kaufmann, 1996; Prather et al., 1994; Murphy and Thomson, 1995) with an output
in the range of 4–10 mW. The implementation of 532 nm Nd:YAG solid-state lasers with an output in the range of 50–300 mW greatly improved laser fluence and beam qual-ity in later-generation instrument (Thomson et al., 2000; Su et al., 2004; Zelenyuk and Imre, 2005; Brands et al., 2011). Other groups have opted for newly developed laser diodes (Gaie-Levrel et al., 2012) that, while producing less output (40 mW), have shorter wavelengths (405 nm) and are rel-atively cheap and easy to implement. Shorter wavelengths are desirable when sampling particles whose diameter (D) is smaller than the wavelength of the incident radiation asCsca
is proportional toD6in the Rayleigh regime.
The most efficient particle detection systems use an el-liptical mirror to collect scattered light over a wide angle, thus maximising scattering signal at the detector (Su et al., 2004; Zelenyuk and Imre, 2005). However, the physical di-mensions of a standard elliptical mirror prevent the detec-tion stage being located within the ionisadetec-tion region. Con-sequently, it must be located upstream in the vacuum hous-ing, and complex trigger circuits must be made that produce a particle-size-dependent trigger delay (Zelenyuk and Imre, 2005). Such systems have excellent particle detection effi-ciencies but have a hit rate that is limited by the probability of hitting a detected particle with the pulsed laser.
Composition measurements with SPMS are usually con-sidered qualitative due to shot-to-shot variations in instru-ment function and a strong matrix effect that influences the ionisation process (Reilly et al., 2000; Zhou et al., 2006; Reinard and Johnston, 2008). These phenomena result in ion signals that are not proportional to the mass of the chemi-cal species and a particle number counting bias with respect to particle type. Numerous studies have reported quantita-tive or semi-quantitaquantita-tive results by using relaquantita-tive sensitivity factors to account for matrix effects (Gross et al., 2000), ac-counting for transmission and hit rate bias (Kane and John-ston, 2000), and calculating scaling functions by referencing conventional particle counters (Allen et al., 2000). Quantifi-cation of particle number concentrations by these methods requires large assumptions to made about particle proper-ties such as shape, density, and refractive index, making the application to ambient aerosol difficult. For instruments that utilise elliptical mirrors for particle detection, the optical par-ticle detection efficiency is usually only considered a limiting factor when assessing the low particle size cut.
min-eral dust during long-range transport (Sullivan et al., 2007; Dall’Osto et al., 2010; Fitzgerald et al., 2015), and the char-acterisation of particles of low number concentration in the Arctic (Sierau et al., 2014). The direct comparison of the re-sponse of single-particle instruments with different designs (Middlebrook et al., 2003; Hinz et al., 2006) highlights the need to consider the factors that affect particle counting statistics in SPMS.
The laser ablation aerosol particle time-of-flight (LAAP-TOF) spectrometer is a type of single-particle mass spec-trometer manufactured by AeroMegt (GmbH) and is in an early stage of commercial development. The instrument fea-tures an aerodynamic lens inlet (model LPL-2.5, AeroMegt GmbH), a bipolar TOF analyser (TOFWerks AG), a novel particle detection system based on 405 nm laser diode tech-nology, and a compact light collection optics assembly con-sisting of fibre optic guides that collect scattered light over a narrow scattering angle and is located directly in the ionisa-tion region.
We present an evaluation of the instrument performance with the original instrument manufacturer (OEM) detection stage design that identified the optical detection system as a limiting factor in instrument performance. The instrument performance is compared with a customised detection system in which the detection laser is replaced with a fibre-coupled 532 nm 1 W Nd:YAG solid-state laser system with a colli-mated laser beam. The influence of detection stage geome-try is evaluated using the customised detection system as the laser intensity distribution within a collimated beam is rela-tively simple to model because, unlike a focused beam, there is no variation along the beam axis due to depth of field.
2 Description of instrumentation
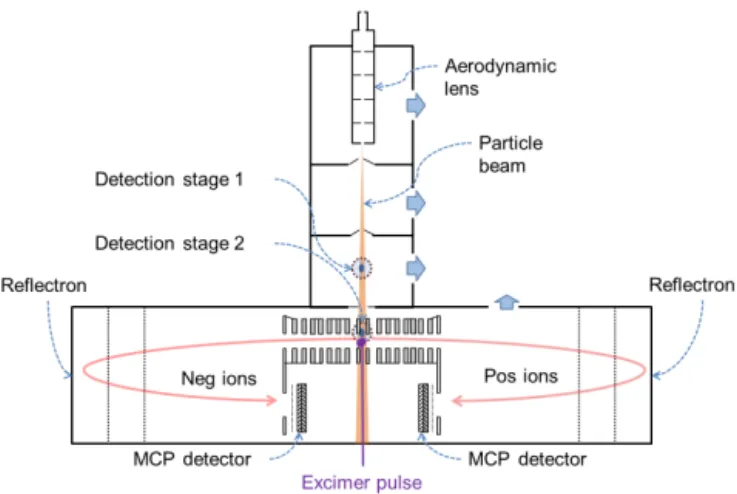
The instrument design has previously been described by Gemayel et al. (2016). Here, we provide a brief overview of the instrument layout and describe the modifications made to the optical detection system. A schematic layout of the in-strument is shown in Fig. 1. Aerosol enters the inin-strument via a 100 µm critical orifice and passes through an aerodynamic lens before beam expansion into the first low-pressure region of the instrument. The particle beam passes through second and third differentially pumped stages separated by skim-mers that remove the majority of the gas phase. Detection stage 1 is encountered in the third pumping stage when the particles pass through a cw laser beam arranged orthogonally to the axis of the particle beam. After passing a differentially pumped aperture into the TOF vacuum region, the particles encounter detection stage 2, which is located within the ex-traction optics of the TOF analyser. Detection stage 2 triggers an excimer laser (ArFλ=193 nm, model EX5, GAM) to fire an intense pulse in a direction that is co-axial but counter-propagate with the particle beam. The cloud of ions gener-ated by the interaction of the material with the high-energy
Figure 1.Schematic diagram of the LAAP-TOF instrument.
pulse is extracted into two linearly opposing TOF analysers, for positive and negative ions respectively.
Instrument control is performed using IgorDAQ software (AeroMegt Gmbh) based on IGOR (Wavemetrics), which corporates TofDaq (TOFWerk AG) data acquisition. The in-strument can be operated in three modes:
– Auto-trigger. The excimer is set to fire at a user-defined frequency (up to 100 Hz), and mass spectra will be gen-erated at a rate that is determined by the probability of a particle being synchronous with sufficient energy from the 8 ns excimer pulse in the ionisation region.
– Second laser only. The excimer laser will fire when it receives a trigger signal (with a set delay) from the de-tection stage 2, increasing the probability of generating a mass spectrum.
– Both lasers. The instrument actively sizes particles, and a trigger is required from both detection stage 1 and 2 in order to fire the excimer laser.
Figure 2.Schematic diagrams of the LAAP-TOF detection stages.(a)Detection system A featuring a 405 nm diode-based system with a focussed beam (D4σ of 51.2 µm) and a sheath type spatial filter.(b)Detection system B featuring a custom-built 532 nm Nd:YAG DPSS fibre-coupled system producing a collimated beam with a 1/e2waist diameter of 330 µm, and spatial filtering outside the vacuum housing.
The optical fibres for light collection are connected to two photomultiplier tubes (PMTs) so that each PMT receives light from six fibres. A PMT signal pulse height above a user-set threshold results in a transistor–transistor logic (TTL) pulse from the discriminator to the microprocessor control unit (MCU) in the timing electronics. A pulse is required from both PMTs in the detections stage in order for the MCU to recognise the presence of a particle. The thresholds are set experimentally by finding the minimum threshold value at which false triggers (noise) are not created – resulting in the discrimination between high-frequency noise and true parti-cles, improving the signal to noise performance of the detec-tion system in a similar set-up to that described by Trimborn et al. (2000).
In this study, two different systems of laser delivery are evaluated: detection system A, based on a laser diode emit-ting light at 405 nm that is focussed by a lens with a long focal length and spatially filtered with a sheath within the vacuum chamber, and detection system B, based on a custom-built fibre-coupled system featuring a Nd:YAG diode-pumped solid-state laser (DPSS), emitting at 532 nm that is collimated by a fiberport and spatially filtered by an orifice outside the vacuum chamber. Schematic diagrams of detection system A and detection system B are shown in Fig. 2a and b respectively. A summary of the key charac-teristics of the laser systems is given in Table 1.
Laser type is a fundamental choice that has an effect on the implementation, usability, and reliability of the system. Laser diodes have the advantage of being relatively cheap and easy to implement. However, diodes have a significantly shorter lifetime than a DPSS system especially if operated at or close to maximum output power. Consequently, the laser diode in
Table 1.Summary of the characteristics of the detection laser sys-tems.
System A System B
Laser type Diode DPSS Wavelength 405 nm 532 nm Max Power 450 mW 1 W Typical operating output∗ 50 mW 300 mW Beam type Focussed Collimated Beam width 51.2 µm (D4σ) 330 µm (1/e2)
Spatial filter Sheath Orifice
∗Typical operating power refers to the actual power delivered to the detection stage at typical operating setting and after beam focussing and filtering.
detection system A is operated at a fraction of the maximum available output power which is set by adjusting the drive to the diode. The output that is produced by a set drive volt-age deteriorates over an diode-specific timescale, and, as the actual output can only be measuring with a laser power me-ter outside the instrument, there is some uncertainty as to the actual diode power output if the instrument is continually op-erated over a number of days or weeks.
power transmission efficiency of 40 %. The typical operation condition of this system produces an output of 300 mW in a collimated beam after spatial filtering.
Overall, the extra power available from the fibre-coupled system allowed for a larger detection beam width without significantly reducing the peak intensity produced by the tightly focussed diode beam. A more detailed description of the detection system designs can be found in Appendix B.
3 Methods
A number of methodologies were used to evaluate the instru-ment performance. The creation of aerosols in the laboratory was required for the instrument set-up procedure, instrument sensitivity testing, and the subsequent evaluation of perfor-mance of the particle detection system. Ambient sampling was carried out to measure the sensitivity of the instrument in atmospheric conditions and assess the suitability of the sys-tem for in situ measurement of size-resolved chemical com-position of atmospheric aerosols.
3.1 Laboratory experiments
Monodisperse particles of polystyrene latex spheres (PSL) (Duke Scientific, Inc.) were produced using an atomiser aerosol generator (Topas GmbH, model ATM226) and a custom-built scanning mobility particle sizer (SMPS). The SMPS comprised a differential mobility analyser (DMA, TSI Inc., model 3081) and condensation particle counter (CPC, TSI Inc., model 3786-LP). The flow was divided between the CPC and LAAP-TOF after the DMA using an equal Y split-ter and conductive tubing.
A measurement of the particle beam density profile was made using the detection laser to probe the particle density in a experiment similar to the optical detection method de-scribed by Petrucci et al. (2000). The optical detection stages were aligned onto the particle beam which was placed in a central position with respect to the instrument axis. The par-ticle beam was then traversed in the horizontal axis (orthog-onal to the detection beam axis) using the lens adjuster to pivot the inlet in the gimbal in 0.05 mm intervals. The num-ber of particle pulses was measured over a 1 min period at each position using an oscilloscope. The lateral movement of the particle beam in the plane of detection can be easily calculated with simple trigonometry. A particle density pro-file was then constructed using the data.
3.2 Field deployment
The instrument was deployed for ground-based ambient aerosol characterisation during the Ice in Clouds Experiment – Dust (ICE-D) project in August 2015. ICE-D was a multi-platform field campaign with the primary aims of studying aerosol–cloud interactions during the evolution of towering cumulus clouds over the sub-tropical Atlantic Ocean. The
project had significant aircraft and ground operations that in-volved the in situ characterisation of the properties of mineral dust advected from the Sahara region.
Ground-based aerosol characterisation took place at Praia International Airport, Santiago Island, Cabo Verde, from 27 July to 23 August 2015. The ground site comprised the Manchester aerosol container with a 30 m scaffold tower for ambient aerosol sampling. The tower supported a pumped in-let that was divided into heated lines inside the aerosol con-tainer, delivering ambient aerosol to a host of instruments, including the LAAP-TOF and an aerodynamic particle sizer (APS) (3321, TSI Inc.). The APS measures aerodynamic par-ticle diameters in the range 0.5–20 µm at a smpale flow rate of 1 L min−1.
Previous studies at this location have recorded a multi-modal aerosol size distribution with number concentrations in the size range 0.5–2.5 µm of between 2 and 100 cm−3for
clean maritime conditions and dust events respectively (Kan-dler et al., 2011). With an inlet flow rate of 0.078 L min−1,
the LAAP-TOF was required to accumulate mass spectra for 1–10 % of particles present during the ICE-D campaign in or-der to measure size-resolved composition at a temporal reso-lution of several particles per minute.
3.3 Instrument performance definitions
To characterise the instrument performance, we describe the elements that contribute to the efficiency of the instrument in each acquisition mode. An aerodynamic lens focusses parti-cles of different size and shape with different efficiency (Liu et al., 1995; Zhang et al., 2004). The transmission efficiency of the aerodynamic lens (EdLens) is defined as the propor-tion of spherical particles with physical diameterd that exit the expansion nozzle relative to the number of particles that passed the critical orifice, i.e. a measure of the losses that occur within the lens assembly and critical orifice holder.
On supersonic expansion into the low vacuum of the in-strument, a particle beam is formed whose solid angle of divergence relative to the lens axis defines a cross-sectional area at a set distance from the nozzle expansion. This area has a 2-D Gaussian probability density function (2DG-PDF) (Huffman et al., 2005). The probability of hitting a particle and obtaining a mass spectrum within this 2DG-PDF is de-fined as the hit rate efficiency (EHitd ) and is the product of the geometrical overlap of the excimer laser focal point with the particle beam (EdGeom), the temporal overlap of the peak UV laser power with the presence of a particle in ionisation the region (EdTemp), and the ionisation efficiency of the UV laser (EdIon) with respect to the particle composition (Erd-mann et al., 2005).
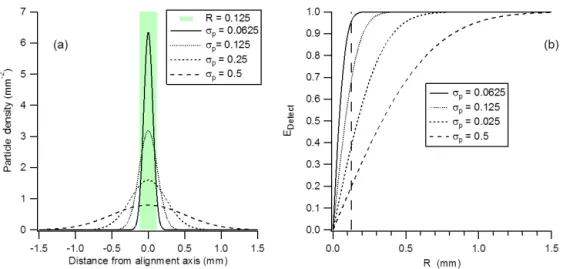
hit-Figure 3. (a)The overlap of detection beam with a theoretical effective detection radius (R) of 0.125 mm, with four normalised particle beams with widthsσp=0.0625, 0.125, 0.25, and 0.5. (b)The relationship of the effective detection radius (R) and detection efficiency (EDetect) for a range ofσpvalues.R=0.125 mm is marked for reference.
ting a particle and obtaining a mass spectrum in “second-laser-only” mode includes an extra term relating to the size-dependent optical detection efficiency (EdDetect). The hit rate is also modified with respect to free-firing mode because the termETempd is modified to a probability relating to the trigger delay and the size-dependent particle velocity. In addition, the active area of the UV ionisation is assumed to be larger than the active area of detection, so thatEGeomd =1 in this ac-quisition mode, providing the instrument is correctly aligned. We defined the overall efficiency of second-laser-only mode asETriggeredMSd , and using the definitions above it is defined by Eq. (1). Note that all terms have a particle size depen-dence.
ETriggeredMSd =ELensd ·EdDetect·EHitd (1) The third acquisition mode, referred to as “both lasers” in the software, involves the particle detection at both detection stage 1 and detection stage 2 so that the aerodynamic size of a particle can be measurement before the particle is ab-lated. The two detection stages will have different detection efficiencies because of slightly different geometries and dif-ferent particle beam widths related to the down-stream dis-tance from the nozzle of the aerodynamic lens. We defined the sampling efficiency in both-lasers mode asESizedMS.
3.4 Model of the optical detection geometry with a collimated detection beam
The portion of the divergent particle beam sampled by the or-thogonally incident detection laser defines an active area of detection, where the intensity of the radiation exceeds a mini-mum threshold (Imin) to produce enough scattered light from
the interaction of radiation with the particle for the detection system to register a particle event. The resulting efficiency of optical detectionEDetectis a function of the active area of
detection and the particle number density of the portion of the 2DG-PDF particle beam that it covers, which have a size and shape dependence. For simplicity, we modelled spherical particles, so the size dependence only was considered.
It has been shown that a 1-D Gaussian model is sufficient to quantify the amount of a particle beam blocked by a thin wire (Jayne et al., 2000; Huffman et al., 2005). In the case of optical particle detection by a collimated detection laser, we assumed that the detection beam is perfectly centred on the particle beam, so that the portion of the particle beam that was actively detected is the portion covered by an effective detection radius (R) in the radial direction (r) from the centre of the particle beam. The general relationship between par-ticle beam width (σp) andRin Eq. (2) was used to quantify EDetectfor a certain particle diameterd.
EDetectd =√2 π
R Z
0
eR2/2σp2dr
=erf √R
2σp
!
(2)
The relationship betweenR andEDetectis demonstrated in
Fig. 3 for several particle beam widths. AnEDetectof close to
1 is achieved whenR is equivalent to 3σpwidth. Note that,
whenR < σp, doubling theσp has the effect of halving the
detection efficiency. This loss of detection efficiency withσp
diminishes whenR > σp.
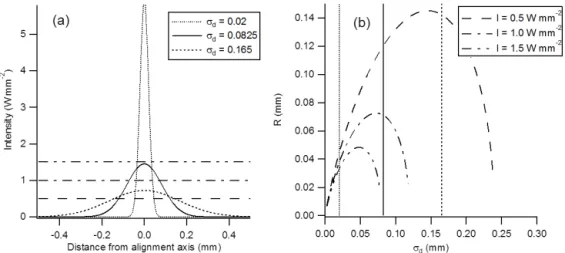
Figure 4. (a)Gaussian intensity distribution for collimated laser beams of fixed power focussed to detection beam width (σd) of 0.02, 0.0825, and 0.165.(b)The relationship of the effective detection radius (R) with respect to detection beam width(σdetect)forIminof 0.5, 1.0, and 1.5 W mm−2. The beam widths shown in the left panel are marked for reference.
R=σd
s
−ln
Imin σd√2π
·2 (3)
The effects of the relationship shown in Eq. (3) are two-fold. Firstly, the choice of detection beam width determines the active area of detection at a set Imin. Secondly,Imin has a
controlling influence on the portion of the collimated beam that will be active. Figure 4 demonstrates the relationship of R andσd for set values ofImin. In these examples, the
out-put power of the laser is constant but collimated to a range of σdbeam widths. For small detection beam widths, there
is a weak dependence on Imin as most of the density
pro-file exceeds the threshold (Fig. 4a). However, for larger de-tection beam widths, larger values of Rare produced at the expense of greaterImin-dependent variability (Fig. 4b). For
example, with a detection beam width ofσd=0.0825 mm, the effective detection radius (R) at an intensity threshold of 0.5 W mm−2is almost double that of an intensity
thresh-old of 1.0 W mm−2but will fail to detect particles with an Imin>1.25 W mm−2asR=0 mm.
The magnitude ofIminis a function of the scattering cross
section of the particle CSca and a transfer function K that
describes the minimum amount of power transfer to the de-tector required, and it accounts for the collection and transfer of light by the fibre optics, the radiant sensitivity of the de-tector, and the characteristics of the electronics in the trigger unit. The relationship betweenImin,K, andCScais shown in
Eq. (4). The transfer function is assumed to be the same for all particles (Jonsson et al., 1995), whileCSca has a strong
dependence on the size and refractive index of the material.
Imin=CK
Sca (4)
Figure 5.Values ofCscavs. particle diameter calculated from the
scattnlay algorithm for wavelengths used in commercially available lasers. Refractive index: 1.59; collection angle: 10–12◦.
For a given wavelength of incident light, Mie theory pro-vides an exact solution to the scattering of light by a sphere of known size and refractive index. The scattnlay algorithm (Peña and Pal, 2009) was used to model CSca for a
vari-ety of collection angles, particle sizes, and incident wave-lengths. Examples of howCScavaries with particle size and
wavelengths are demonstrated in Fig. 5. In these examples, the light collection is set at 10–12◦(representing detection stage 2), and the refractive index is 1.59. The wavelengths of commercially available laser systems are plotted.
4 Results
improve-ment in instruimprove-ment performance when the detection system with the collimated beam was implemented. Using these re-sults, along with a measurement of the particle beam width (Sect. 4.2), we calculated the value for the transfer function (K) described in the model by the empirical measurement of the required model parameters with a 600 nm PSL parti-cle. The method used for calculating the transfer function is described in Sect. 4.3.
The input of the transfer function into the numerical model of the optical detection geometry allowed the calculation of the effective detection radius (R) with respect to particle di-ameter across the transmission range of the instrument (0.2– 2.5 µm). The results of modelling the effect of different op-tical detection system design parameters onRare presented in Sect. 4.4. In Sect. 4.5 we use the modelled data to explain the differences between particle size distributions measured by the LAAP-TOF and those measured by the APS in ambi-ent data.
4.1 Instrument performance measurements
We directly measured the instrument performance in second-laser-only acquisition mode (ETriggeredMS) in the laboratory
by comparing size-selected number concentrations measured with a CPC with the number of mass spectra (cm−3)
gen-erated by the LAAP-TOF. Results of this measurement us-ing detection system A are shown in Fig. 6a. The data show a characteristically steep drop-off in ETriggeredMS for small
particles described by others for instruments operating in a similar acquisition mode (Cziczo et al., 2003, 2006). The minimum-sized particles that could be detected with the 405 nm diode system were 350 nm, and the maximum effi-ciency achieved was a little over 0.01 forETriggeredMS600 nm . For particle >600 nm, the efficiency decreases with increasing particle size so that ETriggeredMS800 nm =0.005. This result is in good agreement with LAAP-TOF detection efficiency data recently reported by Gemayel et al. (2016), who detected a minimum particle size of 350 nm, a peak detection efficiency of 0.025 at 450 nm, and decrease in sensitivity to particle with diameters of 800 nm.
To analyse the contributing factors to the reported effi-ciency, we examined the data for 600 nm spherical particles in more detail. It is well established that an aerodynamic lens can achieve an efficiency close to unity for the size range under examination here (20–600 nm) (Huffman et al., 2005; Williams et al., 2013); therefore, although the lens is unchar-acterised, we assumedE600 nmLens =1. It was observed that the vast majority of PSL particles that produced an optical trig-ger also produced a mass spectrum so thatE600 nmHit ≈1. With reference to Eq. (1), we concluded that as a first approxi-mation the observed performance was limited by the optical detection stage, i.e.ETriggeredMS600 nm ≈E600 nmDetect.
The calculated scattering cross section (Csca) for 405 nm
light is plotted against particle diameter for comparison with ETriggerd MS in Fig. 6a. At the small particle sizes (200–
Figure 6.Instrument performance measurements in “second-laser-only” acquisition mode (ETriggeredMSd ). Measurements are the com-parison of number concentration obtained by the CPC with the num-ber of mass spectra (cm−3) obtained by the LAAP-TOF when
sam-pling size-selected laboratory-generated PSL aerosol. The scatter-ing cross section (Csca) for the respective wavelength is plotted for reference.(a)Detection system A with theCscaprofile for 405 nm
light.(b)Detection system B with theCscaprofile for 532 nm light. The detection efficiencyEDetectof detection stage 2 is also plotted
in panel(b), which represents the number of trigger events gener-ated by the optical detection system.
600 nm) there is a correlation between the two curves, in-dicating that the low size cut-off in the sampling efficiency, in this case 350 nm, is limited by the scattering intensity of small particles. However, it is also clear thatCscafunction is
non-monotonic and will also affect the detection efficiency of larger particles, particularly in the region 700–900 nm as suggested by Gaie-Levrel et al. (2012) and Gemayel et al. (2016).
Cscaof small particles (200–800 nm) at 532 nm also
cor-relates with the sampling efficiency curve measured with detection system B (Fig. 6b). This method of detection laser delivery results in values of ETriggeredMS of an
or-der of magnitude higher than detection system A for par-ticles larger than 500 nm. There is evidence that EHit<1
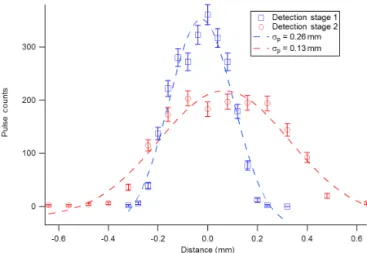
de-Figure 7.Gaussian particle beam profiles obtained using the optical characterisation method. Measurements were made using a beam of 600 nm PSL at detection stage 1 and detection stage 2 at a distance of 125 and 240 mm from the aerodynamic lens nozzle respectively. Error bars are 1σstandard errors, assuming Poisson statistics.
tection efficiency EDetect600 nm=0.19, indicating thatEHit600 nm= 0.79. The shift in the ETriggeredMS function with respect to
particle size when changing laser wavelength confirms that a more general caseETriggeredMSd ≈EDetectd for detection sys-tem A and that the observedE600 nmDetect > E800 nmDetect is an optical detection effect and not a lens transmission effect.
4.2 Particle beam width measurements
Measurements of the particle beam width were made with a particle beam created from the nebulisation of 600 nm sized PSLs using the optical characterisation method. The result-ing particle density profiles at detection stage 1 and detection stage 2 are shown in Fig. 7. Assuming the active area of de-tection is very small compared to the beam cross-sectional area, and that the focal point passes through the particle beam axis, a 1-D Gaussian curve fit is a sufficient approx-imation (Jayne et al., 2000). The beam width is estimated to beσp600 nm=0.13 mm at detection stage 1 (125 mm from the lens exit), and σp600 nm=0.26 mm at detection stage 2 (240 mm from the exit of the aerodynamic lens).
4.3 Derivation of the transfer function
A collimated detection laser beam, whose full 1/e2width of 330 µm (equivalent to σd≈0.0825 mm) exceedsImin,
tran-secting aσp600 nm=0.26 mm wide particle beam would the-oretically give an optical detection efficiencyEDetect600 nm=0.53 (Eq. 2). This value is significantly higher than the measured value of 0.19. The most likely explanation is that with 600 nm diameter spherical particles the effective detection radius (R) is significantly less than the 1/e2beam diameter because the intensity threshold of detection is only exceeded by a portion of the Gaussian beam profile.
We used the model of the optical detection geometry to calculate the transfer function (K). Using Eq. (2) and the empirically derived valuesEDetect600 nm=0.19 andσp600 nm= 0.26 mm, the calculated value of Rdetect600 =0.057 mm. From Eq. (3), this value of R in a detection beam width σd=0.0825 mm corresponds to laser beam intensity (Imin)
of 1.1 W mm2. Using Eq. (4) and a C
sca value of
5.066×10⁻⁸mm−2derived from a scattnlay calculation, the
value of the transfer function (K) is 5.59×10⁻⁸W.
The calculation of the transfer function allows R to be plotted as a function of particle size across the particle trans-mission size range by calculatingIminfor any particle
diam-eter using the corresponding valueCscain Eq. (3).
4.4 Estimations of the effective detection beam radius with selected wavelengths, collection angles, and signal-to-noise conditions.
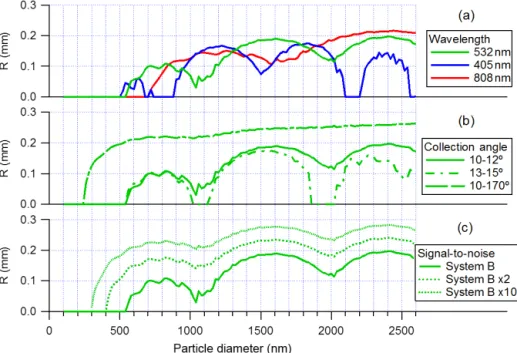
The model allows for the evaluation of the effective detec-tion radius (R) with respect to particle size with selected optical detection stage design parameters. Results of mod-elling the design parameters used in detection system B with PSL particles across the theoretical transmission range of the aerodynamic lens are represented by the solid green line in Fig. 8a, b, and c. The design parameters used are wave-length=532 nm, collection angle=10–12◦, detection beam width σd=0.0825 mm, and a refractive index of 1.59 for
PSL was used in the scattnlay model for Mie scattering. The data predict a rapid drop-off inRwhen the particle diameter is less than≈550 nm. Oscillations of the scattering phase function with respect to particle size impact R across the transmission range, with distinct minima observed at 1 and 2 µm particle diameter.
The effect of changing the detection laser wavelength is demonstrated in Fig. 8a. The model predicts that using a detection system laser wavelength of 405 nm results in a lower particle size cut-off (R=0) as expected. In general, shorter wavelengths produce deeper oscillations at a higher frequency than longer wavelengths. A wavelength of 808 nm produces the most stable profile but comes at the expense of the small particle detection, which drops-off at 700 nm.
The effect of light collection angle was modelled by changing the input parameters to the scattnlay algorithm. Light collected over 10–170◦, which is similar to the col-lection angle of some elliptical mirrors (Pratt et al., 2009; Brands et al., 2011), produces a smoother profile with a lower particle size cut-off than the narrow angles represented by the LAAP-TOF detection system (Fig. 8b). This is because collecting more light increases the integrated phase function and requires less intensity in the detection beam in order to exceedImin. The variation inRstabilises near the maximum
attainable value if the value ofRis close to the 3σpdetection
Figure 8.Results of modelling the optical detection geometry with selected design configurations, showing the calculated effective detection radius (R) with respect to particle diameter for PSL particles (refractive index=1.59). Profiles are modelled by changing only one parameter with respect to the design of detection system B, which is shown as a solid green line in each plot for reference. The reference configuration of detection system B isσd=0.0825 mm, wavelength=532 nm, and a light collection angle of 10–12◦.(a)The effect of using detection laser wavelengths 405 and 808 nm,(b)the effect of light collection angle of 13–15 and 10–170◦,(c)the effect of improving the signal-to-noise ratio of detection system B twofold (×2) and 10-fold (×10).
This is not thought to be the actual case for the system as the front optics have a lower background noise than the rear optics and so will have a lower value of the transfer function, producing smaller amplitude variation in the profile.
Adjusting the value of the transfer function in the model allows for the simulation of the impact of signal-to-noise ra-tio on R. This is important as signal-to-noise ratio can be affected by alignment of the system during set-up as well as the design of the detection stage. Increasing the signal-to-noise ratio by a factor of 2 and by a factor of 10 is simulated in Fig. 8c. In general, a larger signal-to-noise ratio produces a largerR over the transmission range and reduces the low particle cut-off size. However, it does not reduce the ampli-tude of oscillation in theRfunction as much as changing the collection angle.
The choice of optical lens determines the width of the beam waist of the collimated beam. With a set laser power output, increasing the beam waist width has the effect of reducing the intensity at a given radial distance from the beam axis. Results of modelling ofIminwith respect toσd
shown in Fig. 4 demonstrate that a common maximum R does not exist for the variableImin. This indicates a particle
size dependence in the optimal σdvalue with this detection
geometry. This effect is quantified in Fig. 9a, which shows the variation in R as a function of σd and particle
diame-ter. Small focal points give the least variation with respect to particle size but produce a relatively small effective beam
radius (R<0.1 mm). Values ofR can be produced that ex-ceed 0.6 mm but come at the expense of very high variation with respect to particle size that causes blind areas at 1000 and 2000 nm particle diameter due to an effective detection radius of 0 mm.
4.5 Comparison of the estimated effective beam radius with ambient measurements of particle size distributions
The results of modelling the effective detection radius are compared to the particle counting statistics from the mea-surement of polydisperse aerosol populations at the ambient measurement site. The size-resolved composition measure-ment of 99 463 particles obtained over a 7-day period were analysed using the LAAP-TOF Data Analysis tool (v1.0.0, AeroMegt GmbH). In order to analyse the particle count-ing statistics of the principal particle composition types, the mass spectra were placed into six classes using the fuzzy c-mean clustering algorithm provided in the software. An Ep-silon target value of 1e−7and a fuzzyfier value of 1.2 were
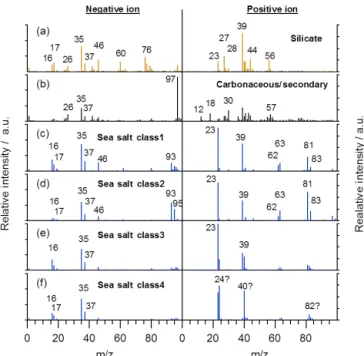
chosen. Mass spectra representing the cluster centres of each class are shown in Fig. 10.
Figure 9.Model of the effective detection beam radius as a func-tion of particle size and collimated beam waist size.(a)A detection system comprising 300 mW and a wavelength of 532 nm, with light collection 10–12◦, and(b)a detection system comprising equally mixed 532 and 808 nm laser sources.
[SiO2]−,m/z -76[SiO3]−) in negative-ion mode. In
addi-tion, there are markers for chlorine (m/z−35,−37), nitrate (m/z−46), and sulphate (m/z−97), indicating that these sil-icate mineral particles are internally mixed with secondary species. The second class (Fig. 10b) is dominated by the same secondary species in negative-ion mode and shows the presence of ammonium (m/z18), nitrate (m/z30), and car-bon clusters (m/z12, 24, 36) in positive-ion mode. We have designated the name carbonaceous/secondary to the second particle class.
The remaining four particle classes (Fig. 10c–f) are dom-inated by potassium (m/z 39), sodium (m/z 23), chlorine (m/z −35,−37), and sodium chloride clusters (m/z81, 83
[Na2Cl]+, m/z −93, −95 [NaCl2]−). We identified these
particles as sea salt class (1–4). The presence of a peak at m/z 24, 40, and 82 in sea salt class 3 and 4 is the result of spectral peak broadening and peak position shift in the raw positive-ion spectra. The presence of water in these particles (m/z−16 and−17, andm/z62[Na2O]+and 63[Na2OH]+)
indicates that these particles are likely to be aqueous droplets (Dall’Osto et al., 2004). As the differentiation of these sea salt classes by the fuzzy clustering is likely to result from changes in instrument function rather than compositional dif-ferences in the particle, we combined all four classes into one sea salt class when considering particle counting statistics.
A 10 min averaged time series of the clustered particle number concentrations over a 7-day period is shown in Fig. 11 alongside number concentration reported by the APS system in the size range 0.5–2.46 µm aerodynamic diame-ter. The LAAP-TOF total number concentration is approx-imately 2 order of magnitude lower than that reported by
Figure 10.Representative spectral patterns of the cluster centres(a– f)produced by fuzzy c-means cluster analysis of ambient data ac-quired at Praia, Cabo Verde, during the ICE-D campaign in Au-gust 2015.
the APS. The time series trends are generally well corre-lated over the first 4 days, with divergence occurring after the arrival of silicate dust from the Sahara around midnight on 11 August 2015, indicating that the LAAP-TOF may be under-counting the silicate class of particles with respect to the sea salt class of particle. Overall, the combined sea salt particles class accounted for 86 % of the particles analysed by the LAAP-TOF during this sampling period (Fig. 11 in-set).
The dominance of the sea salt class of particle in the LAAP-TOF measurement is also evident in the vacuum aero-dynamic size distributions displayed in Fig. 12a. The size distribution of the sea salt class accounts for most of the observed sized distribution of the LAAP-TOF total num-ber concentration, with the contribution from the silicate and carbonaceous/secondary classes only significant<1000 nm. The aerodynamic size distribution reported by the APS shows a relatively broad mode centred on≈1200 nm that is more similar to the silicate and carbonaceous/secondary par-ticle classes than to the sea salt class. This supports the hy-pothesis that the sea salt class is over-represented in the rel-ative particle number concentration measured by the LAAP-TOF, although differences in the measurement techniques of the two instruments must be considered.
Figure 11. Time series of averaged number concentrations mea-sured by the LAAP-TOF and APS for a 7-day period at Praia, Cabo Verde, during the ICE-D campaign. Concentrations are calculated from 10 min averaged number counts at a flow rate of 0.078 and 1 L min−1for the LAAP-TOF and APS respectively. The calculated
concentrations of sea salt, carbonaceous/secondary material, and silicates (as determined by fuzzy c-means clustering) are stacked in the time series so that total number concentration measured by the LAAP-TOF is represented by the top of the filled area. The relative number concentrations of the main particle classes are displayed in the inset pie chart.
this local minimum in the size distribution coincides with a local minimum in theR profile. However, this minimum is not observed in the size distribution for the sea salt class. The light-scattering properties of marine aerosol are known to vary considerably with composition and humidity (Tang et al., 1997). If the value ofRwith respect to particle diame-ter is modelled with a particle refractive index of an aqueous sea salt particle (1.33), a significantly different R profile is predicted that does not contain a local minimum at around 1000 nm (Fig. 12c).
5 Discussion
In the model of the optical detection geometry we describe the optical detection efficiency in terms of the overlap of the detection beam with the particle beam. The Gaussian profile of the detection laser beam results in a particle-dependent variation in the effective beam width, which we term the ef-fective detection radius (R). For a certain instrument design, R is a function of the scattering cross section of the parti-cle, resulting in a particle size dependence. Instrument design parameters such as the detection laser wavelength, the light collection angle, and the signal-to-noise level in the detection stage have a strong influence onR.
Ambient measurements demonstrate the impact that the variation in the effective detection radius may have on the data. Comparison with the size distribution measured with the APS suggests that a size-dependent detection bias is im-posed on the measured size distributions. Furthermore, the
particle refractive index appears to have a strong influence on this detection bias, which further complicates the interpre-tation of size distributions. Overall, the LAAP-TOF reports particle concentration in the size range 0.5–2.5 µm, which is approximately 2 orders of magnitude lower than those re-ported by the APS. Much of this deficit in particle counting may be accounted for by composition-dependent ionisation efficiency on the ion source and a reduction in optical de-tection efficiency due to particle beam divergence. However, the optical detection efficiency must also be influenced by the size-dependent variation in the effective detection radius. For example, the coincidence of a maximum inR with the mode size of the sea salt class of particles will enhance the number counting statistics of those particle types.
Optical detection of particles in SPMS has been the focus of much research (Murphy, 2007). Early instruments used fibre optics to guide scattered light to PMTs for detection (Prather et al., 1994; Hinz and Kaufmann, 1996). The intro-duction of an ion source extraction plate fashioned into an elliptical mirror (Murphy and Thomson, 1995) allowed light to be collected over a wider solid angle within the ion source whilst maintaining relatively high hit rates, but this approach is not amenable to a bipolar TOF analyser due to extraction field distortion. The removal of the detection optics from the ion source region permitted a more complete elliptical mirror to be used (Gard et al., 1997) but required a more complex trigger system to ensure the UV ablation laser hits particles travelling at different velocities.
The aim of using elliptical mirrors is to collect as much scattered light as practicable over a wide solid angle. The benefit of this approach is demonstrated in the model results that calculateRto be close to the 3σdwidth across much of
the transmission range. Authors have reported detection effi-ciencies of 0.5–1 for instruments using this type of collection optics (Su et al., 2004; Zelenyuk and Imre, 2005; Zelenyuk et al., 2009; Brands et al., 2011) over selected size ranges, typically 200–600 nm. Hit rates are generally lower with in-struments that do not trigger in the ion source, and overall sampling efficiency is rarely reported in the literature.
An ideal instrument design would have optical detection in the ion source of a bipolar TOF while maintaining the optical detection efficiency of an elliptical mirror. This is very diffi-cult to achieve in practice. The compact design of the light collection optics in the LAAP-TOF allows for the detection stage to be placed in the ion source but collects light over a very narrow solid angle. Our initial laboratory studies with detection system A showed a low detection efficiency in the size range 300–800 nm, which was a limiting factor in the overall instrument performance.
Laser diode light sources have relatively low power and produce a relatively divergent beam that can be difficult to focus with a single lens. The implementation of a 532 nm Nd:YAG laser with high pointing stability allowed for single-mode fibre coupling and efficient collimation to a larger beam waist diameter compared to the focal point of
de-tection system A. The implementation of dede-tection sys-tem B resulted in over an order-of-magnitude improvement inETriggeredMScompared to detection system A, but it came
at the expense of a slightly larger particle size cut-off. Larger beam diameters have the potential to increase the detection efficiency for some particle sizes. However, modelling of the effective beam diameter shows that, for a set laser power out-put, the optimum detection laser beam width is particle size dependent (Fig. 9a). The particle size distribution of the tar-get application must be considered when choosing the out-put power and focussing characteristics of the detection laser system if using light collection optics with a narrow collec-tion angle.
Optical particle detection is an established technique in in-struments dedicated to measuring particle size distributions of ambient aerosol populations (Baumgardner et al., 2011). The smoothing of Mie scattering oscillation is a design re-quirement when accurate particle size measurement requires a near-monotonic response in pulse magnitude with respect to particle diameter (McMurry, 2000). Instruments utilising monochromatic laser source require a wide collection angle, whereas a monotonic response has been reported for a near-forward scattering instrument using an incandescent (white-light) source (Heim et al., 2008).
A detection laser consisting of mixed wavelengths may be beneficial to the near-forward light collection system utilised in the LAAP-TOF. The Mie theory model (Fig. 5) indicates that 532 nm may complement 808 nm by covering the deep oscillation in the profile. The mixing of light from two dis-tinct sources is possible with a fibre-coupled system. Fig-ure 9b shows an example of the modelledR with respect to particle size and detection beam width using equal pow-ered 532 and 808 nm wavelength sources whilst maintain-ing the signal-to-noise characteristics of detection system B. This model shows less variation inRwith respect to particle size and offers the possibility of using largerσd, which would
improve the overall sampling efficiency.
6 Conclusions
The laser intensity encountered by a particle in a colli-mated laser beam is a function of its position within the Gaussian intensity distribution with respect to the laser beam axis. A transfer function was calculated in order to quantify the minimum intensity requirement which defines an effec-tive detection radius (R) that is a function of the scattering cross section (Csca) of the particle. The model predicts that Cscacontrols the limit of the detection in terms of particle
size as expected. However, if light is collected over a narrow collection angle, Mie interference patterns result in an oscil-lation ofRwith respect to particle size across the transmis-sion range (0.2–2.5 µm) of the LAAP-TOF, resulting in large particle-size-dependent variation in detection efficiency. We compare the model prediction with an ambient data set ac-quired during the ICE-D project, a multi-platform field cam-paign based at the Cabo Verde islands in August 2015. The model is used to partly explain a detection bias towards sea salt particles with an aerodynamic size mode of ≈1.5 µm. We also show that the detection bias imposes itself on the measured aerodynamic size distribution as determined by the instrument, an effect that must be considered when interpret-ing the data.
Modelling of the effective detection radius shows that for a set laser power output the optimum detection laser beam width is also particle size dependent. The particle size dis-tribution of the target application must be considered when choosing the output power and focussing characteristics of the detection laser system if using light collection optics with a narrow collection angle. Variations in the effective detec-tion radius could be minimised by collecting light over a wider angle or by mixing laser wavelengths. The stabilisation of R with respect to particle diameter would result in more accurate aerodynamic size distribution measurements and re-duce the variation in particle number concentration measure-ments of different particle size, shape, and refractive index. A more rigorous evaluation of the effective of particle size and morphology on the overall sampling efficiency of the instru-ment would require a model of the aerodynamic lens charac-teristics in order to constrain particle beam divergence. The effect of particle beam divergence on both the variation and absolute sampling efficiency could be improved by reducing the length of the particle flight path by shortening the vacuum housing.
7 Data availability
Appendix A: List of symbols Symbol Description
d Particle diameter.
σp Particle beam width. σd Detection beam width. Csca Scattering cross section. R Active radius of detection.
Imin Minimum intensity threshold
re-quired to produce enough scattered light to register a particle event. K Transfer function of the optical
de-tection stage.
ELens Transmission efficiency of the
aero-dynamic lens. EHit Hit rate efficiency.
EDetect The particle detection efficiency of
the optical detection stage.
EGeom Geometric overlap of the excimer
laser pulse with the particle beam. ETemp Temporal overlap of the excimer
laser pulse with a particle in the particle beam.
EIon Ionisation efficiency of the excimer
laser pulse with respect to the particle composition.
EAutoMS Instrument sampling efficiency in
auto-triggering acquisition mode. The excimer laser is firing at a set repetition rate.
ETriggeredMS Instrument sampling efficiency
in second-laser-only acquisition mode.
The excimer laser is fired by a trig-ger from the second detection stage. ESizedMS Instrument sampling efficiency in
both-lasers acquisition mode. The instrument actively sizes and requires a trigger from both detec-tion stages.
Appendix B: Detailed description of detection systems Detection system A comprises a compact 450 mW Op-next diode module (HL40023MG, Thorlabs) mounted in a threaded copper tube and fitted to an adjuster assembly to produce a cw laser beam of 405 nm wavelength orthogonal to the particle beam axis (Fig. 2a). The adjuster assembly incor-porates a focussing lens to create a beam with aD4σ(second moment width) focal point diameter of 51.2 µm measured with a beam profiler at a focal length of 50 mm. The power output of the system can be adjusted by varying the drive to the diode module. The position of the focal point relative to the particle beam can be adjusted by moving the whole adjuster assembly relative to the vacuum housing in the hori-zontalXandY directions and varying the focal length in the Zdirection.
Detection system B comprises a 1 W GEM 532 nm Nd:YAG laser (Laser Quantum Ltd) with divergence <0.8 mrad, pointing stability <10 µrad/0C, and a beam
Acknowledgements. This work was supported by a PhD
stu-dentship awarded to N. Marsden by the Natural Environment Research Council (NERC). Field measurements made during the ICE-D campaign were funded by NERC grant NE/M00195/1. We would like to thank Alisdair Macpherson of the Photon Science Institute at the University of Manchester for his technical support.
Edited by: J. Schneider
Reviewed by: two anonymous referees
References
Allen, J. O., Fergenson, D. P., Gard, E. E., Hughes, L. S., Morrical, B. D., Kleeman, M. J., Gross, D. S., Gälli, M. E., Prather, K. A., and Cass, G. R.: Particle detection efficiencies of aerosol time of flight mass spectrometers under ambient sampling conditions, Environ. Sci. Technol., 34, 211–217, 2000.
Baumgardner, D., Brenguier, J., Bucholtz, A., Coe, H., DeMott, P., Garrett, T., Gayet, J., Hermann, M., Heymsfield, A., Korolev, A., Krämer, M., Petzold, A., Strapp, W., Pilewskie, P., Taylor, J., Twohy, C., Wendisch, M., Bachalo, W., and Chuang, P.: Airborne instruments to measure atmospheric aerosol particles, clouds and radiation: A cook’s tour of mature and emerging technology, Atmos. Res., 102, 10–29, doi:10.1016/j.atmosres.2011.06.021, 2011.
Boucher, O., Randall, P., Artaxo, P., Bretherton, C., Feingold, G., Forster, P., Kerminen, V., Kondo, Y., Liao, H., Lohmann, U., Rasch, P., Satheesh, S, K., Sherwood, S., Stevens, B., and Zhang, X. Y.: Clouds and Aerosols, Climate Change 2013: The Physi-cal Science Basis. Contribution of Working Group I to the Fifth Assessment Report of the Intergovernmental Panel on Climate Change, 2013.
Brands, M., Kamphus, M., Böttger, T., Schneider, J., Drewnick, F., Roth, A., Curtius, J., Voigt, C., Borbon, A., Beekmann, M., Bourdon, A., Perrin, T., and Borrmann, S.: Charac-terization of a Newly Developed Aircraft-Based Laser Ab-lation Aerosol Mass Spectrometer (ALABAMA) and First Field Deployment in Urban Pollution Plumes over Paris During MEGAPOLI 2009, Aerosol Sci. Tech., 45, 46–64, doi:10.1080/02786826.2010.517813, 2011.
Cziczo, D. J., DeMott, P. J., Brock, C., Hudson, P. K., Jesse, B., Kreidenweis, S. M., Prenni, A. J., Schreiner, J., Thomson, D. S., and Murphy, D. M.: A Method for Single Particle Mass Spectrometry of Ice Nuclei, Aerosol Sci. Tech., 37, 460–470, doi:10.1080/02786820300976, 2003.
Cziczo, D. J., Thomson, D. S., Thompson, T. L., DeMott, P. J., and Murphy, D. M.: Particle analysis by laser mass spec-trometry (PALMS) studies of ice nuclei and other low num-ber density particles, Int. J. Mass Spectrom., 258, 21–29, doi:10.1016/j.ijms.2006.05.013, 2006.
Dall’Osto, M., Beddows, D., Kinnersley, R. P., Harrison, R. M., Donovan, R. J., and Heal, M. R.: Characterization of individ-ual airborne particles by using aerosol time-of-flight mass spec-trometry at Mace Head, Ireland, J. Geophys. Res.-Atmos., 109, D21302, doi:10.1029/2004JD004747, 2004.
Dall’Osto, M., Harrison, R. M., Highwood, E. J., O’Dowd, C., Ce-burnis, D., Querol, X., and Achterberg, E. P.: Variation of the
mixing state of Saharan dust particles with atmospheric trans-port, Atmos. Environ., 44, 3135–3146, 2010.
Dall’Osto, M., Hellebust, S., Healy, R. M., O’Connor, I. P., Kourtchev, I., Sodeau, J. R., Ovadnevaite, J., Ceburnis, D., O’Dowd, C. D., and Wenger, J. C.: Apportionment of urban aerosol sources in Cork (Ireland) by synergistic measurement techniques, Sci. Total Environ., 493, 197–208, 2014.
Erdmann, N., Dell’Acqua, A., Cavalli, P., Grüning, C., Omenetto, N., Putaud, J.-P., Raes, F., and Dingenen, R. V.: Instrument Char-acterization and First Application of the Single Particle Analysis and Sizing System (SPASS) for Atmospheric Aerosols, Aerosol Sci. Tech., 39, 377–393, doi:10.1080/027868290935696, 2005. Fitzgerald, E., Ault, A. P., Zauscher, M. D., Mayol-Bracero, O. L.,
and Prather, K. A.: Comparison of the mixing state of long-range transported Asian and African mineral dust, Atmos. Environ., 115, 19–25, 2015.
Formenti, P., Schütz, L., Balkanski, Y., Desboeufs, K., Ebert, M., Kandler, K., Petzold, A., Scheuvens, D., Weinbruch, S., and Zhang, D.: Recent progress in understanding physical and chem-ical properties of African and Asian mineral dust, Atmos. Chem. Phys., 11, 8231–8256, doi:10.5194/acp-11-8231-2011, 2011. Gaie-Levrel, F., Perrier, S., Perraudin, E., Stoll, C., Grand, N.,
and Schwell, M.: Development and characterization of a sin-gle particle laser ablation mass spectrometer (SPLAM) for organic aerosol studies, Atmos. Meas. Tech., 5, 225–241, doi:10.5194/amt-5-225-2012, 2012.
Gard, E., Mayer, J. E., Morrical, B. D., Dienes, T., Fergen-son, D. P., and Prather, K. A.: Real-Time Analysis of In-dividual Atmospheric Aerosol Particles: Design and Perfor-mance of a Portable ATOFMS, Anal. Chem., 69, 4083–4091, doi:10.1021/ac970540n, 1997.
Gemayel, R., Hellebust, S., Temime-Roussel, B., Hayeck, N., Van Elteren, J. T., Wortham, H., and Gligorovski, S.: The perfor-mance and the characterization of laser ablation aerosol par-ticle time-of-flight mass spectrometry (LAAP-ToF-MS), At-mos. Meas. Tech., 9, 1947–1959, doi:10.5194/amt-9-1947-2016, 2016.
Giorio, C., Tapparo, A., Dall’Osto, M., Beddows, D. C., Esser-Gietl, J. K., Healy, R. M., and Harrison, R. M.: Local and regional com-ponents of aerosol in a heavily trafficked street canyon in central London derived from PMF and cluster analysis of single-particle ATOFMS spectra, Environ. Sci. Technol., 49, 3330–3340, 2015. Gross, D. S., Gälli, M. E., Silva, P. J., and Prather, K. A.: Rela-tive sensitivity factors for alkali metal and ammonium cations in single-particle aerosol time-of-flight mass spectra, Anal. Chem., 72, 416–422, 2000.
Healy, R. M., Sciare, J., Poulain, L., Kamili, K., Merkel, M., Müller, T., Wiedensohler, A., Eckhardt, S., Stohl, A., Sarda-Estève, R., McGillicuddy, E., O’Connor, I. P., Sodeau, J. R., and Wenger, J. C.: Sources and mixing state of size-resolved elemental carbon particles in a European megacity: Paris, Atmos. Chem. Phys., 12, 1681–1700, doi:10.5194/acp-12-1681-2012, 2012.
Heim, M., Mullins, B. J., Umhauer, H., and Kasper, G.: Perfor-mance evaluation of three optical particle counters with an ef-ficient ”multimodal” calibration method, J. Aerosol Sci., 39, 1019–1031, doi:10.1016/j.jaerosci.2008.07.006, 2008.
Real-time Laser Mass Spectrometry, Aerosol Sci. Tech., 24, 233–242, 1996.
Hinz, K.-P. and Spengler, B.: Instrumentation , data evaluation and quantification in on-line aerosol mass spectrometry, J. Mass Spectrom., 42, 843–860, doi:10.1002/jms.1262, 2007.
Hinz, K.-P., Erdmann, N., Grüning, C., and Spengler, B.: Compar-ative parallel characterization of particle populations with two mass spectrometric systems LAMPAS 2 and SPASS, Int. J. Mass Spectrom., 258, 151–166, doi:10.1016/j.ijms.2006.09.008, 2006. Hudson, J. G., Noble, S., and Jha, V.: On the relative role of sea salt cloud condensation nuclei (CCN), J. Atmos. Chem., 68, 71–88, doi:10.1007/s10874-011-9210-5, 2011.
Huffman, J. A., Jayne, J. T., Drewnick, F., Aiken, A. C., Onasch, T., Worsnop, D. R., and Jimenez, J. L.: Design, Modeling, Optimiza-tion, and Experimental Tests of a Particle Beam Width Probe for the Aerodyne Aerosol Mass Spectrometer, Aerosol Sci. Tech., 39, 1143–1163, doi:10.1080/02786820500423782, 2005. Jayne, J. T., Leard, D. C., Zhang, X., Davidovits, P., Smith,
K. A., Kolb, C. E., and Worsnop, D. R.: Development of an Aerosol Mass Spectrometer for Size and Composition Anal-ysis of Submicron Particles, Aerosol Sci. Tech., 33, 49–70, doi:10.1080/027868200410840, 2000.
Jonsson, H. H., Wilson, H. C., and Brock, R. G.: Performance of a focused cavity aerosol spectrometer for measurements in the stratosphere of particle size in the 0.06–2.0 µm diamater range, American Meteorological Society, 12, 115–129, 1995.
Kandler, K., Lieke, K., Benker, N., Emmel, C., Küpper, M., MÜller-Ebert, D., MÜller-Ebert, M., Scheuvens, D., Schladitz, A., Schütz, L., and Weinbruch, S.: Ground-based off-line aerosol measure-ments at Praia, Cape Verde, during the Saharan Mineral Dust Experiment: Microphysical properties and mineralogy, Chemi-cal and PhysiChemi-cal Meteorology, 63, 459–474, doi:10.1111/j.1600-0889.2011.00546.x, 2011.
Kane, D. B. and Johnston, M. V.: Size and composition biases on the detection of individual ultrafine particles by aerosol mass spec-trometry, Environ. Sci. Technol., 34, 4887–4893, 2000. Liu, P., Ziemann, P. J., Kittelson, D. B., and McMurry, P. H.:
Gen-erating particle beams of controlled dimensions and divergence: II. Experimental evaluation of particle motion in aerodynamic lenses and nozzle expansions, Aerosol Sci. Tech., 22, 314–324, 1995.
McMurry, P. H.: A review of atmospheric aerosol measurements , Atmos. Environ., 34, 1959–1999, 2000.
Middlebrook, A. M., Murphy, D. M., Lee, S.-H., Thomson, D. S., Prather, K. A., Wenzel, R. J., Liu, D.-Y., Phares, D. J., Rhoads, K. P., Wexler, A. S., et al.: A comparison of particle mass spec-trometers during the 1999 Atlanta Supersite Project, J. Geophys. Res.-Atmos., 108, 8424, doi:10.1029/2001JD000660, 2003. Moffet, R. C. and Prather, K. A.: In-situ measurements of the
mix-ing state and optical properties of soot with implications for ra-diative forcing estimates, P. Natl. Acad. Sci. USA, 106, 11872– 11877, doi:10.1073/pnas.0900040106, 2009.
Murphy, D. M.: The Design of Single Particle Mass Spectrome-ters, Mass Spectrom. Rev., 26, 150–165, doi:10.1002/mas.20113, 2007.
Murphy, D. M. and Thomson, D. S.: Laser Ionization Mass Spec-troscopy of Single Aerosol Particles, Aerosol Sci. Tech., 22, 237– 249, doi:10.1080/02786829408959743, 1995.
Murphy, D., Cziczo, D., Hudson, P., Schein, M., and Thomson, D.: Particle density inferred from simultaneous optical and aerody-namic diameters sorted by composition, J. Aerosol Sci., 35, 135– 139, doi:10.1016/S0021-8502(03)00386-0, 2004.
Nash, D. G., Baer, T., and Johnston, M. V.: Aerosol mass spectrom-etry: An introductory review, Int. J. Mass Spectrom., 258, 2–12, doi:10.1016/j.ijms.2006.09.017, 2006.
Peña, O. and Pal, U.: Scattering of electromagnetic radiation by a multilayered sphere, Comput. Phys. Commun., 180, 2348–2354, doi:10.1016/j.cpc.2009.07.010, 2009.
Petrucci, G., Farnsworth, P., Cavalli, P., and Omenetto, N.: A dif-ferentially pumped particle inlet for sampling of atmospheric aerosols into a time-of-flight mass spectrometer: Optical charac-terization of the particle beam, Aerosol Sci. Tech., 33, 105–121, doi:10.1080/027868200410877, 2000.
Pope, C. A. and Dockery, D. W.: Health Effects of Fine Particulate Air Pollution : Lines that Connect, J. Air Waste Manage., 56, 709–742, 2006.
Prather, K. A., Nordmeyer, T., and Salt, K.: Real-time Char-acterization of Individual Aerosol Particles Using Time-of-Flight Mass Spectrometry, Anal. Chem., 66, 1403–1407, doi:10.1021/ac00081a007, 1994.
Pratt, K. A. and Prather, K. A.: Aircraft measurements of vertical profiles of aerosol mixing states, J. Geophys. Res., 115, D11305, doi:10.1029/2009JD013150, 2010.
Pratt, K. A., Mayer, J. E., Holecek, J. C., Moffet, R. C., Sanchez, R. O., Rebotier, T. P., Furutani, H., Gonin, M., Fuhrer, K., Su, Y., Guazzotti, S., and Prather, K. A.: Development and characteriza-tion of an aircraft aerosol time-of-flight mass spectrometer, Anal. Chem., 81, 1792–1800, doi:10.1021/ac801942r, 2009.
Reilly, P. T. A., Lazar, A. C., Gieray, R. A., Whitten, W. B., and Ramsey, J. M.: The Elucidation of Charge-Transfer-Induced Ma-trix Effects in Environmental Aerosols Via Real-Time Aerosol Mass Spectral Analysis of Individual Airborne Particles, Aerosol Sci. Tech., 33, 135–152, doi:10.1080/027868200410895, 2000. Reinard, M. S. and Johnston, M. V.: Ion formation
mech-anism in laser desorption ionization of individual nanoparticles, J. Am. Soc. Mass Spectr., 19, 389–399, doi:10.1016/j.jasms.2007.11.017, 2008.
Reitz, P., Spindler, C., Mentel, T. F., Poulain, L., Wex, H., Milden-berger, K., Niedermeier, D., Hartmann, S., Clauss, T., Stratmann, F., Sullivan, R. C., DeMott, P. J., Petters, M. D., Sierau, B., and Schneider, J.: Surface modification of mineral dust particles by sulphuric acid processing: implications for ice nucleation abili-ties, Atmos. Chem. Phys., 11, 7839–7858, doi:10.5194/acp-11-7839-2011, 2011.
Sierau, B., Chang, R. Y.-W., Leck, C., Paatero, J., and Lohmann, U.: Single-particle characterization of the high-Arctic summertime aerosol, Atmos. Chem. Phys., 14, 7409–7430, doi:10.5194/acp-14-7409-2014, 2014.
Su, Y., Sipin, M. F., Furutani, H., and Prather, K. A.: Development and Characterization of an Aerosol Time-of-Flight Mass Spec-trometer with Increased Detection Efficiency, Anal. Chem., 76, 712–719, doi:10.1021/ac034797z, 2004.
Sullivan, R. C., Guazzotti, S. A., Sodeman, D. A., and Prather, K. A.: Direct observations of the atmospheric processing of Asian mineral dust, Atmos. Chem. Phys., 7, 1213–1236, doi:10.5194/acp-7-1213-2007, 2007.
Tang, I. N., Tridico, A. C., and Fung, K. H.: Thermodynamic and optical properties of sea salt aerosols, J. Geophys. Res.-Atmos., 102, 23269–23275, 1997.
Thomson, D. S., Schein, M. E., and Murphy, D. M.: Par-ticle analysis by laser mass spectrometry WB-57F in-strument overview, Aerosol Sci. Tech., 33, 153–169, doi:10.1080/027868200410903, 2000.
Trimborn, A., Hinz, K. P., and Spengler, B.: Online Anal-ysis of Atmospheric Particles with a Transportable Laser Mass Spectrometer, Aerosol Sci. Tech., 33, 191–201, doi:10.1080/027868200410921, 2000.
Vaden, T. D., Imre, D., Beránek, J., and Zelenyuk, A.: Extending the Capabilities of Single Particle Mass Spectrometry: II. Measure-ments of Aerosol Particle Density without DMA, Aerosol Sci. Tech., 45, 125–135, doi:10.1080/02786826.2010.526156, 2011. Williams, L. R., Gonzalez, L. A., Peck, J., Trimborn, D.,
McIn-nis, J., Farrar, M. R., Moore, K. D., Jayne, J. T., Robinson, W. A., Lewis, D. K., Onasch, T. B., Canagaratna, M. R., Trimborn, A., Timko, M. T., Magoon, G., Deng, R., Tang, D., de la Rosa Blanco, E., Prévôt, A. S. H., Smith, K. A., and Worsnop, D. R.: Characterization of an aerodynamic lens for transmitting parti-cles greater than 1 micrometer in diameter into the Aerodyne aerosol mass spectrometer, Atmos. Meas. Tech., 6, 3271–3280, doi:10.5194/amt-6-3271-2013, 2013.
Zelenyuk, A. and Imre, D.: Single Particle Laser Ablation Time-of-Flight Mass Spectrometer: An Introduction to SPLAT, Aerosol Sci. Tech., 39, 554–568, doi:10.1080/027868291009242, 2005. Zelenyuk, A., Yang, J., Choi, E., and Imre, D.: SPLAT II: An
Aircraft Compatible, Ultra-Sensitive, High Precision Instrument for In-Situ Characterization of the Size and Composition of Fine and Ultrafine Particles, Aerosol Sci. Tech., 43, 411–424, doi:10.1080/02786820802709243, 2009.
Zelenyuk, A., Ezell, M. J., Perraud, V., Johnson, S. N., Bruns, E. A., Yu, Y., Imre, D., Alexander, M. L., and Finlayson-Pitts, B. J.: Characterization of organic coatings on hygroscopic salt particles and their atmospheric impacts, Atmos. Environ., 44, 1209–1218, doi:10.1016/j.atmosenv.2009.11.047, 2010.
Zhang, X., Smith, K. A., Worsnop, D. R., Jimenez, J. L., Jayne, J. T., Kolb, C. E., Morris, J., and Davidovits, P.: Numerical Characterization of Particle Beam Collimation: Part II Integrated Aerodynamic-Lens–Nozzle System, Aerosol Sci. Tech., 38, 619– 638, doi:10.1080/02786820490479833, 2004.