BGD
8, 11453–11488, 2011
A molecular perspective on the
ageing
R. Flerus et al.
Title Page
Abstract Introduction
Conclusions References
Tables Figures
◭ ◮
◭ ◮
Back Close
Full Screen / Esc
Printer-friendly Version Interactive Discussion
Discussion
P
a
per
|
Dis
cussion
P
a
per
|
Discussion
P
a
per
|
Discussio
n
P
a
per
|
Biogeosciences Discuss., 8, 11453–11488, 2011 www.biogeosciences-discuss.net/8/11453/2011/ doi:10.5194/bgd-8-11453-2011
© Author(s) 2011. CC Attribution 3.0 License.
Biogeosciences Discussions
This discussion paper is/has been under review for the journal Biogeosciences (BG). Please refer to the corresponding final paper in BG if available.
A molecular perspective on the ageing of
marine dissolved organic matter
R. Flerus1, B. P. Koch1,2, O. J. Lechtenfeld1, S. L. McCallister3, P. Schmitt-Kopplin4, R. Benner5, K. Kaiser5, and G. Kattner1
1
Alfred Wegener Institute for Polar and Marine Research, Ecological Chemistry, Bremerhaven, Germany
2
University of Applied Sciences, Bremerhaven, Germany
3
Virginia Commonwealth University, Department of Biology, Center for Environmental Studies, Richmond, VA, USA
4
Helmholtz Zentrum M ¨unchen, German Research Center for Environmental Health, Analytical BioGeoChemistry, Neuherberg, Germany
5
University of South Carolina, Marine Science Program, Columbia, SC, USA
Received: 27 October 2011 – Accepted: 28 October 2011 – Published: 29 November 2011
Correspondence to: B. P. Koch ([email protected])
Published by Copernicus Publications on behalf of the European Geosciences Union.
BGD
8, 11453–11488, 2011
A molecular perspective on the
ageing
R. Flerus et al.
Title Page
Abstract Introduction
Conclusions References
Tables Figures
◭ ◮
◭ ◮
Back Close
Full Screen / Esc
Printer-friendly Version Interactive Discussion
Discussion
P
a
per
|
Dis
cussion
P
a
per
|
Discussion
P
a
per
|
Discussio
n
P
a
per
Abstract
Dissolved organic matter (DOM) was extracted with solid phase extraction (SPE) from 137 water samples from different climate zones and different depths along an Eastern Atlantic Ocean transect. The extracts were analyzed with Fourier transform ion cy-clotron resonance mass spectrometry (FT-ICR MS) with electrospray ionization (ESI).
5
∆14C analyses were performed on subsamples of the SPE-DOM. In addition, the amount of dissolved organic carbon was determined for all water and SPE-DOM sam-ples as well as the yield of amino sugars for selected samsam-ples. Linear correlations were observed between the magnitudes of 43 % of the FT-ICR mass peaks and the extract∆14C values. Decreasing SPE-DOM∆14C values went along with a shift in the
10
molecular composition to higher average masses (m/z) and lower hydrogen/carbon (H/C) ratios. The correlation was used to model the SPE-DOM ∆14C distribution for all 137 samples. Based on single mass peaks a degradation index was developed to compare the degradation state of marine SPE-DOM samples analyzed with FT-ICR MS. A correlation between ∆14C, degradation index, DOC values and amino sugar
15
yield supports that SPE-DOM analyzed with FT-ICR MS reflects trends of bulk DOM. A relative mass peak magnitude ratio was used to compare aged SPE-DOM and fresh SPE-DOM regarding single mass peaks. The magnitude ratios show a continuum of different reactivities for the single compounds. Only few of the compounds present in the FT-ICR mass spectra are expected to be highly degraded in the oldest water
20
masses of the Pacific Ocean. All other compounds should persist partly thermoha-line circulation. Prokaryotic (bacterial) production, transformation and accumulation of this very stable DOM occurs probably primarily in the upper ocean. This DOM is an important contribution to very old DOM, showing that production and degradation are dynamic processes.
BGD
8, 11453–11488, 2011
A molecular perspective on the
ageing
R. Flerus et al.
Title Page
Abstract Introduction
Conclusions References
Tables Figures
◭ ◮
◭ ◮
Back Close
Full Screen / Esc
Printer-friendly Version Interactive Discussion
Discussion
P
a
per
|
Dis
cussion
P
a
per
|
Discussion
P
a
per
|
Discussio
n
P
a
per
|
1 Introduction
Marine dissolved organic matter (DOM) is one of the major active reservoirs of the global carbon cycle. The amount of marine dissolved organic carbon (DOC) is esti-mated to be 662 Gt, which is comparable to the amount of carbon in atmospheric CO2
(Hedges, 1992; Hansell et al., 2009; Tans, 2010). Since the average age of bulk DOC
5
below the thermocline is about 4000 years in the Sargasso Sea and about 6000 years in the central North Pacific, marine DOM plays an important role in long-term carbon storage and sequestration of atmospheric CO2 (Williams and Druffel, 1987; Bauer, 2002). This older DOM pool represents a refractory background with concentrations of 35–45 µmol kg−1 (Hansell and Carlson, 1998; Ogawa et al., 1999) upon which
la-10
bile and semi-labile pools of DOM are superimposed in the upper ocean. Numerous studies have examined the fluxes, remineralization or temporal variability of accumu-lated DOC (e.g. Goldberg et al., 2009; Hansell et al., 2009; Carlson et al., 2010). Jiao et al. (2010) proposed the concept of the microbial carbon pump as a potential pro-cess for the production of “modern” refractory DOM in surface waters. However, the
15
mechanisms of production, diagenesis and preservation of highly stable DOM are still unknown. The molecular analysis is particularly challenging as only a minor fraction of the DOM can be analyzed molecularly and identified as carbohydrates, lipids, amino acids or amino sugars (Benner, 2002).
Ultrahigh resolution Fourier transform ion cyclotron resonance mass spectrometry
20
(FT-ICR MS) with electrospray ionization (ESI) was successfully applied to distinguish thousands of compounds of different elemental compositions in ultra-filtered and solid-phase extracted marine DOM (SPE-DOM) (Koch et al., 2005; Hertkorn et al., 2006; Kujawinski et al., 2009). Ultrahigh resolution allows elemental formulas to be assigned for individual mass peaks (Stenson et al., 2003). Water samples of different spatial
ori-25
gin can be distinguished based on the molecular information from FT-ICR MS analysis. However, to date only a few numbers of samples have been compared with this tech-nique preventing a systematic comparison of FT-ICR MS data and additional analytical parameters.
BGD
8, 11453–11488, 2011
A molecular perspective on the
ageing
R. Flerus et al.
Title Page
Abstract Introduction
Conclusions References
Tables Figures
◭ ◮
◭ ◮
Back Close
Full Screen / Esc
Printer-friendly Version Interactive Discussion
Discussion
P
a
per
|
Dis
cussion
P
a
per
|
Discussion
P
a
per
|
Discussio
n
P
a
per
Radiocarbon age and amino sugars are critical diagnostic parameters to assess the production of refractory DOM. The analysis of amino sugars in seawater provides very valuable information on the early diagenesis of DOM (Benner and Kaiser, 2003; Davis et al., 2009; Kaiser and Benner, 2009). Radiocarbon age provides a timeline from car-bon fixation in the upper ocean and its subsequent turnover and flux to the deep ocean
5
for bulk DOC and individual components or compound classes (Druffel et al., 1992; Aluwihare et al., 1997; Loh et al., 2004; Repeta and Aluwihare, 2006). Due to the an-alytical challenge of radiocarbon analysis of bulk DOC, the radiocarbon age has only been determined for a few samples at some locations including the Central North Pa-cific (Druffel et al., 1992; Williams and Druffel, 1987), the Southern Ocean (Druffel and
10
Bauer, 2000) and the Sargasso Sea (Bauer et al., 1992; Druffel et al., 1992). A handful of additional studies have been performed on∆14C of marine DOM fractions of differing size or chemical components such as humic isolates, lipid extracts, carbohydrate-like DOM and protein-like DOM. The high molecular weight (>10 kD) DOM is of recent age suggesting greater lability and faster turnover, whereas the low molecular weight
15
(<1 kD) DOM is apparently older (Santschi et al., 1995; Loh et al., 2004). Humic sub-stances isolated with XAD-resins are similar to bulk C pools with radiocarbon ages only slightly older (Druffel et al., 1989). The oldest age (up to 17 000 yr) was determined in lipid extracts (Loh et al., 2004). However, each DOM fraction still consists of multiple compounds with a continuum of ages, and consequently the bulk age of DOM
repre-20
sents an average of all the individual compounds. To date a direct linkage between radiocarbon age and DOM on a molecular level has not been reported.
The aim of this study was to investigate the ageing, processes and associated molec-ular changes of DOM along an Eastern Atlantic Ocean transect. Our combination of FT-ICR MS with radiocarbon age analysis of SPE-DOM from different depths and
bio-25
BGD
8, 11453–11488, 2011
A molecular perspective on the
ageing
R. Flerus et al.
Title Page
Abstract Introduction
Conclusions References
Tables Figures
◭ ◮
◭ ◮
Back Close
Full Screen / Esc
Printer-friendly Version Interactive Discussion
Discussion
P
a
per
|
Dis
cussion
P
a
per
|
Discussion
P
a
per
|
Discussio
n
P
a
per
|
activity, each determined independently. Our ultimate goal was to elucidate trends that are characteristic for the entire Atlantic Ocean.
2 Materials and methods 2.1 Sampling
Water samples were collected along a transect from 50.2◦N to 31.4◦S in the East
5
Atlantic Ocean in November 2008 during the cruise ANT-XXV/1 of R/VPolarstern. Sur-face water was sampled 3 times per day with a fish sampler, which was fixed alongside the ship providing a continuous flow of surface water (∼2 m water depth). Water from 200 m and the fluorescence maximum was sampled daily with a rosette sampler con-nected to a CTD, as well as water from 7 selected stations from surface to bottom (see
10
details in Koch and Kattner, 2011). Samples for the analysis of DOC and amino sugars were filtered through GF/F filters (Whatman, pre-combusted for 4 h, 450◦C) and stored in pre-combusted glass ampoules at –20◦C.
2.2 DOM extraction
FT-ICR MS measurement requires the concentration and desalting of marine DOM.
15
Therefore DOM was extracted on board using solid phase extraction (SPE) for which the term SPE-DOM will be used in the following. Filtered samples were acidified with HCl (hydrochloric acid, p.a. grade, Merck) to pH 2. The DOM was extracted using SPE cartridges (PPL, 1 g, Varian, Mega Bond Elut; Dittmar et al., 2008). The cartridges were rinsed with methanol (LiChrosolv; Merck), followed by acidified ultra-pure water
20
(Milli-Q, pH 2, HCl) and then 5 L of seawater was gravity filtered through each cartridge. Subsequently remaining salt was removed with acidified ultra-pure water. After drying with nitrogen gas, DOM was eluted with 5 mL methanol and stored in pre-combusted glass ampoules at –20◦C.
BGD
8, 11453–11488, 2011
A molecular perspective on the
ageing
R. Flerus et al.
Title Page
Abstract Introduction
Conclusions References
Tables Figures
◭ ◮
◭ ◮
Back Close
Full Screen / Esc
Printer-friendly Version Interactive Discussion
Discussion
P
a
per
|
Dis
cussion
P
a
per
|
Discussion
P
a
per
|
Discussio
n
P
a
per
2.3 Analyses
The DOC concentration was determined by high temperature catalytic oxidation with a Shimadzu TOC-VCPN analyzer. Water samples were acidified in the auto-sampler and analyzed directly. The DOC content of the SPE-DOM was determined by evaporation of 50 µL methanol extract re-dissolved in ultra-pure water.
5
Bacterioplankton production was estimated by3H-leucine uptake (Smith and Azam, 1992). Triplicate subsamples (1.5 mL) and one trichloroacetic acid-killed control were amended with 5 nM3H-leucine (Amersham, specific activity 160 Ci mmol−1) and incu-bated at in situ temperature (±2◦C) in the dark. Incubation time varied depending on depth: ∼2 h for upper waters (up to 200 m) and up to 12 h (below 200 m). Samples
10
were processed according to Smith and Azam (1992) and radioassayed with a Wallac scintillation counter after addition of 1 mL of Ultima Gold AB scintillation cocktail. The disintegrations per minute (DPM) of the killed control were subtracted from the mean DPM of the corresponding duplicate samples and converted to leucine incorporation rates. A conversion factor of 3.1 kg C mol−1was applied (Kirchman, 1993).
15
Concentrations of galactosamine (GalN), mannosamine (ManN) and glucosamine (GlcN) were determined by high-performance anion-exchange chromatography cou-pled to a pulsed amperometric detector (Kaiser and Benner, 2000). After hydrolysis in 3 M HCl (5 h, 100◦C) samples were neutralized with a self-absorbed ion retarda-tion resin (AG11 A8, Biorad) and stored frozen until analysis. Samples were desalted
20
by solid-phase extraction using Biorad’s AG50 X8 resin in the Na+-form before chro-matographic separation. Subsequently, GalN, ManN and GlcN were separated iso-cratically on a Dionex PA20 anion-exchange column with 2 mM NaOH at a flow rate of 1 mL min−1.
Subsamples of SPE-DOM were quantitatively transferred to combusted (500◦C)
25
quartz tubes (6 mm diameter), evaporated under a stream of N2, sealed under vac-uum and combusted at 900◦C to CO2 using a CuO/Ag metal catalyst (Sofer, 1980).
BGD
8, 11453–11488, 2011
A molecular perspective on the
ageing
R. Flerus et al.
Title Page
Abstract Introduction
Conclusions References
Tables Figures
◭ ◮
◭ ◮
Back Close
Full Screen / Esc
Printer-friendly Version Interactive Discussion
Discussion
P
a
per
|
Dis
cussion
P
a
per
|
Discussion
P
a
per
|
Discussio
n
P
a
per
|
of H2 over a cobalt catalyst (Vogel et al., 1987). Graphite targets were analyzed at the Center for Accelerator Mass Spectrometry at Lawrence Livermore National Labo-ratory. ∆14C is defined as the (per mil) deviation of a sample from the 14C activity of a 1950 standard, corrected for fractionation according to Stuvier and Polach (1977). Total measurement uncertainties for∆14C analyses of these samples were typically
5
±4 ‰.
FT-ICR MS analyses of 137 SPE-DOM samples was performed with an Apex Qe mass spectrometer (Bruker Daltonics) equipped with a 12 T superconducting magnet (Bruker Biospin) and an Apollo II Dual electrospray source (Bruker). Prior to analysis, SPE-DOM was adjusted to similar DOC concentrations by dilution with methanol (factor
10
3.1–9.7). The diluted extracts were analysed with ESI in negative ion mode (capillary voltage –4.2 kV, infusion flow rate 2 µL min−1). Spectra were calibrated internally with compounds, which were repeatedly identified in marine DOM samples (339.10854, 369.11911, 411.12967, 469.13515, 541.15628m/z; Flerus et al., 2011). 512 scans were added to acquire one spectrum. All ions were singly charged and the mass
15
accuracy was below±0.2 ppm for the ions used for the internal calibration.
2.4 FT-ICR MS data evaluation
The mass spectra were evaluated in the rangem/z 200–500 to guarantee a sufficient mass accuracy for the correct elemental formula assignment. For each peak with a signal to noise ratio of S/N ≥ 3, elemental formulas were calculated in the range of
20
±0.5 ppm as described elsewhere (Koch et al., 2005, 2007). The isotopes included
for the formula calculation were as follows: 12C (0–∞), 13C (0–1),1H (0–∞), 16O (0–
∞), 14N (0–2), 32S (0–1). The average mass accuracy for all assigned peaks was
<±0.2 ppm. For unambiguous elemental formula assignment the “nitrogen-rule” was
applied and the following thresholds were defined: O/C ≤ 1.2 and H/C ≤ 2C+2+N
25
(Koch et al., 2005). All formulas with13C isotopes were removed from the data set as they represent duplicates of the12C parent molecules. In addition, all formulas which were present in less than 6 mass spectra were also excluded to avoid false formula
BGD
8, 11453–11488, 2011
A molecular perspective on the
ageing
R. Flerus et al.
Title Page
Abstract Introduction
Conclusions References
Tables Figures
◭ ◮
◭ ◮
Back Close
Full Screen / Esc
Printer-friendly Version Interactive Discussion
Discussion
P
a
per
|
Dis
cussion
P
a
per
|
Discussion
P
a
per
|
Discussio
n
P
a
per
assignments. Prior to mass spectra comparison, the mass peak magnitudes of each spectrum were normalized to the sum of all identified mass peak magnitudes of the respective spectrum and a signal intensity threshold of 100 ppm was applied. Based on the 100 ppm cutoff on a presence-absence basis, 42 % of the detected molecular formulas were detected in all 137 samples, 76 % were present in at least 100
sam-5
ples showing the typical magnitude pattern of marine SPE-DOM (Fig. 1). Most mass peaks, which were not present in all samples, showed magnitudes close to the cutoff limit of 100 ppm. Due to the molecular similarities of the samples, our data evaluation was based on normalized peak magnitudes instead of the presence/absence-based approach as it was applied for biomarker approaches for DOM in glacial or riverine
10
environments (Bhatia et al., 2010; Sleighter and Hatcher, 2008).
3 Results and discussion
The∆14C values ranged from –279 ‰ in surface water (2 m) to –446 ‰ in deep water extracts (>2500 m, Fig. 2). The highest surface water∆14C values were comparable with the ∆14C values determined by Druffel and Bauer (1992) in the Sargasso Sea.
15
In comparison to the results from the Sargasso Sea, our∆14C values in deeper water layers (>1000 m) were more negative and closer to XAD isolates. 43 % of the FT-ICR mass peaks showed either a significantly linear positive (POS) or linear negative (NEG) correlation (p <0.01) with the∆14C values (peaks with a correlation factor>0.8 and elemental formulas are presented in Table A1 and A2 in Appendix A). To reduce
20
the data set, the magnitudes of all highly significantly POS and NEG correlating mass peaks were summed up separately. The summed magnitudes of these mass peaks account for 66±1.4 % of the summed magnitudes of all peaks in each spectrum. The
linear relationship between the ∆14C values and the summed magnitudes (Fig. 3a, b) were used to calculate two ∆14C values for each of the 137 SPE-DOM samples.
25
BGD
8, 11453–11488, 2011
A molecular perspective on the
ageing
R. Flerus et al.
Title Page
Abstract Introduction
Conclusions References
Tables Figures
◭ ◮
◭ ◮
Back Close
Full Screen / Esc
Printer-friendly Version Interactive Discussion
Discussion
P
a
per
|
Dis
cussion
P
a
per
|
Discussion
P
a
per
|
Discussio
n
P
a
per
|
Hence, the arithmetic average of the two calculated∆14C values was used as the final ∆14C value (∆14CCal) for each sample. The∆
14
CCalvalues are presented for the upper
200 m in Fig. 4, and as single values for the deep water in Table 1a.
We calculated average relative magnitude ratios for single (identical) formulas in aged (∆14CCal: < –450 ‰, water depths >800 m) and young (∆
14
CCal: > –280 ‰,
5
water-depths <100 m) samples. Subsequently, masses were considered which were present in at least 123 (90 %) of all samples. With this approach, 73 % of all mass peaks (covering 97 %±1.4 of the summed magnitudes per sample) were included in the calculation. The remaining mass peaks showed low magnitudes close to the cut-offof 100 ppm. A few mass peaks were present in selected sample groups such as
10
surfactant-derived sulphur compounds which were detected in the anthropogenically impacted areas such as the English Channel. However, these mass peaks were char-acteristic for spatially narrow areas and did not reflect trends for the bulk samples. Because the bulk concentrations and the age of SPE-DOC decreased with depth we assume that the masses with the highest relative magnitude ratios>1 (aged vs. fresh)
15
were not or less degraded compared to compounds represented by mass peaks with low ratios<1.
3.1 Molecular characteristics of DOM diagenesis
We observed clear differences in the molecular characteristics between significantly correlated POS and NEG mass peaks. The peak magnitudes of the POS masses were
20
generally much lower than those of the NEG mass peaks and the averagem/z was in-versely correlated with∆14C values (Fig. 5). The magnitude averagedm/z increased from 392.1±1.3 for young (∆14CCal: > –280 ‰) to 401.7±0.5 for aged SPE-DOM
(∆14CCal:<–450 ‰). Previous studies showed an increasing extent of diagenetic
pro-cessing (Kaiser and Benner, 2009) and a decreasing bioreactivity (Amon and Benner,
25
1996) with decreasing molecular size from high molecular weight DOM (>1 kDa) to low molecular weight DOM (<1 kDa). Further, Dittmar and Kattner (2003) suggested a
BGD
8, 11453–11488, 2011
A molecular perspective on the
ageing
R. Flerus et al.
Title Page
Abstract Introduction
Conclusions References
Tables Figures
◭ ◮
◭ ◮
Back Close
Full Screen / Esc
Printer-friendly Version Interactive Discussion
Discussion
P
a
per
|
Dis
cussion
P
a
per
|
Discussion
P
a
per
|
Discussio
n
P
a
per
comparatively higher refractory character for small DOM molecules. However, these previous results were obtained with gel permeation chromatography or ultrafiltered DOM (UDOM) and include or represent high molecular weight DOM (>1 kDa). In contrast, our study focused on SPE-DOM (extraction efficiency 42.5±3.9 % C of bulk
DOC) analyzed in the lower FT-ICR MSm/z range between 200–500 Da. This highly
5
detailed analysis offers to identify additional trends within this SPE fraction. Hertkorn et al. (2011) obtained results using nuclear magnetic resonance spectroscopy (NMR), which allows indirect conclusions for a similar trend of SPE-DOM with depth.
The van Krevelen diagram (Kim et al., 2003) showed differences in the elemental composition of the POS and NEG masses (Fig. 6). The majority of CHO compounds of
10
the POS formulas were in the high H/C range (1.4–1.7), whereas all CHO compounds of the NEG masses were in the medium to low H/C range (0.9–1.4, Fig. 6a, b). Within a similar region of the van Krevelen diagramm/z differed significantly between POS and NEG formulas: in the region of H/C ≤1.4, the average mass for NEG formulas
is 427.9±48.1 and for the few POS formulas 298.1±32.6. CHON compounds of the
15
POS masses had low to medium H/C ratios (1.15–1.50) and medium O/C ratios (0.33– 0.63). CHON compounds of NEG formulas occurred only in the low H/C (0.95–1.35) and medium O/C range (0.35–0.65, Fig. 6c, d). This is probably due to low magnitudes in the high H/C range, which fell below the cutoffof 100 ppm. The H/C ratio shift also affected the weighted average DBE, which was in the range from 4–9 for the POS
20
masses and in the range from 7–13 for the NEG masses.
The very similar FT-ICR MS spectra patterns of marine DOM as well as the presence of the most important mass peaks in each spectrum are clear indicators for a large portion of compounds representing the molecular background of marine DOM (Koch et al., 2005; Hertkorn et al., 2006; Gonsior et al., 2011). Further, elemental composition
25
trends were determined also for the bulk of mass peaks. The magnitude averaged H/C ratios decreased from 1.27±0.01 in young (∆14CCal:>–280 ‰) to 1.25±0.00 in aged
SPE-DOM (∆14CCal: < –450 ‰). These bulk trends can be visualized by the relative
BGD
8, 11453–11488, 2011
A molecular perspective on the
ageing
R. Flerus et al.
Title Page
Abstract Introduction
Conclusions References
Tables Figures
◭ ◮
◭ ◮
Back Close
Full Screen / Esc
Printer-friendly Version Interactive Discussion
Discussion
P
a
per
|
Dis
cussion
P
a
per
|
Discussion
P
a
per
|
Discussio
n
P
a
per
|
broader picture shows a continuous transition from mass peaks with the lowest ratios to mass peaks with the highest ratios, covering a continuum of different reactivity rates. The magnitude averaged DBE increased from 7.76±0.05 in young to 8.10±0.03 in aged SPE-DOM. Surprisingly no clear trend was found in the magnitude averaged O/C ratios, and we are currently examining potential reasons for this disparity.
5
Hertkorn et al. (2006) analysed surface and deep UDOM from the Pacific Ocean us-ing NMR and FT-ICR MS. They identified carboxyl-rich alicyclic molecules (CRAM) as a major constituent in surface and deep UDOM which was suggested to resist biodegra-dation. The area occupied by CRAM in the van Krevelen diagram corresponds well with the area of our highest SPE-DOM magnitude ratios (aged vs. fresh). Hence, CRAM is
10
obviously also a significant contributor to SPE-DOM. The trends are similar for CHO, CHON and CHOS compounds.
3.2 East Atlantic Ocean DOM degradation state and degradation index
The linear correlation between single mass peaks and SPE-DOM ∆14C provides the possibility to compare SPE-DOM samples in terms of their degradation state. To
cal-15
culate a degradation index we selected 5 positively (POS) correlating and 5 negatively (NEG) correlating mass peaks (Table 2) which were present in all mass spectra with sufficient magnitude and which also occurred in previous∼400 samples from other
lo-cations and environments. The indexIDEG is calculated using the molecular formulas
given in Table 2:
20
IDEG=
P
magnitudeNEG/
P
magnitude(NEG+POS)
(PmagnitudePOS/
P
magnitude(NEG+POS)×100)+1
×1000
IDEG increases with the degradation state of the sample. We observed from our database thatIDEG also depends on the instrument, extraction technique and
environ-ment. For example, samples from soils and sediments generally revealed lower values forIDEGthan for ocean water (data not shown). However, if similar sample extracts are
25
measured with the same instrument in series theIDEGtrends are comparable.
BGD
8, 11453–11488, 2011
A molecular perspective on the
ageing
R. Flerus et al.
Title Page
Abstract Introduction
Conclusions References
Tables Figures
◭ ◮
◭ ◮
Back Close
Full Screen / Esc
Printer-friendly Version Interactive Discussion
Discussion
P
a
per
|
Dis
cussion
P
a
per
|
Discussion
P
a
per
|
Discussio
n
P
a
per
IDEG for our East Atlantic Ocean samples was in the range of 14.6–29.1 for the
surface samples (Fig. 8a) and 30.1–40.1 for deep water>200 m.IDEGshowed a strong
correlation with the∆14C values and the DOC values. In particular, in the upper 200 m changes in DOC concentrations were reflected in theIDEG. The lowestIDEG was found
in the area with the youngest SPE-DOM in the upper 25 m between 2–12◦N along with
5
the highest DOC concentrations. This was the most stratified region with thermocline depths of 25–30 m. The accumulation of freshly produced DOC in highly stratified water was also reported by Carlson et al. (1994) and Goldberg et al. (2009). At 200 m depth the lowest IDEG and the youngest SPE-DOM were north of 40
◦
N. The highest
IDEG as well as the oldest SPE-DOM and lowest bulk DOC concentrations matched
10
with the tropical divergences around 15◦N and 10◦S which are upwelling areas. To support the differentiation in fresh and old DOM, amino sugars were determined directly in water samples as an independent measurement. Amino sugars are bioreac-tive compounds and the DOC-normalized yield of amino sugars is an indicator for the degradation state of DOM (Benner and Kaiser, 2003; Kaiser and Benner, 2009). The
15
significant correlation between∆14CCaland the yield of amino sugars is consistent with previous observations indicating they are more reactive than bulk DOC and indicates that our mass peak magnitude based ∆14C calculation is reasonable (Fig. 9). The exponential relation between the amino sugar yield and∆14CCal also suggests that a fraction of the youngest and most bioavailable compounds was not recovered by SPE
20
or was not detected by FT-ICR MS analysis.
Finally, also the bacterial activity correlated with IDEG, ∆ 14
CCal and amino sugar
yields in the upper 200 m of the water column (Fig. 8b). The highest bacterial ac-tivity was determined in the same area, where also the youngest and least degraded SPE-DOM with the highest DOC values occurred. This is an indicator for bacterial
25
BGD
8, 11453–11488, 2011
A molecular perspective on the
ageing
R. Flerus et al.
Title Page
Abstract Introduction
Conclusions References
Tables Figures
◭ ◮
◭ ◮
Back Close
Full Screen / Esc
Printer-friendly Version Interactive Discussion
Discussion
P
a
per
|
Dis
cussion
P
a
per
|
Discussion
P
a
per
|
Discussio
n
P
a
per
|
3.3 Degradation continuum
Several studies present strategies to explain mechanisms of redistribution of DOM in the water column. These studies are based on two or three component models (Williams and Druffel, 1987; Beaupre and Druffel, 2009; Hansell et al., 2009; Beaupre and Aluwihare, 2010). The models suggest a refractory DOM background fraction and
5
labile or semi labile fractions of DOM with distinct isotopic compositions. Beaupre and Druffel (2009) used 2-component Keeling plots to estimate the radiocarbon age of the background and the fresh DOM fractions. Applying the Keeling plot to the SPE-DOM samples from the seven deep stations results in similar values for the fresh SPE-DOM fraction at every station (Table 3). This provides further evidence that the radiocarbon
10
age of SPE-DOM is representative of that for the bulk DOC. Beaupre and Druffel (2009) calculated∆14C for the background DOM, but since ∆14C was too low for the oldest water sample they considered a multiple component system. Our results indeed show a wide spectrum of DOM reactivity represented by varying relative magnitude ratios of young and aged samples, supporting the hypothesis of a continuum of DOM reactivity
15
and age.
As mentioned above, we assume that the compounds in the FT-ICR mass spectra are degraded over time, but to varying extents. To elucidate at which point during the thermohaline circulation a single compound would be completely degraded, we performed a rough estimate using the following assumptions: (i) each mass peak
ei-20
ther represents one compound or several compounds with similar degradation rates. A recent study by Witt et al. (2009) shows that the structural variability of a single elemen-tal formula in the FT-ICR mass spectra is probably not as high as expected for natural organic matter; (ii) a compound is regarded as highly degraded, when the relative mag-nitude falls below 100 ppm. Using the linear equation resulting from the correlation
be-25
tween the mass peak magnitudes and∆14CCal, a theoretical∆ 14
C limit (∆14CLim) can
be calculated for each mass peak at which the smallest relative magnitude (100 ppm) is reached. The calculated∆14CLim values for highly degraded compounds ranged from
BGD
8, 11453–11488, 2011
A molecular perspective on the
ageing
R. Flerus et al.
Title Page
Abstract Introduction
Conclusions References
Tables Figures
◭ ◮
◭ ◮
Back Close
Full Screen / Esc
Printer-friendly Version Interactive Discussion
Discussion
P
a
per
|
Dis
cussion
P
a
per
|
Discussion
P
a
per
|
Discussio
n
P
a
per
–427 ‰ to<–1000 ‰ for mass peaks with a relative magnitude ratio of aged vs. young samples of 0.8 or less and from –590 ‰ to<–1000 ‰ for the mass peaks with relative magnitude ratios 0.8–1. The oldest samples in this study are from the deep Atlantic Ocean. More aged extracts would be expected in the Pacific Ocean where the lowest ∆14C value of bulk DOC is –546 ‰ (Druffel et al., 1992). Since the∆14CCal of
SPE-5
DOM was also correlated with the DOC concentration (Fig. 9b) it can be estimated that the SPE-DOM∆14C would be about –556 ‰ at the Pacific’s oldest water mass, where DOC values of 34 µmol kg−1were determined (Hansell et al., 2009). All compounds of masses with∆14CLim<–556 ‰ are expected to be highly degraded in the oldest water
masses. This applies for only 2.5 % of all mass peaks. Since the extraction efficiency
10
was similar for all samples, and the extracts were diluted to similar concentrations be-fore FT-ICR MS measurements, a loss of additional mass peaks due to lower bulk DOC concentrations is not expected.
The FT-ICR MS analyzed SPE-DOM represents a fraction of the marine DOM for which most of the compounds are expected to persist one or more cycles through the
15
global ocean circulation (∼1000 yr). At the same time the compounds are expected to degrade very slowly with a continuum of different decomposition rates (Fig. 10). Our results support the hypothesis of old carbon recycling (Ogawa and Tanoue, 2003) as well as a broad and continuous distribution of ∆14C ages as proposed by Bauer et al. (1992) and are also consistent with the reactivity continuum proposed by Amon and
20
Benner (2002). Compounds, which are degraded within decades and expected to be detected on a presence – absence analysis, are probably underrepresented in the FT-ICR mass spectra. The presence of an absolute refractory fraction, that is hidden in a mixture with degrading compounds, cannot be excluded. However, our results lend support to the theory of a continuum of reactivity. Since the∆14C trends in SPE-DOM
25
BGD
8, 11453–11488, 2011
A molecular perspective on the
ageing
R. Flerus et al.
Title Page
Abstract Introduction
Conclusions References
Tables Figures
◭ ◮
◭ ◮
Back Close
Full Screen / Esc
Printer-friendly Version Interactive Discussion
Discussion
P
a
per
|
Dis
cussion
P
a
per
|
Discussion
P
a
per
|
Discussio
n
P
a
per
|
et al. 2010) are generally useful to distinguish among the reactivities of different DOM fractions, but the complexity of DOM reactivity is better described as a continuum.
3.4 The microbial carbon pump
The microbial carbon pump provides a conceptual framework for understanding the role of microbial processes in recalcitrant DOM generation and relevant carbon
stor-5
age in the ocean (Ogawa et al., 2001; Jiao et al., 2010). It is hypothesized that the transformation of labile and semi-labile DOM through microbial processes leads to the accumulation of recalcitrant DOM in the ocean. Indeed, the highest bacterial activity as well as the maximum abundance of the reactive parameters, DOC, amino sugars and∆14CCal, was determined in surface waters of the highly stratified region between
10
0–15◦N.
The majority of the FT-ICR mass peaks were present in samples with young SPE-DOM as well as with old SPE-SPE-DOM. Of all mass peaks, the estimated fraction of the least reactive masses is 69 %, accounting for>90 % of the summed magnitudes per sample. We hypothesize that this low reactivity fraction is produced and accumulates in
15
the upper ocean. Fresh and highly reactive DOM is rapidly consumed by prokaryotes (Carlson and Ducklow, 1996) and partially converted to low reactivity DOM (Ogawa et al., 2001). The recently produced younger compounds mix with older compounds of similar reactivity in the upper ocean, and this mixture is then further degraded by bacterial activity (Ogawa and Tanoue, 2003) and thereby aged during the thermohaline
20
circulation. ∆14C values of deep ocean DOC depend on the amount of low reactivity DOM produced by prokaryotes in the upper ocean and on the speed of degradation of this DOM during thermohaline circulation. Production and degradation appear to be in a steady state, since no apparent changes were detected in time-series studies of ∆14C of DOC concentrations (Goldberg 2009; Beaupre and Aluwihare 2010).
25
BGD
8, 11453–11488, 2011
A molecular perspective on the
ageing
R. Flerus et al.
Title Page
Abstract Introduction
Conclusions References
Tables Figures
◭ ◮
◭ ◮
Back Close
Full Screen / Esc
Printer-friendly Version Interactive Discussion
Discussion
P
a
per
|
Dis
cussion
P
a
per
|
Discussion
P
a
per
|
Discussio
n
P
a
per
4 Conclusions
In this study FT-ICR MS measurements and the radiocarbon age of marine SPE-DOM were directly compared with other compositional characteristics of DOM and the ocean circulation for the first time. The results show that trends in bulk DOC radiocarbon ages are reflected in the radiocarbon age determined from a correlation between selected
5
FT-ICR mass peaks and SPE-DOM∆14C values. With this knowledge the degradation state of other marine DOM samples can be estimated by comparing FT-ICR mass peaks. Since this method was only applied for the Atlantic Ocean it is important to continue these studies in other oceanic regions for verification of this approach. For this, the degradation index IDEG was suggested as a simple tool to evaluate relative
10
degradation states in a set of similarly treated samples. So farIDEGis only applied for
SPE-DOM samples (PPL extracts) from the Atlantic Ocean and thus has to be verified for other regions.
We propose a degradation continuum of the compounds represented in the FT-ICR mass spectra, but only some of them are expected to be completely degraded during
15
thermohaline circulation. Prokaryotic (bacterial) production, transformation and accu-mulation of this very stable DOM occurs probably primarily in the upper ocean (Benner and Herndl, 2011). This DOM is an important contribution to very old DOM, showing that production and degradation are dynamic processes. To elucidate these complex processes it is important to further investigate sources, transformations and fates of
20
BGD
8, 11453–11488, 2011
A molecular perspective on the
ageing
R. Flerus et al.
Title Page
Abstract Introduction
Conclusions References
Tables Figures
◭ ◮
◭ ◮
Back Close
Full Screen / Esc
Printer-friendly Version Interactive Discussion
Discussion
P
a
per
|
Dis
cussion
P
a
per
|
Discussion
P
a
per
|
Discussio
n
P
a
per
|
Acknowledgements. The authors gratefully acknowledge Anne Stuart for lab assistance and the crew of the research vessel “Polarstern” for professional assistance during sample collec-tion.
This work was partially funded by the DAAD, a National Science Foundation-Ocean Sciences grant OCE-0825403 to S.L.M. and NSF 0713915.
5
References
Aluwihare, L. I., Repta, D. J., and Chen, R. F.: A major biopolymeric component to dissolved organic carbon in surface water, Nature, 387, 166–169, 1997.
Amon, R. M. W., and Benner, R.: Bacterial utilization of different size classes of dissolved organic matter, Limnol. Oceanogr., 41, 41–51, 1996.
10
Bauer, J. E.: Carbon isotopic composition of DOM, in: Biogeochemistry of marine dissolved organic matter, edited by: Hansell, D. A. and Carlson, C. A., Amsterdam: Academic Press, 405–446, 2002.
Bauer, J. E., Williams, P. M., and Druffel, E. R. M.: 14C activity of dissolved organic carbon fractions in north-central Pacific and Sargasso Sea, Nature, 357, 667–670, 1992.
15
Beaupre, S. R. and Druffel, E. R. M.: Constraining the propagation of bomb-radiocarbon through the dissolved organic carbon (DOC) pool in the northeast Pacific Ocean, Deep-Sea Res. Pt. I, 56, 1717–1726, 2009.
Beaupre, S. R. and Aluwihare, L.: Constraining the 2-component model of marine dissolved organic radiocarbon, Deep-Sea Res. Pt. II, 57, 1494–1503, 2010.
20
Benner, R.: Chemical composition and reactivity, in: Biogeochemistry of marine dissolved organic matter, edited by: Hansell, D. A. and Carlson, C. A., Amsterdam: Academic Press, 59–85, 2002.
Benner, R. and Kaiser, K.: Abundance of amino sugars and peptidoglycan in marine particulate and dissolved organic matter, Limnol. Oceanogr., 48, 118–128, 2003.
25
Benner, R. and Herndl, G. J.: Bacterially derived dissolved organic matter in the microbial carbon pump, in: Microbial Carbon Pump in the Ocean, edited by: Jiao, N., Azam, F., and Sanders, S., Science/AAAS, Washington, DC, Science/AAAS, 46–48, 2011.
Bhatia, M. P., Das, S. B., Longnecker, K., Charette, M. A., and Kujawinski, L. E.: Molecular
BGD
8, 11453–11488, 2011
A molecular perspective on the
ageing
R. Flerus et al.
Title Page
Abstract Introduction
Conclusions References
Tables Figures
◭ ◮
◭ ◮
Back Close
Full Screen / Esc
Printer-friendly Version Interactive Discussion
Discussion
P
a
per
|
Dis
cussion
P
a
per
|
Discussion
P
a
per
|
Discussio
n
P
a
per
acterization of dissolved organic matter associated with the Greenland ice sheet, Geochim. Cosmochim. Ac., 74, 3768–3784, 2010.
Carlson, C. A., Ducklow, H. W., and Michaels, A. F.: Annual flux of dissolved organic carbon from the euphotic zone in the northwestern Sargasso Sea, Nature, 371, 405–408, 1994. Carlson, C. A. and Ducklow, H. W.: Growth of bacterioplankton and consumption of dissolved 5
organic carbon in the oligotrophic Sargasso Sea, Aquat. Microb. Ecol., 10, 69–85, 1996. Carlson, C. A., Hansell, D. A., Nelson, N. B., Siegel, D. A., Smethie, W. M., Khatiwala, S.,
Mey-ers, M. M., and Halewood, E.: Dissolved organic carbon export and subsequent remineral-ization in the mesopelagic and bathypelagic realms of the North Atlantic basin, Deep-Sea Res. Pt. II, 57, 1433–1445, 2010.
10
Davis, J., Kaiser, K., and Benner, R.: Amino acid and amino sugar yields and compositions as indicators of dissolved organic matter diagenesis, Org. Geochem., 40, 343–352, 2009. Dittmar, T. and Kattner, G.: Recalcitrant dissolved organic matter in the ocean: major
contribu-tion of small amphiphilics, Mar. Chem., 82, 115–123, 2003.
Dittmar, T., Koch, B. P., Hertkorn, N., and Kattner, G.: A simple and efficient method for 15
the solid-phase extraction of dissolved organic matter (SPE-DOM) from seawater, Limnol. Oceanogr.-Meth., 6, 230–235, 2008.
Druffel, E. R. M., Williams, P. M., and Suzuki, Y.: Concentrations and radiocarbon signatures of dissolved organic matter in the Pacific Ocean, Geophys. Res. Let., 16, 991–994, 1989. Druffel, E. R. M., Williams, P. M., Bauer, J. E., and Ertel, J. R.: Cycling of dissolved and 20
particulate organic matter in the open ocean, J. Geophys. Res., 97, 15639–15659, 1992. Druffel, E. R. M. and Bauer, J. E.: Radiocarbon distributions in Southern Ocean dissolved and
particulate organic matter, Geophys. Res. Let., 27, 1495–1498, 2000.
Flerus, R., Koch, B. P., Schmitt-Kopplin, P., Witt, M., and Kattner, G.: Molecular level investiga-tion of reacinvestiga-tions between dissolved organic matter and extracinvestiga-tion solvents using FT-ICR MS, 25
Mar. Chem., 124, 100–107, 2011.
Goldberg, S. J., Carlson, C. A., Hansell, D. A., Nelson, N. B., and Siegel, D. A.: Temporal dynamics of dissolved combined neutral sugars and the quality of dissolved organic matter in the Northwestern Sargasso Sea, Deep-Sea Res. Pt. I., 56, 672–685, 2009.
Gonsior, M., Peake, B. M., Cooper, W. T., Podgorski, D. C., D’Andrilli, J., Dittmar, T., and Cooper, 30
W. J.: Characterization of dissolved organic matter across the Subtropical Convergence off
the South Island, New Zealand, Mar. Chem., 123, 99–110, 2011.
BGD
8, 11453–11488, 2011
A molecular perspective on the
ageing
R. Flerus et al.
Title Page
Abstract Introduction
Conclusions References
Tables Figures
◭ ◮
◭ ◮
Back Close
Full Screen / Esc
Printer-friendly Version Interactive Discussion
Discussion
P
a
per
|
Dis
cussion
P
a
per
|
Discussion
P
a
per
|
Discussio
n
P
a
per
|
organic carbon, Nature, 395, 263–266, 1998.
Hansell, D. A., Carlson, C. A., Repeta, D. J., and Schlitzer, R.: Dissolved organic matter in the ocean, Oceanogr., 22, 202–211, 2009.
Hedges, J. I.: Global biogeochemical cycles: progress and problems, Mar. Chem., 39, 67–93, 1992.
5
Hertkorn, N., Benner, R., Frommberger, M., Schmitt-Kopplin, P., Witt, M., Kaiser, K., Kettrup, A., and Hedges, J. I.: Characterization of a major refractory component of marine dissolved organic matter, Geochim. Cosmochim. Ac., 70, 2990–3010, 2006.
Hertkorn, N., Harir, M., Koch, B. P., Michalke, B., Grill, P., and Schmitt-Kopplin, Ph.: High field NMR spectroscopy and FTICR mass spectrometry: powerful discovery tools for the 10
molecular level characterization of marine dissolved organic matter from the South Atlantic Ocean, to be submitted to Biogeosciences, 2011.
Jiao, N., Herndl, G. J., Hansell, D. A., Benner, R., Kattner, G., Wilhelm, S. W., Kirchman, D., Weinbauer, M. G., Luo, T., Chen, F., and Azam, F.: Microbial production of recalcitrant dissolved organic matter: long-term carbon storage in the global ocean, Nat. Rev. Microbiol., 15
8, 593–599, 2010.
Kaiser, K. and Benner, R.: Determination of amino sugars in environmental samples with high salt content by high-performance anion-exchange chromatography and pulsed amperometric detection, Anal. Chem., 72, 2566–2572, 2000.
Kaiser, K., and Benner, R.: Biochemical composition and size distribution of organic matter at 20
the Pacific and Atlantic time-series stations, Mar. Chem., 113, 63–77, 2009.
Kim, S., Simpson, A. J., Kujawinski, E. B., Freitas, M. A., and Hatcher, P. G.: High resolution electrospray ionization mass spectrometry and 2D solution NMR for the analysis of DOM extracted by C18 solid phase disk, Org. Geochem., 34, 1324–1335, 2003.
Kirchman, D. L.: Leucine incorporation as a measure of biomass production by heterotrophic 25
bacteria, edited by: Kemp, P. F., Sherr, B. F., Sherr, B. E., Cole, J. J, Handbook of Methods in Aquatic Microbial Ecology, Boca Raton: Lewis Publishers, 509–512, 1993.
Koch, B. P., Witt, M. R., Engbrodt, R., Dittmar, T., and Kattner, G.: Molecular formulae of marine and terrigenous dissolved organic matter detected by electrospray ionization Fourier trans-form ion cyclotron resonance mass spectrometry. Geochim. Cosmochim. Ac., 69, 3299– 30
3308, 2005.
Koch, B. P., Dittmar, T., Witt, M., and Kattner, G.: Fundamentals of molecular formula assign-ment to ultrahigh resolution mass data of natural organic matter, Anal. Chem., 79, 1758–
BGD
8, 11453–11488, 2011
A molecular perspective on the
ageing
R. Flerus et al.
Title Page
Abstract Introduction
Conclusions References
Tables Figures
◭ ◮
◭ ◮
Back Close
Full Screen / Esc
Printer-friendly Version Interactive Discussion
Discussion
P
a
per
|
Dis
cussion
P
a
per
|
Discussion
P
a
per
|
Discussio
n
P
a
per
1763, 2007.
Koch, B. P. and Kattner, G.: Sources and rapid biogeochemical transformation of dissolved organic matter in the Atlantic Surface Ocean, to be submitted to Biogeosciences, 2011. Kujawinski, E. B., Longnecker, K., Blough, N. V., Del Vecchio, R., Finlay, L., Kitner, J. B.,
and Giovannoni, S. J.: Identification of possible source markers in marine dissolved organic 5
matter using ultra high resolution mass spectrometry, Geochim. Cosmochim. Ac., 73, 4384– 4399, 2009.
Loh, A. N., Bauer, J. E., and Druffel, E. R. M.: Variable ageing and storage of dissolved organic components, Nat., 430, 877–881, 2004.
Ogawa, H., Amagai, Y., Koike, I., Kaiser, K., and Benner, R.: Production of refractory dissolved 10
organic matter by bacteria, Science, 292, 917–920, 2001.
Ogawa, H., Fukuda, R., and Koike, I.: Vertical distributions of dissolved organic carbon and nitrogen in the Southern Ocean, Deep-Sea Res. Pt. I, 46, 1809–1826, 1999.
Ogawa, H. and Tanoue, E.: Dissolved organic matter in oceanic waters, J. Oceanogr., 59, 129–147, 2003.
15
Repeta D. J. and Aluwihare L. I.: Radiocarbon analysis of neutral sugars in high-molecular-weight dissolved organic carbon: implications for organic carbon cycling, Limnol. Oceanogr., 51, 1045–1053, 2006.
Santschi, P. H., Guo, L. D., Baskaran, M., Trumbore, S., Southon, J., Bianchi, T. S., Honeyman, B., and Cifuentes, L.: Isotopic evidence for the contemporary origin of high-molecular weight 20
organic matter in oceanic environments, Geochim. Cosmochim. Ac., 59, 625–631, 1995. Sleighter, R. L. and Hatcher, P. G.: Molecular characterization of dissolved organic matter
(DOM) along a river to ocean transect of the lower Chesapeake Bay by ultrahigh resolution electrospray ionization Fourier transform ion cyclotron resonance mass spectrometry, Mar. Chem., 110, 140–152. 2008.
25
Smith, D. C. and Azam, F.: A simple, economical method for measuring bacterial protein syn-thesis rates in seawater using3H-leucine, Mar. Microb. Food Webs, 6, 107–114, 1992. Sofer, Z.: Preparation of carbon dioxide for stable carbon isotope analysis of petroleum
frac-tions, Anal. Chem., 52, 1389–1391, 1980.
Stenson, A. C., Marshall, A. G., and Cooper, W. T.: Exact masses and chemical formulas of 30
BGD
8, 11453–11488, 2011
A molecular perspective on the
ageing
R. Flerus et al.
Title Page
Abstract Introduction
Conclusions References
Tables Figures
◭ ◮
◭ ◮
Back Close
Full Screen / Esc
Printer-friendly Version Interactive Discussion
Discussion
P
a
per
|
Dis
cussion
P
a
per
|
Discussion
P
a
per
|
Discussio
n
P
a
per
|
1977.
Tans, P., NOAA/ESRL (www.esrl.noaa.gov/gmd/ccgg/trends/) and Dr. Ralph Keeling, Scripps Institution of Oceanography (scrippsco2.ucsd.edu/), 2011.
Vogel, J. S., Nelson, D. E., and Southon, J. R.:14C background levels in an accelerator mass spectrometry system, Radiocarb., 29, 323–333, 1987.
5
Williams, P. M., and Druffel, E. R. M.: Radiocarbon in dissolved organic matter in the central North Pacific Ocean., Nature, 330, 246–248, 1987.
Witt, M., Fuchser, J., and Koch, B. P.: Fragmentation studies of fulvic acids using collision induced dissociation Fourier transform ion cyclotron resonance mass spectrometry, Anal. Chem., 81, 2688–2694, 2009.
10
BGD
8, 11453–11488, 2011
A molecular perspective on the
ageing
R. Flerus et al.
Title Page
Abstract Introduction
Conclusions References
Tables Figures
◭ ◮
◭ ◮
Back Close
Full Screen / Esc
Printer-friendly Version Interactive Discussion
Discussion
P
a
per
|
Dis
cussion
P
a
per
|
Discussion
P
a
per
|
Discussio
n
P
a
per
Table 1.Calculated SPE-DOM∆14C values [‰] and DOC [µmol L−1
] in the deep water layers.
Depth [m] Parameter 46◦ N 8◦
W 37◦ N 14◦
W 23◦ N 20◦
W 11◦ N 20◦
W 2◦ S 14◦
W 5◦ N 7◦
W 17◦ S 3◦
W 24◦ S 9◦
W
400–500 ∆14C [‰] –406
800–900 ∆14C [‰] –465 –461 –442 –443
1100–1800 ∆14C [‰] –451 –476 –442
2500 ∆14C [‰] –481
4000–5000 ∆14C [‰] –449 –481 –473 –455 –445 –453
400–500 DOC [µmol L−1] 56 58 800–900 DOC [ µmol L−1
] 45 47 46 49
1100–1800 DOC [µmol L−1
] 50 48 52 54 47
2500 DOC [ µmol L−1
] 48 45
4000–5000 DOC [µmol L−1
BGD
8, 11453–11488, 2011
A molecular perspective on the
ageing
R. Flerus et al.
Title Page
Abstract Introduction
Conclusions References
Tables Figures
◭ ◮
◭ ◮
Back Close
Full Screen / Esc
Printer-friendly Version Interactive Discussion
Discussion
P
a
per
|
Dis
cussion
P
a
per
|
Discussion
P
a
per
|
Discussio
n
P
a
per
|
Table 2.Sum formulas of compounds represented by mass peaks which are provided to com-pare marine SPE-DOM regarding the degradation state.
NEG correlating compounds POS correlating compounds
C17H20O8 C13H18O7
C17H20O9 C14H20O8
C19H22O10 C15H22O7
C20H22O10 C15H22O8
C20H24O11 C16H24O8
BGD
8, 11453–11488, 2011
A molecular perspective on the
ageing
R. Flerus et al.
Title Page
Abstract Introduction
Conclusions References
Tables Figures
◭ ◮
◭ ◮
Back Close
Full Screen / Esc
Printer-friendly Version Interactive Discussion
Discussion
P
a
per
|
Dis
cussion
P
a
per
|
Discussion
P
a
per
|
Discussio
n
P
a
per
Table 3.Calculated∆14C values of excess SPE-DOM and corresponding Keeling slope values for the 7 deep stations of the East Atlantic Ocean.
Station ∆14C of excess SPE-DOM
Keeling slope
46◦
N, 8◦
W –121 –6880
37◦
N, 14◦
W 108 –11 394
23◦
N, 20◦
W 17 –10 050
11◦
N, 20◦
W 50 –9938
2◦
N, 14◦
W 68 –10 203
5◦
S, 7◦
W 76 –10 550
BGD
8, 11453–11488, 2011
A molecular perspective on the
ageing
R. Flerus et al.
Title Page
Abstract Introduction
Conclusions References
Tables Figures
◭ ◮
◭ ◮
Back Close
Full Screen / Esc
Printer-friendly Version Interactive Discussion
Discussion
P
a
per
|
Dis
cussion
P
a
per
|
Discussion
P
a
per
|
Discussio
n
P
a
per
|
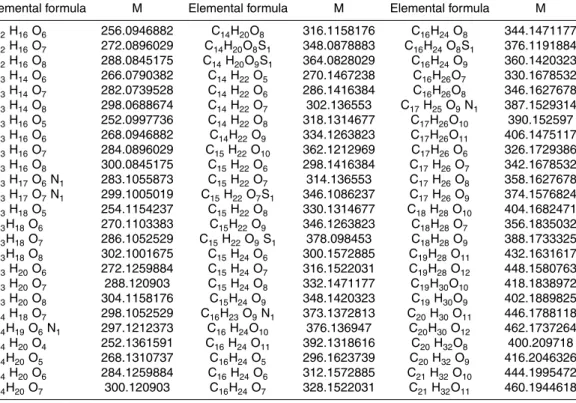
Table A1. POS molecular formulas: Complete list of mass peaks and assigned molecular formulas which showed a highly significant positive correlation (p <0.01) with SPE-DOM∆14C.
Elemental formula M Elemental formula M Elemental formula M
C12H16O6 256.0946882 C14H20O8 316.1158176 C16H24O8 344.1471177
C12H16O7 272.0896029 C14H20O8S1 348.0878883 C16H24O8S1 376.1191884
C12H16O8 288.0845175 C14H20O9S1 364.0828029 C16H24O9 360.1420323
C13H14O6 266.0790382 C14H22O5 270.1467238 C16H26O7 330.1678532
C13H14O7 282.0739528 C14H22O6 286.1416384 C16H26O8 346.1627678
C13H14O8 298.0688674 C14H22O7 302.136553 C17H25O9N1 387.1529314
C13H16O5 252.0997736 C14H22O8 318.1314677 C17H26O10 390.152597
C13H16O6 268.0946882 C14H22O9 334.1263823 C17H26O11 406.1475117
C13H16O7 284.0896029 C15H22O10 362.1212969 C17H26O6 326.1729386
C13H16O8 300.0845175 C15H22O6 298.1416384 C17H26O7 342.1678532
C13H17O6N1 283.1055873 C15H22O7 314.136553 C17H26O8 358.1627678
C13H17O7N1 299.1005019 C15H22O7S1 346.1086237 C17H26O9 374.1576824
C13H18O5 254.1154237 C15H22O8 330.1314677 C18H28O10 404.1682471
C13H18O6 270.1103383 C15H22O9 346.1263823 C18H28O7 356.1835032
C13H18O7 286.1052529 C15H22O9S1 378.098453 C18H28O9 388.1733325
C13H18O8 302.1001675 C15H24O6 300.1572885 C19H28O11 432.1631617
C13H20O6 272.1259884 C15H24O7 316.1522031 C19H28O12 448.1580763
C13H20O7 288.120903 C15H24O8 332.1471177 C19H30O10 418.1838972
C13H20O8 304.1158176 C15H24O9 348.1420323 C19H30O9 402.1889825
C14H18O7 298.1052529 C16H23O9N1 373.1372813 C20H30O11 446.1788118
C14H19O6N1 297.1212373 C16H24O10 376.136947 C20H30O12 462.1737264
C14H20O4 252.1361591 C16H24O11 392.1318616 C20H32O8 400.209718
C14H20O5 268.1310737 C16H24O5 296.1623739 C20H32O9 416.2046326
C14H20O6 284.1259884 C16H24O6 312.1572885 C21H32O10 444.1995472
C14H20O7 300.120903 C16H24O7 328.1522031 C21H32O11 460.1944618
BGD
8, 11453–11488, 2011
A molecular perspective on the
ageing
R. Flerus et al.
Title Page
Abstract Introduction
Conclusions References
Tables Figures
◭ ◮
◭ ◮
Back Close
Full Screen / Esc
Printer-friendly Version Interactive Discussion
Discussion
P
a
per
|
Dis
cussion
P
a
per
|
Discussion
P
a
per
|
Discussio
n
P
a
per
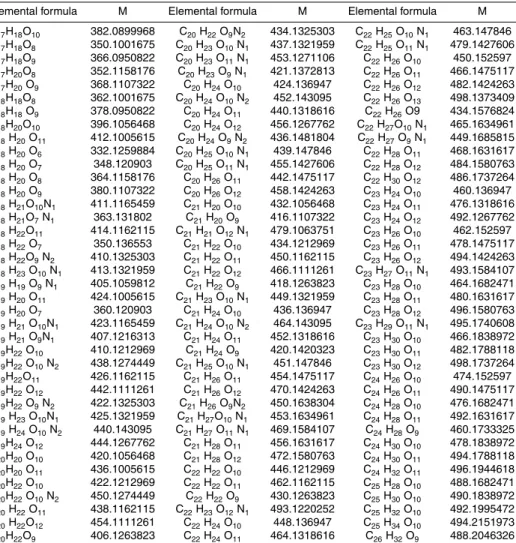
Table A2. NEG molecular formulas: Complete list of mass peaks and assigned molecular formulas which showed a highly significant negative correlation (p <0.01) with SPE-DOM∆14C.
Elemental formula M Elemental formula M Elemental formula M
BGD
8, 11453–11488, 2011
A molecular perspective on the
ageing
R. Flerus et al.
Title Page
Abstract Introduction
Conclusions References
Tables Figures
◭ ◮
◭ ◮
Back Close
Full Screen / Esc
Printer-friendly Version Interactive Discussion
Discussion
P
a
per
|
Dis
cussion
P
a
per
|
Discussion
P
a
per
|
Discussio
n
P
a
per
|
Fig. 1. Negative ESI FT-ICR mass spectrum of a representative marine SPE-DOM sample from the Eastern Atlantic Ocean.
BGD
8, 11453–11488, 2011
A molecular perspective on the
ageing
R. Flerus et al.
Title Page
Abstract Introduction
Conclusions References
Tables Figures
◭ ◮
◭ ◮
Back Close
Full Screen / Esc
Printer-friendly Version Interactive Discussion
Discussion
P
a
per
|
Dis
cussion
P
a
per
|
Discussion
P
a
per
|
Discussio
n
P
a
per
|
Fig. 3.Linear correlation between the∆14C values and the FT-ICR mass peaks of East Atlantic Ocean SPE-DOM. The sum of the normalized magnitudes of the mass peaks with a highly sig-nificant correlation of(a)negatively correlated and(b)positively correlated masses are plotted versus∆14C values.
BGD
8, 11453–11488, 2011
A molecular perspective on the
ageing
R. Flerus et al.
Title Page
Abstract Introduction
Conclusions References
Tables Figures
◭ ◮
◭ ◮
Back Close
Full Screen / Esc
Printer-friendly Version Interactive Discussion
Discussion
P
a
per
|
Dis
cussion
P
a
per
|
Discussion
P
a
per
|
Discussio
n
P
a
per
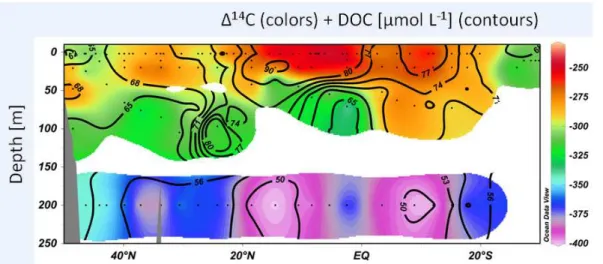
Fig. 4.Calculated SPE-DOM∆14C values (colors) and measured water sample DOC concen-trations (contours) in the upper 250 m of the water column in the East Atlantic Ocean. The
BGD
8, 11453–11488, 2011
A molecular perspective on the
ageing
R. Flerus et al.
Title Page
Abstract Introduction
Conclusions References
Tables Figures
◭ ◮
◭ ◮
Back Close
Full Screen / Esc
Printer-friendly Version Interactive Discussion
Discussion
P
a
per
|
Dis
cussion
P
a
per
|
Discussion
P
a
per
|
Discussio
n
P
a
per
|
Fig. 5. Selected normalized FT-ICR mass peaks of Eastern Atlantic Ocean SPE-DOM. The mass peaks show a significant linear correlation with ∆14C. (a) Surface sample extract with
∆14C=–237 and(b)deep sea sample extract with∆14C=–481. The black colored masses are positively correlated with∆14C and the white colored masses negatively.
BGD
8, 11453–11488, 2011
A molecular perspective on the
ageing
R. Flerus et al.
Title Page
Abstract Introduction
Conclusions References
Tables Figures
◭ ◮
◭ ◮
Back Close
Full Screen / Esc
Printer-friendly Version Interactive Discussion
Discussion
P
a
per
|
Dis
cussion
P
a
per
|
Discussion
P
a
per
|
Discussio
n
P
a
per
|
Fig. 7. Van Krevelen diagrams of CHO, CHON and CHOS compounds in Eastern Atlantic Ocean SPE-DOM. Shown are the relative magnitude ratios of the compounds from old deep water DOM to young surface water DOM. Lowest ratios are represented by white color, highest ratios by black color. The upper dotted line refers to any fully saturated open chain aliphatic carboxylic acids; the lower dotted line connects the virtual end members CH2 and CO and bisects nearly the compositional space of CRAM (from Hertkorn et al. 2006).
BGD
8, 11453–11488, 2011
A molecular perspective on the
ageing
R. Flerus et al.
Title Page
Abstract Introduction
Conclusions References
Tables Figures
◭ ◮
◭ ◮
Back Close
Full Screen / Esc
Printer-friendly Version Interactive Discussion
Discussion
P
a
per
|
Dis
cussion
P
a
per
|
Discussion
P
a
per
|
Discussio
n
P
a
per
|
Fig. 9. Correlation and equations of (a) amino sugar yields and(b) DOC concentrations of Atlantic Ocean water and calculated∆14C values of the corresponding SPE-DOM.
BGD
8, 11453–11488, 2011
A molecular perspective on the
ageing
R. Flerus et al.
Title Page
Abstract Introduction
Conclusions References
Tables Figures
◭ ◮
◭ ◮
Back Close
Full Screen / Esc
Printer-friendly Version Interactive Discussion
Discussion
P
a
per
|
Dis
cussion
P
a
per
|
Discussion
P
a
per
|
Discussio
n
P
a
per
![Table 1. Calculated SPE-DOM ∆ 14 C values [‰] and DOC [µmol L −1 ] in the deep water layers.](https://thumb-eu.123doks.com/thumbv2/123dok_br/18242838.341388/22.918.44.670.262.446/table-calculated-spe-dom-values-µmol-water-layers.webp)