523
THE MOST FREQUENT HOSPITAL-ACQUIRED INFECTIONS RELATED TO MEDICAL INTERVENTIONS IN HOSPITALS IN VOJVODINA PROVINCE
GORANA ĆOSIĆ1, JELANA ĐEKIĆ1, M. PETROVIĆ1, GORDANA KRTINIĆ2,
TATJANA KARAĆ3, JASMINA JANDRIĆ-KOČIĆ4 and LJILJANA MARKOVIĆ-DENIĆ5
¹ Institute of Public Health of Vojvodina, 21000Novi Sad, Serbia
2 Institute of Public Health Subotica, 24000Subotica, Serbia 3 Institute of Public Health Kikinda, 23300Kikinda, Serbia
4 Institute of Public Health Sremska Mitrovica, 22000Sremska Mitrovica, Serbia 5 Faculty of Medicine, University of Belgrade, 11000Belgrade, Serbia
Abstract - Infections associated with medical procedures, or hospital-acquired infections (HAIs), occur in all hospitals worldwide. An integrated infection-control program with HAI surveillance as its cornerstone can reduce the incidence of HAIs and contribute to economic beneits. he aim of this paper was to report the prevalence and epidemiological features of HAI in hospitals in Vojvodina, Serbia. he study population examined herein was compromised of all of the patients present in the ward at least 48 hours before the day of surveillance. It also included patients that were scheduled for discharge or transfer, and those temporarily absent from the ward for examinations or diagnostic procedures. Data were collected using uniform questionnaires, created by the scientiic board of the study. Data from paper questionnaires were entered into a specially created electronic database and analyzed using standard statistical methods. A total of 2 435 patients were included in the study. he frequency of patients with HAI was 6.6% (95% CI: 5.6%-7.6%), and the prevalence of infection was 7.1% (95% CI: 6.1%-8.1%). HAI prevalence was signiicantly diferent depending on the ward, ranging from 1.7% in the gynecology department to 18.1% in intensive care departments. he most common type of HAI was pneumonia, representing 20.9% of all reported HAIs. he second most frequently reported type of HAI was surgical site infection (19.8%), followed by urinary tract infection (17.4%), gastro-intestinal infection (14.5%) and bloodstream infection (11.0%). he most commonly found microorganisms were Enterococcus spp. (14.5%), Klebsiella pneumoniae (14.5%), Acinetobacter spp. (13.7%), coagulase-negative Staphylococcus spp. (12.1%), Pseudomonas aeruginosa (10.5%) and Clostridium diicile (7.3%). he most frequently used antibiotics in therapy were third generation cephalosporins to which most of the isolates showed resistance. Although the consumption of carbapenems in this sample was only 8%, the registered carbapenem resistance in some bacteria indicates more frequent and longer use of carbapenems in hospitals with the side efect of selective pressure.
Key words: Prevalence, hospital-acquired infections
INTRODUCTION
Hospital-acquired infections (HAIs) are a major worldwide public health problem dating back to the irst hospitals, and it remains important today. It is well known that HAIs have been associated with
sig-niicant morbidity and attributable mortality, as well as greatly increased healthcare costs (Rosenthal et al., 2008).
shown that an integrated infection-control program with HAI surveillance as its cornerstone can reduce the incidence of HAIs by 30%, yielding economic beneits (Haleyet al., 1980; Gastmeieret al., 2006).
Surveillance of HAIs is an important component of comprehensive infection prevention and control programs (Haley et al., 1985). he gold standard for epidemiological surveillance is prospective ac-tive surveillance. Point prevalence surveys (PPS), although not as accurate as the traditional prospec-tive method, provide baseline information about the occurrence and distribution of HAIs within a health-care institution and help to establish priorities for in-fection prevention and control departments.
Repeated prevalence surveys have been used for the evaluation of infection control programs, for intra-hospital comparisons, to follow trends in HAI rates, to determine rates of device utilization and antibiotic usage, and to measure adverse efects and costs associated with these infections (French et al., 1989; Weinstein et al., 1999; Sax et al., 2001; French et al., 1991).
During an expert meeting held in Brussels in No-vember 2010, it was recommended that PPSs of HAIs and antimicrobial use should be carried out at least once every ive years, and the patient-based protocol was selected as the preferred methodology for future PPSs (Goossens et al., 2011). he irst prevalence study of hospital infections in Serbia was conducted in 1999, the second in 2005 and the third in 2010 (Marković-Denić et al., 2000, 2007, 2010).
his paper presents data obtained during the third national prevalence survey of the prevalence of HAIs and their general epidemiological features in the Autonomous Province of Vojvodina (APV), northern Serbia. he aim was to identify the most common localization and prevalence of HAIs in dif-ferent departments, to consider the most common risk factors, the most frequent microbiological agents of HAIs, as well as their resistance to antibiotics, and to determine patterns of antimicrobial use.
MATERIALS AND METHODS
he point prevalence study was carried out in No-vember 2010 in 12 hospitals in the APV. It included 8 general hospitals (secondary level), 5 university hospitals (tertiary level) and 4 specialized institutes. Patients hospitalized in the internal medicine, sur-gery, obstetric and gynecology, pediatrics and inten-sive care departments, at least 48 hours before the day of surveillance (including those scheduled for discharge or transfer, and those temporarily absent from the ward for examinations or diagnostic proce-dures) were included.
All patients with acute infection on the day of study were registered as patients with HAI except those who already had an infection or were in the incubation period on the day of admission. Several infections of diferent anatomic localization in the same patient were registered as separate (other) in-fections. National deinitions and criteria based on US CDC deinitions were used to set up diagnosis of HAIs (Drndarević et al., 1998).
avail-able, microbiological analyses were collected within the next 72 hours.
Data were collected by the uniform question-naire according to the protocol created by the sci-entiic board of the study and the National Expert Committee for HAIs (www.batut.org.sr), ofering detailed instructions to pollsters for the registration and classiication of hospital infections.
Hospital personnel dedicated to collect data were educated in the irst phase of the study and in the phase of study implementation were coordinated by epidemiologists from the regional Public Health Institutes. Final evaluation of data from all hospitals in the province was done at the Institute of Public Health of Vojvodina.
Statistical analysis was performed using the Sta-tistical Package for Social Sciences Sotware (SPSS Inc, version 7.50, Chicago, IL). he results were ex-pressed as the mean ± SD or as a proportion of the total number of patients. Relations between categori-cal variables and NI were irst evaluated using con-tingency table analysis and χ² test or Fisher’s Exact Probability Test and univariate logistic regression analysis. he Student’s t-test was used for comparison of parametric continuous variables. he odds ratios (OR) and corresponding 95% conidence intervals were computed for overall site infection rate.
RESULTS
A total of 2 435 patients were included in the study. he mean age of the patients was 54.7 ± years (rang-ing from 3 days to 94 years). he male-female ratio was 1:1.1.
here were 1 162 (47.7%) patients on medical units, 652 (26.8%) on surgical units, 280 (11.5%) on gynecology units, 214 (8.8%) on pediatric units and 127 (5.2%) in critical care units.
Overall, 6.6% patients had at least one HAI, rang-ing from 1.7% in gynecology departments, to 18.1% in intensive care departments (Table 1). he HAI
prevalence was signiicantly diferent depending on ward type (χ2 = 111.762, P = 0.0000).
he prevalence of HAIs was 6.2% in general hos-pitals, 6.3% in institute hospitals and 8.1% in clini-cal centers. here were no statisticlini-cally diferences in HAI prevalence and hospital types (χ2 = 0.836, P(χ2 > 0.836) = 0.3605).
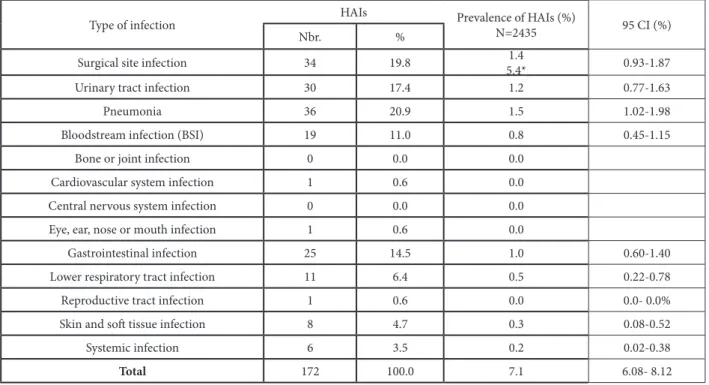
On the day of the survey, 160 patients had a total of 172 HAIs. hus, the prevalence of patients with HAI was 6.6 % (95% CI: 5.6-7.6%) and the preva-lence of infection was 7.1% (95% CI: 6.1-8.1%). On average, there were 1.1 HAIs per infected patient (or a total of 172 HAIs in 160 patients with HAI). Twelve patients (0.5%) had two HAIs.
he epidemiological characteristics of the
patients, medical devices and interventions
pro-vided to the patients and their association with
HAIs are shown in Table 1.
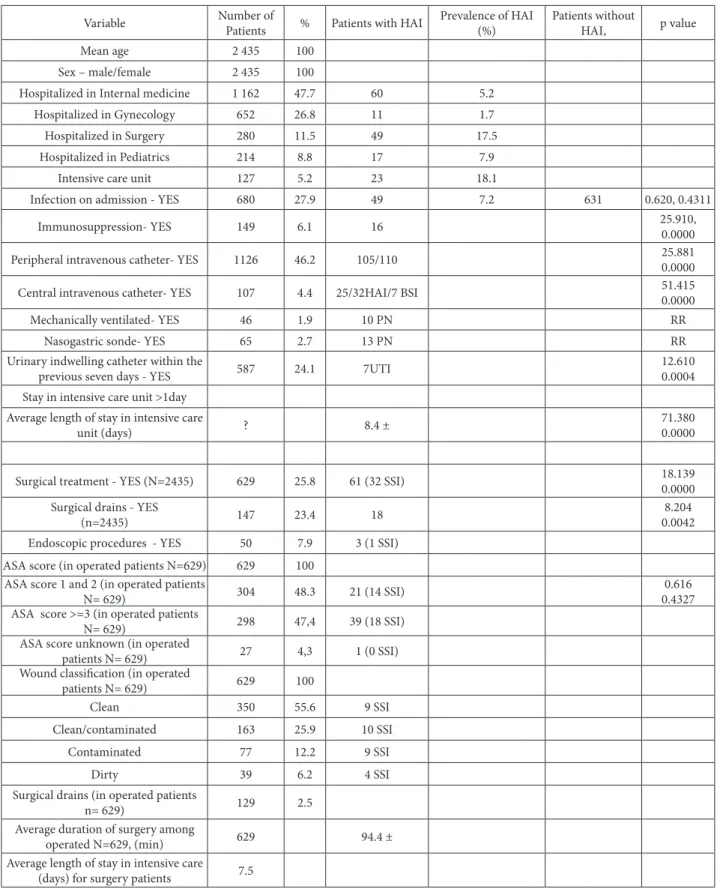
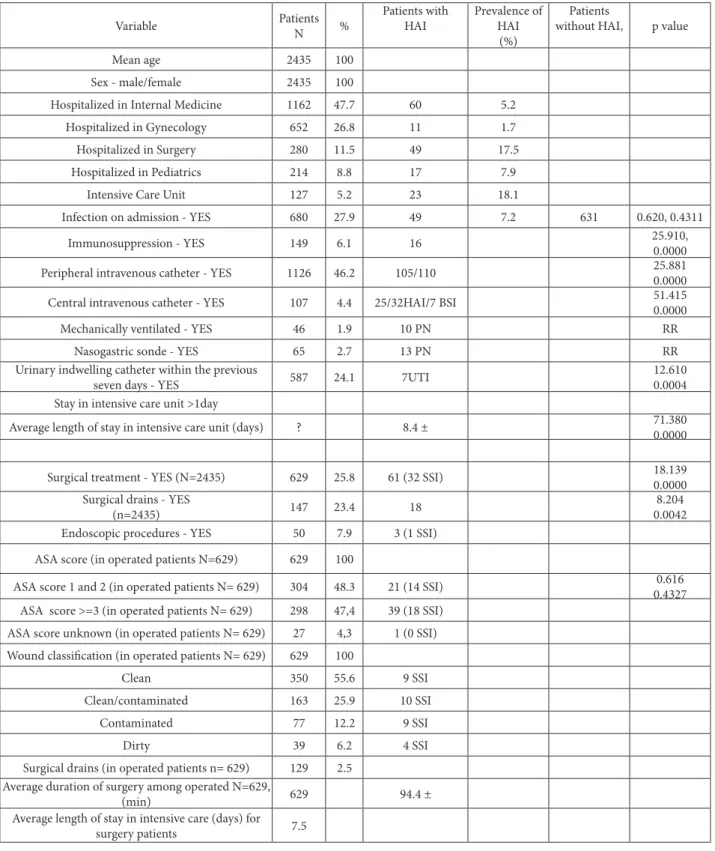
he most common devices used were periph-eral catheters (46.2% of patients) and urinary cath-eters (24.0% of patients) which were either in situ or present within the seven days before the survey was conducted. Mechanical ventilation and nasogastric sonde were less frequently applied but showed a sig-niicant association with HAIs. Relative risk for the development of pneumonia was signiicantly higher for patients with mechanical ventilation and na-sogastric sonde (P <0.0001).
he epidemiological variables with signiicant association with HAIs ater univariate analysis indi-cated that 7 (36.8%) of the 19 bloodstream infections (BSI) were central venous catheter- related and 10 (27.7%) of the 36 pneumonias were ventilator-as-sociated. he relative risk for development of pneu-monia or BSI was statistically signiicant for patients with invasive devices (p< 0.0001).
Table 1. Epidemiological variable in patients with and without hospital-acquired infection (univariate analysis), Vojvodina, Serbia, 2010.
Variable Number of
Patients % Patients with HAI
Prevalence of HAI (%)
Patients without
HAI, p value
Mean age 2 435 100
Sex – male/female 2 435 100
Hospitalized in Internal medicine 1 162 47.7 60 5.2
Hospitalized in Gynecology 652 26.8 11 1.7
Hospitalized in Surgery 280 11.5 49 17.5
Hospitalized in Pediatrics 214 8.8 17 7.9
Intensive care unit 127 5.2 23 18.1
Infection on admission - YES 680 27.9 49 7.2 631 0.620, 0.4311
Immunosuppression- YES 149 6.1 16 25.910,0.0000
Peripheral intravenous catheter- YES 1126 46.2 105/110 25.8810.0000
Central intravenous catheter- YES 107 4.4 25/32HAI/7 BSI 51.4150.0000
Mechanically ventilated- YES 46 1.9 10 PN RR
Nasogastric sonde- YES 65 2.7 13 PN RR
Urinary indwelling catheter within the
previous seven days - YES 587 24.1 7UTI
12.610 0.0004 Stay in intensive care unit >1day
Average length of stay in intensive care
unit (days) ? 8.4 ±
71.380 0.0000
Surgical treatment - YES (N=2435) 629 25.8 61 (32 SSI) 18.139
0.0000 Surgical drains - YES
(n=2435) 147 23.4 18
8.204 0.0042 Endoscopic procedures - YES 50 7.9 3 (1 SSI)
ASA score (in operated patients N=629) 629 100 ASA score 1 and 2 (in operated patients
N= 629) 304 48.3 21 (14 SSI)
0.616 0.4327 ASA score >=3 (in operated patients
N= 629) 298 47,4 39 (18 SSI)
ASA score unknown (in operated
patients N= 629) 27 4,3 1 (0 SSI)
Wound classiication (in operated
patients N= 629) 629 100
Clean 350 55.6 9 SSI
Clean/contaminated 163 25.9 10 SSI
Contaminated 77 12.2 9 SSI
Dirty 39 6.2 4 SSI
Surgical drains (in operated patients
n= 629) 129 2.5
Average duration of surgery among
operated N=629, (min) 629 94.4 ±
surgical site infection (19.8%), followed by urinary tract infection (17.4%), gastro-intestinal infection (14.5%) and bloodstream infection (11.0%). Gas-trointestinal infection caused by Clostridium diicile
represented 5.2% of all HAIs.
Microbiology
72.1% of the HAIs (124/172) were documented by
microbiological results. he total number of isolates was 124 and total number of microorganisms 25. he most commonly isolated groups of microorganisms were equally Gram-positive cocci and Enterobacte-riaceae (33.9% each) (Table 3).
he most commonly found micro- organisms were Enterococcus spp. (14.5%), Klebsiella pneumo-niae (14.5%), Acinetobacter spp. (13.7%),
coagulase-Table 2. Prevalence and relative percentage of healthcare-associated infection by type of infection, Vojvodina Province, Serbia, 2010.
Type of infection HAIs Prevalence of HAIs (%)
N=2435 95 CI (%)
Nbr. %
Surgical site infection 34 19.8 5.4*1.4 0.93-1.87
Urinary tract infection 30 17.4 1.2 0.77-1.63
Pneumonia 36 20.9 1.5 1.02-1.98
Bloodstream infection (BSI) 19 11.0 0.8 0.45-1.15
Bone or joint infection 0 0.0 0.0
Cardiovascular system infection 1 0.6 0.0
Central nervous system infection 0 0.0 0.0
Eye, ear, nose or mouth infection 1 0.6 0.0
Gastrointestinal infection 25 14.5 1.0 0.60-1.40
Lower respiratory tract infection 11 6.4 0.5 0.22-0.78
Reproductive tract infection 1 0.6 0.0 0.0- 0.0%
Skin and sot tissue infection 8 4.7 0.3 0.08-0.52
Systemic infection 6 3.5 0.2 0.02-0.38
Total 172 100.0 7.1 6.08- 8.12
*he denominator is 629 (patients that underwent surgery).
Table 3. Major groups of microorganisms, Vojvodina, Serbia, 2010.
Group of microorganisms Isolates
N %
Gram-positive cocci 42 33.9
Gram-negative - Enterobacteriaceae 42 33.9
Gram-negative bacteria - non fermentative 30 24.2
Gram-positive bacilli - Clostridium diicile 9 7.3
Candida albicans 1 0.8
negative Staphylococcus spp. (12.1%), Pseudomonas aeruginosa (10.5%) and Clostridium diicile (7.3%).
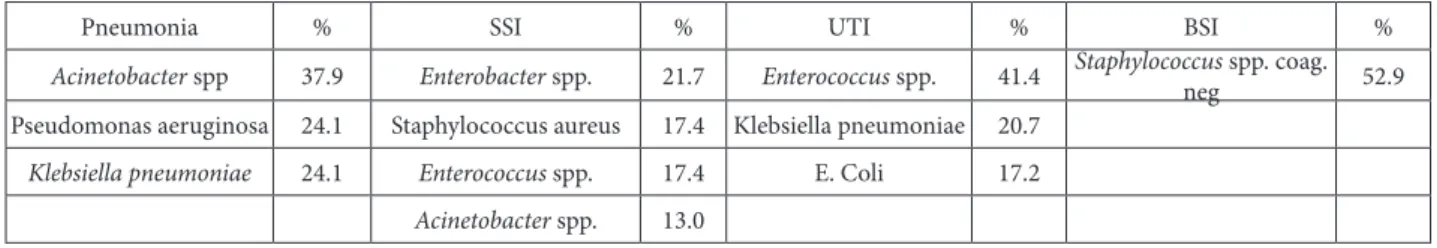
Gram-negative organisms accounted for the ma-jority of cases of pneumonia while most UTIs and BSIs were caused by Gram-positive cocci (staphylo-cocci and entero(staphylo-cocci).
Microbiological examination results were avail-able in 55.6% of PN, 55.8% of SSI, 84.2% of BSI and 90% of UTI.
For 72.1% of the HAIs, a positive microbiology result was available. It revealed the presence of 36.0% gastro-intestinal infections and 90.0% in urinary tract infections (Table 5).
Table 4. Most prevalent species of microorganisms, Vojvodina, Serbia, 2010.
Most common types of microorganisms Number of isolates %
Acinetobacter spp. 17 13.7
Klebsiella pneumoniae 18 14.5
Pseudomonas aeruginosa 13 10.5
Citrobacter spp. 1 0.8
Clostridium diicile 9 7.3
Other Streptococcus spp. 1 0.8
Other 1 0.8
Enterobacter spp. 6 4.8
Enterococcus spp. 18 14.5
Escherichia coli 11 8.9
Proteus mirabilis 2 1.6
Staphylococcus aureus 6 4.8
Staphylococcus spp. coagulase-negative 15 12.1
Streptococcus pneumoniae 1 0.8
Candida albicans 1 0.8
Other Enterobacteriaceae 1 0.8
Morganella morganii 1 0.8
Proteus vulgaris 1 0.8
Streptococcus agalactiae (B) 1 0.8
Total 124 100.0
Table 5. Distribution of microorganisms isolated in healthcare-associated infections by main type of infection point prevalence survey in 2010 (n=124).
Pneumonia % SSI % UTI % BSI %
Acinetobacter spp 37.9 Enterobacter spp. 21.7 Enterococcus spp. 41.4 Staphylococcus spp. coag.
neg 52.9
Pseudomonas aeruginosa 24.1 Staphylococcus aureus 17.4 Klebsiella pneumoniae 20.7
Klebsiella pneumoniae 24.1 Enterococcus spp. 17.4 E. Coli 17.2
With 36%, Clostridium diicile was the main pathogen causing gastrointestinal infections (infec-tion prevalence 5.2%).
he percentage of methicillin-resistant S. aureus
(MRSA) was 33.3% and that of glycopeptide-resist-ant Enterococcus spp. 5.6%.
Carbapenem resistance was reported in 46.1% of
Pseudomonas aeruginosa and 52.9% of Acinetobacter
spp.
Antimicrobial use
At the time of the survey, 1 067 (43.8%) patients were receiving at least one antimicrobial agent, while 311 (21.1%) were being treated with two drugs, 49 (4.6%) with three drugs and 6 (0.5%) with four drugs.
Of these, 326 (30.5%) patients were receiving at least one antimicrobial agent for prophylaxis and 714 (66.9%) patients were receiving at least one antimi-crobial agent for therapy indication.
Of those patients with an HAI, 92.5% were re-ceiving at least one antibiotic at the time of survey.
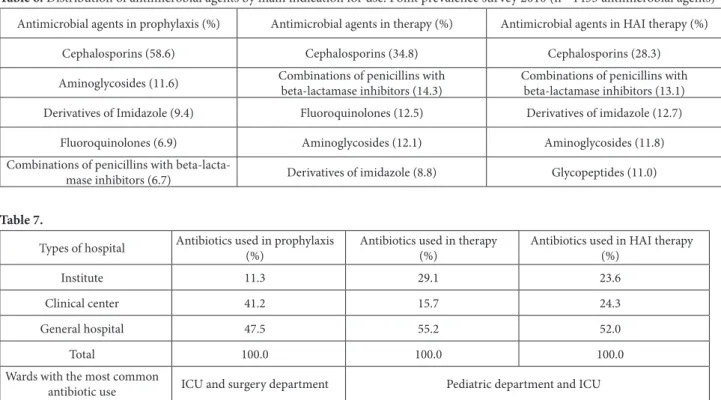
he most frequently used drugs for prophylax-is were cephalosporins (58.6%), aminoglycosides (11.6%) and derivatives of imidazole (9.4%).
he most commonly prescribed antimicrobial agents for therapy were cephalosporins (34.8%), com-binations of penicillins with beta-lactamase inhibi-tors (14.3%), luoroquinolones (12.5%), aminogly-cosides (12.1%) and derivatives of imidazole (8.8%); 4.5% of the patients surveyed were on vancomycin.
he proportion of patients receiving antimicro-bial treatment at the time of survey varied in diferent types of hospitals from 11.3% in institutes, to 47.5% in general hospitals (χ2 = 122.454. P(χ2 > 122.454) = 0.0000), and also varied in diferent departments (from 0.5% in pediatric department to 29.9% in in-tensive care).
Table 6. Distribution of antimicrobial agents by main indication for use. Point prevalence survey 2010 (n= 1433 antimicrobial agents)
Antimicrobial agents in prophylaxis (%) Antimicrobial agents in therapy (%) Antimicrobial agents in HAI therapy (%)
Cephalosporins (58.6) Cephalosporins (34.8) Cephalosporins (28.3)
Aminoglycosides (11.6) Combinations of penicillins with beta-lactamase inhibitors (14.3)
Combinations of penicillins with beta-lactamase inhibitors (13.1) Derivatives of Imidazole (9.4) Fluoroquinolones (12.5) Derivatives of imidazole (12.7)
Fluoroquinolones (6.9) Aminoglycosides (12.1) Aminoglycosides (11.8)
Combinations of penicillins with
beta-lacta-mase inhibitors (6.7) Derivatives of imidazole (8.8) Glycopeptides (11.0)
Table 7.
Types of hospital Antibiotics used in prophylaxis (%)
Antibiotics used in therapy (%)
Antibiotics used in HAI therapy (%)
Institute 11.3 29.1 23.6
Clinical center 41.2 15.7 24.3
General hospital 47.5 55.2 52.0
Total 100.0 100.0 100.0
Wardswiththe most common
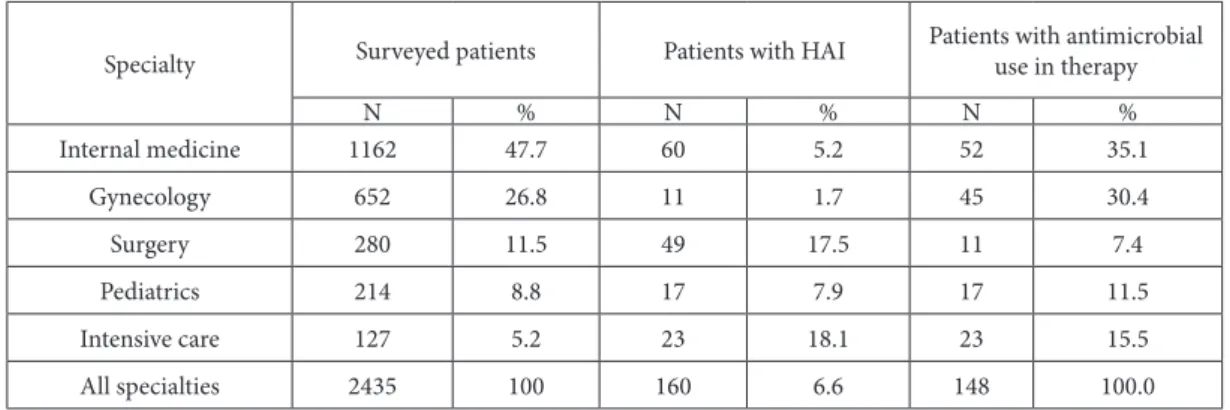
Table 8. Prevalence of healthcare-associated infections and antimicrobial use in surveyed patients, by specialty, during the point preva-lence survey, 2010 (n=2435).
Specialty Surveyed patients Patients with HAI
Patients with antimicrobial use in therapy
N % N % N %
Internal medicine 1162 47.7 60 5.2 52 35.1
Gynecology 652 26.8 11 1.7 45 30.4
Surgery 280 11.5 49 17.5 11 7.4
Pediatrics 214 8.8 17 7.9 17 11.5
Intensive care 127 5.2 23 18.1 23 15.5
All specialties 2435 100 160 6.6 148 100.0
Among the patients with HAI, 148 (92.5%) were receiving at least one antibiotic for therapeutic pur-poses. Two antibiotics were being given to 71 (44.4%) patients, three antibiotics to 16 (10%) and four anti-biotics to 3 (1.8%) patients.
he proportion of patients with antimicrobial treatment for therapy varied in diferent types of hos-pitals from 15.7% in clinical centers to 55.2% in gen-eral hospitals (χ2 = 22.615. P(χ2 > 22.615) = 0.0000). In addition, there were statistically signiicant difer-ences between hospital departments, ranging from 15.5% for gynecology to 53.7% for pediatric depart-ments (χ2 = 116.481. P(χ2 > 116.481) = 0.0000).
DISCUSSION
Large multicenter prevalence surveys have been con-ducted in Europe during the past decades and have shown an overall prevalence of HAI infections of 4-10 % (7.1%) (Gravel et al., 2007; Kampf et al., 1997; Emmerson et al., 1996; Scheel et al., 1998; Vaque et al., 1999; Pittet et al., 1999).
he range of reported prevalence results in stud-ies that used CDC deinitions for HAIs in non-EU countries ranged from 4.9% in Mauritius in 1992 to 19.1% in Malaysia in 2001 (Allegranzi et al., 2011).
Such a range in the prevalence of HAIs could be explained by diferences in methodology and patient
case-mix, and should not immediately be interpreted as an indication of variations in performance (Zarb et al., 2012).
he irst national prevalence study in Serbia was performed in 1999 in 27 hospitals; the second was done in 2005 in 56 hospitals and the third in 2010 in 61 hospitals. he prevalence of patients with at least one HAI was 6.3%, 3.1% and 4.9%, respectively, and the HAI prevalence was 7.5%, 3.5% and 5.3%, respectively.
hus, the HAI prevalence of 7.1% (with 6.6% of patients infected) observed in our study is compara-ble to that reported in other European studies (Lani-ni et al., 2009; Struwe et al., 2006; he RAISIN Work-ing Group, 2009) and to the European prevalence of HAIs of 7.1% estimated by ECDC based on a review of 30 national or multicenter PPSs in 19 countries in its Annual Epidemiological Report for 2008 (ECDC, 2008).
he prevalence of HAI in this study is within the range reported by researchers from developing coun-tries (Zarb et al., 2012; Lanini et al., 2009; Struwe et al., 2006).
medical experience and, in many cases, diferent methodologies (Marković-Denić, 2011).
he prevalence of HAIs and the prevalence of patients with HAIs in the results of our survey were little higher than results of third national point prevalence study, but very similar to the results of a recently published pilot prevalence study in Europe (7.1% and 7.6%, respectively) (Zarb et al., 2012).
he occurrence of nosocomial infections difers in diferent hospitals and diferent wards, and in pa-tients diagnosed diferently. he highest prevalence rates of HAI were observed in intensive care units and surgery wards, similar to results of other studies (Gravel et al., 2007; Scheel and Stormark, 1998; Zarb et al., 2012; Struwe et al., 2006; van der Kooi et al., 2010; Sánchez-Payá et al., 2009; Smyth et al., 2008; Eriksen et al., 2005)
he prevalence of HAI in critical care units (18.1%) or surgery departments (17.5%) was much higher than the overall prevalence of HAI (6.6%). his is an expected inding since the severity of ill-ness and susceptibility to HAI in such units is by deinition higher than that in patients in general units.
Diferences in infection rates between hospital wards can be explained by diferences between pa-tients, patient care, operations and other invasive procedures.
According to the results of previously conducted point prevalence studies, urinary tract infections are the leading health care-associated infection in devel-oped countries, while in developing countries or in countries that have recently established HAI control programs, the most frequent type of HAI is surgical site infection (Pittet et al., 1999).
According to the results of the irst national prev-alence study in Serbia, the leading type of HAI was SSI, while in the second and third prevalence stud-ies, the most frequent type of HAI was urinary tract infection.
he most common type of HAI in our survey was pneumonia, representing 20.9% of all reported HAIs. Similar results were found in a recently pub-lished pilot prevalence study of HAI in the EU (Zarb et al., 2012).
he following patient characteristics were sig-niicantly associated with pneumonia: infections present at time of admission, immunosuppression and surgery procedures, stay in the ICU; having a na-sogastric sonde or endotracheal tube and mechanical ventilation were also signiicantly associated with the development of pneumonia.
In our study, the use of devices was comparable with the results of other recent European studies (Humphreys et al., 2008; Lyytikainen et al., 2008).
he frequency of risk factors linked to medical services of patients with at least one risk factor is ex-tremely high (69.3%). he risk factor analysis indi-cated that the use of devices and procedures could be improved (urinary catheters, open surgical drains in approximately 20% of cases).
In our study, the percentage of HAIs documented by microbiological results was similar to the results of the third national prevalence study (68.2%), but higher than results from some other studies (59.1% were recorded in a European point prevalence study, and 41.1% in a Lithuanian national study) (Zarb et al., 2012; Struwe et al., 2006).
According to the results of systematic review and meta–analysis, Gram-negative bacilli were the most common nosocomial isolates, both in mixed popula-tion and in high-risk patients. More than half of the isolates in our survey belong to this group of micro-organisms.
he pathogens predominantly cultured are known to be a major cause for HAIs. Overall, the most commonly isolated microorganisms were En-terococcus spp. (14.5%) and Klebsiella pneumoniae
Table 9.
Variable Patients
N %
Patients with HAI
Prevalence of HAI
(%)
Patients
without HAI, p value
Mean age 2435 100
Sex - male/female 2435 100
Hospitalized in Internal Medicine 1162 47.7 60 5.2
Hospitalized in Gynecology 652 26.8 11 1.7
Hospitalized in Surgery 280 11.5 49 17.5
Hospitalized in Pediatrics 214 8.8 17 7.9
Intensive Care Unit 127 5.2 23 18.1
Infection on admission - YES 680 27.9 49 7.2 631 0.620, 0.4311
Immunosuppression - YES 149 6.1 16 25.910,0.0000
Peripheral intravenous catheter - YES 1126 46.2 105/110 25.8810.0000
Central intravenous catheter - YES 107 4.4 25/32HAI/7 BSI 51.415
0.0000
Mechanically ventilated - YES 46 1.9 10 PN RR
Nasogastric sonde - YES 65 2.7 13 PN RR
Urinary indwelling catheter within the previous
seven days - YES 587 24.1 7UTI
12.610 0.0004 Stay in intensive care unit >1day
Average length of stay in intensive care unit (days) ? 8.4 ± 71.380
0.0000
Surgical treatment - YES (N=2435) 629 25.8 61 (32 SSI) 18.139
0.0000 Surgical drains - YES
(n=2435) 147 23.4 18
8.204 0.0042
Endoscopic procedures - YES 50 7.9 3 (1 SSI)
ASA score (in operated patients N=629) 629 100
ASA score 1 and 2 (in operated patients N= 629) 304 48.3 21 (14 SSI) 0.43270.616 ASA score >=3 (in operated patients N= 629) 298 47,4 39 (18 SSI)
ASA score unknown (in operated patients N= 629) 27 4,3 1 (0 SSI) Wound classiication (in operated patients N= 629) 629 100
Clean 350 55.6 9 SSI
Clean/contaminated 163 25.9 10 SSI
Contaminated 77 12.2 9 SSI
Dirty 39 6.2 4 SSI
Surgical drains (in operated patients n= 629) 129 2.5 Average duration of surgery among operated N=629,
(min) 629 94.4 ±
Average length of stay in intensive care (days) for
Pseudomonas aeruginosa (10.5%). Similar results were obtained in the third national point prevalence survey.
Some diferences in results were reported regard-ing the most common isolates of HAI in European studies, where the most common isolates were E. coli
(15.2%) and Staphylococcus aureus (12.1%) (Zarb et al., 2012).
Carbapenem resistance was reported in 46.1% of
Pseudomonas aeruginosa and 52.9% of Acinetobacter
spp., which was much higher than the results of the third national prevalence survey (24.0% and 30.3%, respectively) and the results of some other studies (23.4% and 20.4%, respectively).
he percentage of methicillin-resistant S. aureus
(MRSA) and that of glycopeptide-resistant Enterococ-cus spp. was similar to results of the European point prevalence study (33% and 5.6%, respectively), but lower than results of the third national study (51% and 9%, respectively).
he overall prevalence of patients receiving an-timicrobials in our survey was high (43.8%). his is consistent with results of the third national study (43.1%). Lower-use rates were found by a multi-cent-er European study (29.6%), in Spain (33.8%), Lithua-nia (26%), Canada (36.1%), the UK and the Republic of Ireland (33.1%), in the Netherlands (30.9%) and in Sweden (34.9%) (Zarb et al., 2012; Sánchez-Payá et al., 2009; Struwe et al., 2006; Gravel et al., 2007; Humphreys et al., 2008; van der Kooi et al., 2010; Reilly et al., 2008).
he highest percentage of antibiotic consumption in Vojvodina was registered in general hospitals, both for prophylaxis and for treatment of infections. Com-pared with the results of European studies, the per-centage of antibiotic use was also the highest in gen-eral hospitals, but the percentage of use of antibiotics in relation to the type of hospital was fairly uniform from 36.2% in general hospitals to 35.7% in institutes (36.2%. 32.1% and 35.7%) (Zarb et al., 2012).
Antibiotic therapy for prophylaxis was the high-est in intensive care and surgical wards, while for therapy, the highest use was in pediatric wards and in ICUs.
he most frequently used classes of antibiotics were similar to the results of the national prevalence study and some other studies regarding the con-sumption of cephalosporins, penicillins, quinolones and imidazole derivatives. Aminoglycoside use in our hospitals was higher (12.1%) compared to the results of other studies (12.1% in ECDC and <2% in Canada). Cephalosporin use was also higher in comparison to the results of some studies (34.8% vs 17.6%) (Zarb et al., 2012; Gravel et al., 2007).
Similar to results of other studies, the most fre-quently used antibiotics for prophylaxis were ce-phalosporins of the irst and the second generation (77%), while for therapy third generation cepha-losporins dominated (67%).
CONCLUSION
he analysis of results presented herein has eluci-dated some critical points for epidemiological inter-vention. One was the high carbapenem resistance of Pseudomonas aeruginosa and Acinetobacter spp. Others were the high administration of antimicro-bials. Due to this, intervention and development of policies aiming to reduce the use of antibiotics at both local and national levels is necessary.
REFERENCES
Allegranzi, B., Nejad, S.B., Combescure, C., Graafmans, W., Attar, H., Donaldson, L. et al. (2011). Burden of endemic health-care-associated infection in developing countries: system-atic review and meta-analysis. Lancet; 377(9761):228-41.
Emmerson, A.M., Enstone, J.E., Griith, M., Kelsey, M.C. and E.T.M. Smyth (1996). he second national prevalence survey of infection in hospitals - overview of the results. J Hosp Infect.; 32:175-190.
European Centre for Disease Prevention and Control (ECDC). (2008) Annual epidemiological report on communicable diseases in Europe 2008. Stockholm: ECDC; Available from: http://ecdc.europa.eu/en/publications/Publica-tions/0812_SUR_Annual_Epidemiological_Report_2008. pdf
Freeman, J., Rosner, B.A. and J.E. McGowan (1979). Adverse ef-fects of nosocomial infection. J Infect Dis; 140:732-740.
French, G.L. and A.F.B. Cheng (1991). Measurement of the costs of hospital infection by prevalence surveys. J Hosp Infect; 18(Suppl. A):65-72.
French, G.L., Cheng, A.F.B., Wong, S.L. and S. Donnan (1989). Repeated prevalence surveys for monitoring efectiveness of hospital infection control. Lancet; 28:1021-1023.
Gastmeier, P., Gefers, C., Branndt, C., Zuschneid, I., Sohr, D., Schwab, F. et al. (2006). Efectiveness of a nationwide nosocomial infection surveillance system for reducing nosocomial infections. J Hosp Infect; 64:16-22.
Gikas, A., Pediaditis, I., Roumbelaki, M. et al. (1999). Repeated multicentre prevalence surveys of hospital-acquired infec-tion in Greek hospital. J Hosp Infect; 41:11-18.
Goossens, H. (2011). Expert-proposed European strategies to monitor and control infection. Antibiotic use and resis-tance in health-care facilities. Lancet Infect Dis.; 11 (5):338-40.
Gravel, D., Taylor, G., Ogner, M., Johnston, L., Loeb, M., Roth, V.R. et al. (2007). Point prevalence survey for healthcare-asso-ciated infections within Canadian adult-care hospitals. J Hosp Infect; 66:243-8.
Haley, R.W., Culver, D.H., White, J.W. et al. (1985). he eicacy of infection surveillance and control programs in preventing nosocomial infections in US hospitals. Am J Epidemiol; 121: 182-205.
Haley, R.W., Quade, D., Freeman, H.E. and J.V.Bennet (1980). he study of the eicacy of nosocomial infection control (SENIC) project: summary of study design. Am J Epide-miol; 111:427-85.
Humphreys, H., Newcombe, R.G., Enstone, J. et al. (2008). Four country healthcare-associated infections prevalence sur-vey 2006: Risk factor analysis.J Hosp Infect; 69: 249- 257.
Kampf, G., Gastmeier, P., Wischnewski, N. et al. (1997). Analy-sis of risk factors for nosocomial infections – results from the irst national prevalence survey in Germany (NIDEP study. part 1). J Hosp Infect; 37:103-112.
Lanini, S., Jarvis, W.R., Nicastri, E., Privitera, G., Gesu, G., Mar-chetti, F. et al. (2009). Healthcare-associated infection in Italy: Annual point-prevalence surveys. 2002-2004. Infect Control Hosp Epidemiol.; 30(7):659-65.
Lyytikainen, O., Kanerva, M., Agthe, N., Mottonen, T. andP. Ru-utu (2008). Finnish prevalence survey study group. Health care-associated infections in Finnish acute care hospitals: a national prevalence survey. 2005.J Hosp Infect; 69: 288-294.
Marković-Denić, L. (2011). Studies of prevalence in surveillance of hospital-acquired infections. Med Pregl; LXIV (7-8): 353-356.
Marković-Denić, L., Drndarević, D. and N.Milić (2000). Studija prevalencije bolničkih infekcija u Srbiji. Glas Inst Zašt Zdr Srb; 74:37-80.
Marković-Denić, L., Milić, N. and T. Knežević (2007). Druga na-cionalna studija prevalencije bolničkih infekcija. Glas Inst Javno Zdr Srb; 79:5-85.
Marković-Denić, L., Šuljagić, V., Mijović, B., Ćosić, G., Tiodorović, B., Carević B. et al. (2010). Treća nacionalna studija preva-lencije bolničkih infekcija. Ministarstvo zdravlja Repub-like Srbije.
Pittet, D., Harbarth, S., Ruef, C. et al. (1999). Prevalence and risk factors for nosocomial infections in four university hospi-tals in Switzerland. Infect Control Hosp Epidemiol; 20 :37-42.
Reilly, J., Stewart, S., Allardice, G., Cairns, S., Ritchie, L. and J. Bruce (2009). Evidence-based infection control planning based on national healthcare-associated infection preva-lence data. Infect Control Hosp Epidemiol.; 30(2):187-9.
Reilly, J., Stewart, S., Allardice, G.A., Noone, A., Robertson, C., Walker, A. and S. Coubrough (2008). Results from the Scottish national HAI prevalence survey. J Hosp Infect.; 69:62-8.
Rosenthal, V.D., Maki, D.G. and N. Graves (2008). he Interna-tional Nosocomial Infection Control Consortium (IN-ICC): Goals and objectives, description of surveillance methods, and operational activities. Am J Infec Control; 36:1-12.
Sánchez-Payá, J., Bischoberger, C., Lizan, M., Lozano, J., Muñoz Platón, E., Navarro, J. et al. (2009). Nosocomial infection surveillance and control: current situation in Spanish hos-pitals. J Hosp Infect; 72(1):50-6.
Sax, G., Hugonnet, S., Harbarth, S., Herrault, P. and D. Pittet (2001). Variation in nosocomial infection prevalence ac-cording to patient care settings: a hospital-wide survey. J Hosp Infect; 48:27-32.
Scheel, O. and M. Stormark (1998). National prevalence survey on hospital infections in Norway. J Hosp Infect; 41:331-335.
Preva-lence Survey Steering Group. Four country healthcare associated infection prevalence surveys 2006: overview of the results. J Hosp Infect.69(3):230-48. doi: 10.1016/j. jhin.2008.04.020. Epub 2008 Jun 11.
Struwe, J., Dumpis, U., Gulbinovic, J., Lagergren, Å. and U. Berg-man (2006). Healthcare associated infections in university hospitals in Latvia. Lithuania and Sweden: a simple pro-tocol for quality assessment. Euro Surveill.; 11(7):pii=640. Available from: http://www.eurosurveillance.org/ViewAr-ticle.aspx?ArticleId=640
he RAISIN Working Group. (2009 ). “RAISIN” – a national programme for early warning. investigation and surveil-lance of healthcare-associated infection in France. Euro Surveill.;14(46):pii=19408. Available from: http://www. eurosurveillance.org/ViewArticle.aspx?ArticleId=19408
van der Kooi, T.I.I., Mannien, J., Wille, J.C. and B.H. van Ben-them (2010). Prevalence of nosocomial infections in the Netherlands. 2007- 2008: results of the irst four national studies. J Hosp Infect; 75(3):168-72.
Vaque, J., Rossello, J., Arribas, J.L., EPINE Working Group. (1999). Prevalence of nosocomial infections in Spain: EPINE study 1990-1997. J Hosp Infect; 43(Suppl):S105-S111.
Weinstein, J.W., Mazon, D., Pantelick, E., Reagan-Cirincione, P., Dembry, L.M. and W.J. Hierholzer (1999). A decade of prevalence surveys in a tertiary-care center: trends in nosocomial infection rates, device utilization, and patient acuity. Infect Control Hosp Epidemiol; 20: 543-548.