Dynamic Organization of SecA and SecY
Secretion Complexes in the
B
.
subtilis
Membrane
Alex Dajkovic1*, Elizabeth Hinde2, Calum MacKichan1, Rut Carballido-Lopez1
1Micalis Institute, INRA, AgroParisTech, Université Paris-Saclay, 78350 Jouy-en-Josas, France,2School of Medical Sciences, University of New South Wales, Sydney, Australia 2052
Abstract
In prokaryotes, about one third of cellular proteins are translocated across the plasma mem-brane or inserted into it by concerted action of the cytoplasmic ATPase SecA and the uni-versally conserved SecYEG heterotrimeric polypeptide-translocating pore. Secretion complexes have been reported to localize in specific subcellular sites inBacillus subtilis. In this work, we used a combination of total internal reflection microscopy, scanning fluores-cence correlation spectroscopy, and pair correlation function to study the localization and dynamics of SecA and SecY in growingBacillus subtiliscells. Both SecA and SecY local-ized in transient and dynamic foci in the cytoplasmic membrane, which displayed no higher-level organization in helices. Foci of SecA and SecY were in constant flux with freely diffus-ing SecA and SecY molecules. Scanndiffus-ing FCS confirmed the existence of populations of cellular SecA and SecY molecules with a wide range of diffusion coefficients. Diffusion of SecY as an uncomplexed molecular species was short-lived and only local while SecY complexed with its protein partners traversed distances of over half a micrometer in the cell.
Introduction
The evolutionarily highly conserved general secretory (Sec) pathway catalyzes the translocation of proteins across or into the cytoplasmic membrane in prokaryotes and the endoplasmic retic-ulum and thylakoid membranes in eukaryotes (for a recent review see [1]). The protein translo-cating pore—the translocon—is a heterotrimeric integral membrane complex composed of one large subunit and two small subunits, termed SecY and SecE/G respectively, in prokaryotes [2,3,4,5,6,7,8].
In bacteria, the SecYEG complex associates with different ligands to catalyze client protein translocation. Nascent integral membrane proteins are delivered by the signal recognition par-ticle (SRP) to the SecYEG channel for co-translational insertion. Proteins destined to be secreted across the membrane are post-translationally translocated and assume their stable ter-tiary structure after translocation. These polypeptide substrates bind chaperones in the cyto-plasm, which prevent their folding and/or aggregation, before they are delivered to the ATPase
a11111
OPEN ACCESS
Citation:Dajkovic A, Hinde E, MacKichan C, Carballido-Lopez R (2016) Dynamic Organization of SecA and SecY Secretion Complexes in theB.
subtilisMembrane. PLoS ONE 11(6): e0157899. doi:10.1371/journal.pone.0157899
Editor:Marek Cebecauer, J. Heyrovsky Institute of Physical Chemistry, CZECH REPUBLIC
Received:March 18, 2016
Accepted:June 7, 2016
Published:June 23, 2016
Copyright:© 2016 Dajkovic et al. This is an open access article distributed under the terms of the Creative Commons Attribution License, which permits unrestricted use, distribution, and reproduction in any medium, provided the original author and source are credited.
Data Availability Statement:All relevant data are within the paper and its Supporting Information files.
Funding:This work was supported by the CEU through project PITN-GA-2008–215524 (TranSys), by
a young investigator grant from the Human Frontier Science Program Organization (HFSP-RGY0067/ 2009-C to R.C-L.), a starting grant from the European Research Council (ERC-StG 311231 to R.C-L.) and a fellowship from the Fondation pour la Recherche Médicale (grant FDT20111223619 to C. M.).
motor protein SecA. SecA is an essential peripheral membrane protein that interacts with the SecYEG pore and helps to catalyze translocation [2,3,4,5,6,7]. The low affinity binding of SecA to acidic phospholipids [9] facilitates its high affinity binding to the SecYEG complex, which together constitute the translocase. Anionic phospholipids, particularly cardiolipin, also stimu-late the self-association of SecY and the formation of a high-affinity binding surface for SecA [10,11,12].
When SecA binds to SecYEG, the high-affinity binding of SecA to the pre-protein becomes activated and the SecA-powered translocation commences [12,13]. Recentin vitrowork has shown that SecA moves polypeptides through the SecYEG channel by a“push and slide” mech-anism, i.e. by a combination of passive sliding and ATP-driven pushing, in a moderately pro-cessive manner [11]. While some molecules of SecA remain bound to the translocon during a secretion event, there is also a flux of SecA molecules in continuous dissociation and rebinding on the timescale of seconds. This association-dissociation requires the interaction of the N-ter-minal of SecA with phospholipids and is stabilized by the presence of substrate [11]. However, whether similar accumulation and flux of SecA at the translocon occursin vivois not known.
The structural and functional properties of the Sec pathway have been studied in great detail
in vitro, traditionally using bacterial proteins. However, major questions remain unresolved and only recently has the sub-cellular localization of Sec components been visualized in bacte-ria. Using GFP fusions and immunolabelling visualized by conventional epifluorescence microscopy, SecA and SecY were reported to localize in multiple clusters organized in a heli-cal-like arrangement on the cytoplasmic membrane in the rod-shaped model Gram-positive bacteriumBacillus subtilis[14]. SecG and SecE were also reported to localize in helices in
Escherichia coli[15], although SecE and SecY had been previously reported to be uniformly dis-tributed on the membrane of this organism [16]. In the ellipsoidal (ovococcus)Streptococcus pyogenes, SecA and several substrates for the Sec pathway were visualized by immunogold elec-tron microscopy and reported to localize in a single cluster near the division septum, named the“ExPortal”[17,18]. However, a subsequent study on the same organism obtained contrast-ing results by uscontrast-ing both immunogold labellcontrast-ing and immunofluorescence microscopy and showing that two different signal sequences direct secretion of proteins to two different regions of the cell [19]. More recently, SecA and SecY were reported to localize in different parts of the mid-cell region inStreptococcus pneumoniaeas a function of the cell cycle [20], arguing against the existence of an ExPortal in this organism too.
Altogether, these studies suggested that the the localization of the Sec machinery, unlike the sequence of its protein components, is not conserved. Many of them were performed by immu-nolabelling on fixed cells and none addressed the dynamics of secretion proteins in living cells. Ideally, non-intrusive labeling methods and techniques allowing real-time visualization of highly dynamic processes are necessary for understanding the dynamic process of transloca-tion of polypeptide chains across the bacterial membranein vivo.
Total internal reflection microscopy (TIRFM) is a sensitive method that provides high tem-poral resolution of membrane-associated fluorescent signals since the amplitude of the exciting evanescent wave decays with the exponent of 6 into the cytoplasm. It was recently applied to the study of cortical processes in bacterial cells [21,22]. Complementary to TIRFM, methods based on fluorescence correlation spectroscopy (FCS) also give information on the dynamics of proteinsin vivo. FCS-based methods have single molecule sensitivity and high dynamic resolu-tion, providing information about the diffusion times of fluorescent molecules, their concentra-tion, their binding to various structures, and the diffusive paths they may traverse in the cell. In particular, pair correlation methods have been recently used to characterize and quantify the diffusive paths and barriers to diffusion of fluorescent molecules in eukaryotic cells [23], but have never been applied to bacteria.
In this study we used an unprecedented combination of TIRFM, scanning FCS [24], and pair correlation function (pCF) [23,25] approaches to image the sub-cellular localization and dynamics of the essential components of the secretion machinery SecA and SecY in growingB.
subtiliscells.
Results
SecA forms dynamic foci in the membrane
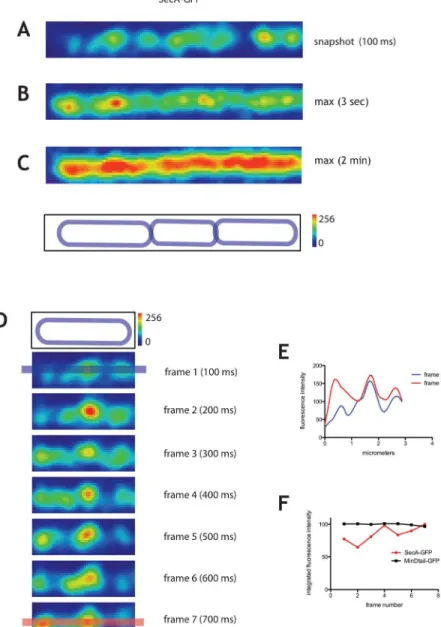
We used TIRFM to visualize the localization of a functional SecA-GFP fusion expressed from the endogenoussecApromoter, as the only copy of SecA in the cell, in exponentially growing cells ofB.subtilis. The strain carrying this construct has no defects in secretion of alpha amy-lase and proteases and its doubling time is indistinguishable from the wild-type [14]. To exam-ine the localization and dynamics of SecA-GFP, we acquired time series in streaming mode (integration time of 100 ms, over 1 to 2 min, seeS1 Video). To study the cellular organization of SecA-GFP, in addition to snapshot images of 100 ms, we generated maximum projections over characteristic timescales to determine the average structures formed by SecA-GFP in the cell.
In individual snapshot images (integration time 100 ms), SecA-GFP localized in distinct foci throughout the membrane (Fig 1A). This is consistent with the previously reported locali-zation of inducible SecA-GFP to bright clusters throughout the membrane except that no heli-cal patterns could be discerned here [14,26]. The average linear density of SecA-GFP foci was 1.8±0.3 (n = 100) focus per micrometer of cell length, indicating an average distance between foci of 0.55μm. In partial maximum projections of 3 s (Fig 1B), which correspond
approxi-mately to the timescale of translocation of one polypeptide across the membrane in reconsti-tutedin vitrosystems [27], SecA-GFP was found in hotspots more diffuse than the foci observed in the 100 ms snapshots (Fig 1B). Nevertheless, their linear density was identical, 1.8 ±0.2 (n = 100) clusters per micron of cell length. When the translocation ATPase function of SecA was inhibited by sodium azide [28] 3 s maximum projections did not produce discrete localizations of SecA-GFP, as in untreated cells, but rather a disperse signal over the whole cell (S1 Fig), indicating that the maximum projections are reporting a physiologically relevant localization. Additionally, membrane-attached GFP did not organize in foci at any timescale (see below).
In 3 s, a diffusing protein associated with the membrane would be expected to have moved an average length of ~0.5 to 1.5μm, given l*(4Dt)1/2, where D = 0.02 to 0.2μm2/s for
Cytosolic SecA molecules dynamically interact with
membrane-associated SecA foci
The fluorescence intensity of SecA-GFP foci fluctuated over consecutive 100 ms frames (Fig 1D–1F), which corresponds to the timescale of diffusion and molecular interaction. This
Fig 1. Dynamics of SecA-GFP imaged by TIRF.SecA-GFP (strain secA::pSAG2) imaged by TIRFM. Time series were taken over 2 min in streaming mode using 100 ms integration time. A typical cell is displayed with
‘physics’LUT from FIJI (see Materials and Methods).A.100 ms snapshot.B.andC.Typical 3 s(B)and 2 min (C)maximum projections showing average localization of SecA-GFP over these timescales. The outline of the cells is shown above the panels (see Materials and Methods). The intensity scale for fluorescence is shown on the right of the cell outline panel; it also serves as a scale bar of 1μm.D.Successive frames of the first cell on the left from panel A over a 700 ms time window. The top panel is the cell outline. Intensity scale for fluorescence is 1μm.E.Fluorescence intensity profiles along the line drawn over the long axis of the cell shown for frames 1 and 7, as shown in blue and red respectively in panel D.F.Integrated fluorescence intensities for the entire surface of representative cells expressing SecA-GFP (in red) and GFP stably attached to the membrane via the membrane binding tail of MinD (MinDtail-GFP, in black) (see alsoS1and
S3Figs).
doi:10.1371/journal.pone.0157899.g001
fluctuation of fluorescence intensity could be due to: (1) rapid redistribution of membrane-associated SecA-GFP molecules associating/dissociating from the foci, (2) association-dissocia-tion of cytoplasmic molecules of SecA-GFP entering and exiting the TIRF field, or (3) both.
Integrated fluorescence intensity of SecA-GFP on the entire cell surface visible in TIRF sec-tion fluctuated appreciably between consecutive 100 ms frames (Fig 1F). Such fluctuations were not detected in cells expressing GFP fused to the membrane-binding tail ofB.subtilis
MinD (MinDtail), which is composed of an amphipathic helix sufficient to stably attach
pro-teins to the membrane [30] (Fig 1F, see alsoS1andS3Figs). Furthermore, they were also not detected in cells expressing the integral membrane protein SecY fused to GFP (Fig 2F) thus suggesting that changes in axial position of fluorescent proteins in the TIRF field are not the sole origin of fluctuations. For further evidence supporting the idea that cytoplasmic molecules of SecA dynamically interact with clusters in the membrane see Table B inS1 Fileand Support-ing Information. In addition to the dynamic exchange between the membrane and cytoplasmic pools of SecA, there was also a net accumulation of SecA-GFP fluorescence in the foci over sev-eral seconds, followed by dissipation (S4 Fig).
Taken together, our results suggest that SecA forms dynamic foci in the membrane that are composed of, or associated with, large molecular complexes with which free SecA molecules dynamically interact.
SecY dynamically localizes in membrane foci
To gain further insight into the dynamics of the translocon, we next analyzed the dynamics of a GFP-SecY fusion. SecY is the largest component of the translocon, and essential for viability and translocation. Unfortunately, attempts to replace thesecYgene bygfp-secYat the native locus were unsuccessful. Thus, we used the merodiplidgfp-secYstrain used in previous studies, which contains both the wild-type, unlabeled copy of thesecYunder control of its endogenous promoter at the native locus and a xylose-inducible copy ofgfp-secYintegrated at the ectopic
amyElocus [14]. However, while high concentrations of inducer (1% xylose) were used in the previous report, here we expressedgfp-secYfrom the lowest xylose concentration allowing GFP-SecY detection in our system (0.05% xylose) to avoid overproduction artifacts. The fluo-rescence intensity under these conditions was significantly lower than for SecA-GFP (Fig 2A), but sufficient for detection with our microscope set-up. The GFP-SecY fluorescent fusion pro-tein was associated with the membrane, as evidenced by its cortical localization in cell midsec-tions imaged by epifluorescence microscopy (S5A and S5B Fig). Furthermore, it is not toxic when highly overexpressed, suggesting that it may be partially functional (data not shown and [14].
As for SecA-GFP, we acquired timelapse movies with 100 ms integration times (S2 Video) and produced maximum projections over characteristic times to examine the average struc-tures produced by GFP-SecY. In 100 ms snapshots, GFP-SecY displayed a punctate pattern on the membrane similar to SecA-GFP (Fig 2A), and consistent with the localization previously reported, with the exception that we detected no helical patterns [14,31]. Like SecA foci, SecY foci were more diffuse in 3 s maximum projections (Fig 2B), and their lifetimes varied form 3 to 18s, indicating that their localization was not fixed over time (S5C and S5D Fig). Strikingly, the average linear density of GFP-SecY foci (1.8±0.5 per micron of cell length, n = 100) was the same as the spacing measured for the SecA foci. Maximum projections of longer time series indicated that SecY foci were dynamic with no preferred localization in the membrane (Fig 2C).
Fig 2. Dynamics of GFP-SecY on the membrane.Distribution of GFP-SecY on the membrane of exponentially growingB.subtiliscells. Strain amyE::pGY1 (amyE pxyl-gfp-secY spc) was grown in LB in the presence of 0.05% xylose. Time series were taken over 1 min in streaming mode using 100 ms integration time. A typical cell is displayed with‘physics’LUT from FIJI (see Materials and Methods).A.100 ms exposure TIRF image,B.andC.maximum projection of a 3 s (B) time window and(C)1.5 min time window. The cell outlines are shown above the panels (see Materials and Methods).D.Cell outline and successive frames from a time-lapse TIRF acquisition taken in streaming mode. Intensity scale for fluorescence, 1μm.E. Fluorescence intensity profiles along the line drawn over the long axis of the cell for frames 1 and 7, as shown in blue and red respectively, panel G.F.Integrated fluorescence intensities for the entire surface of the cell for the frames shown in panel D.
doi:10.1371/journal.pone.0157899.g002
molecular assemblies with which the membrane subpopulation of SecY dynamically associates. In support of this, and in contrast to SecA, the integrated fluorescence intensity of GFP-SecY (Fig 2F) in the cell membrane remained constant except for slight photobleaching, as would be expected for membrane-associated proteins (see also Supporting Information and Table B in
S1 File). Taken together, these results indicate that GFP-SecY is found in randomly dispersed foci that dynamically assemble and disassemble in the membrane.
Scanning FCS confirms distinct populations of SecA-GFP and
GFP-SecY
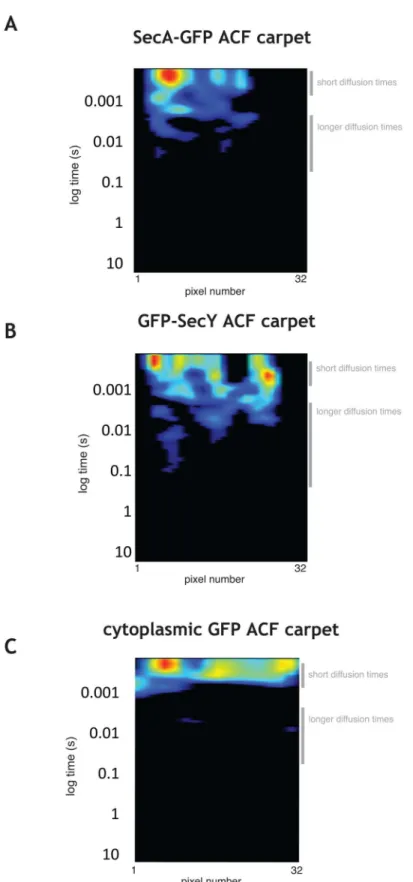
To probe the local diffusion coefficients of subpopulations of SecA-GFP and GFP-SecY in the cell, we acquired scanning FCS measurements along the long axis of cells (see Materials and Methods) and carried out autocorrelation analysis to characterize SecA-GFP and GFP-SecY dynamics. Autocorrelation function (ACF) carpets revealed a range of diffusion times for SecA-GFP and GFP-SecY and complex behavior with a pronounced presence of delayed peaks.
Fast diffusing SecA-GFP molecules as well as populations of slower SecA-GFP species (Fig 3AandS6A Fig) were present, the latter suggesting binding of SecA to other proteins (e.g. free SecYEG heterotrimers in the membrane) and/or to larger protein complexes (e.g. active trans-locases). Similarly, for GFP-SecY there were fast diffusing species (Fig 3BandS6B Fig), consis-tent with the free membrane population of translocons, i.e. SecY (47 kDa) complexed with its low molecular weight partners SecE (6 kDa) and SecG (7 kDa), or alternatively SecY diffusing alone. The presence of autocorrelation at slower times was more pronounced in the SecY ACF. This behavior is consistent with molecules engaged in repeated interactions with larger complexes, such as in cycles of association-dissociation with translocases during a transloca-tion event. They have longer apparent diffusion times since these cycles of molecular interac-tions retard their movement (see alsoDiscussion). The two distinct behaviors detected by ACF (free diffusion and repeated binding) are highlighted inS6 Fig, panels B and C. In con-trast, the ACF of untagged cytoplasmic GFP exhibited only a restricted range of fast diffusing species (Fig 3C), indicating that the observed behaviors were specific to SecA-GFP and GFP-SecY.
We fitted the autocorrelation curves of SecA-GFP and GFP-SecY to a two component diffu-sion model to extract diffudiffu-sion coefficients and the relative abundances of the slow and fast moving species (S7A Fig). The faster diffusing species of SecA-GFP had a diffusion coefficient of 1.2±0.56μm2/s, which is consistent with cytoplasmic diffusion of a SecA-GFP dimer (MW
ofB.subtilisSecA = 95 kDa). The bound population had an apparent diffusion coefficient of 0.03±0.03μm2/s, due to the cycles of association-dissociation from larger complexes. The
Fig 3. ACF analysis of SecA-GFP, GFP-SecY, and GFP. A, B,andC.Autocorrelation function (ACF) carpets for a typical exponentially growingB.subtiliscell expressing SecA-GFP(A), GFP-SecY (strain amyE::pGY1)(B), and cytoplasmic GFP(C).For all panels the amplitude of the autocorrelation function in each pixel is shown as a heat map (32 pixels, 80 nm each) plotted against a logarithmic time lag.
doi:10.1371/journal.pone.0157899.g003
pCF reveals diffusive paths of SecA and SecY in the cell
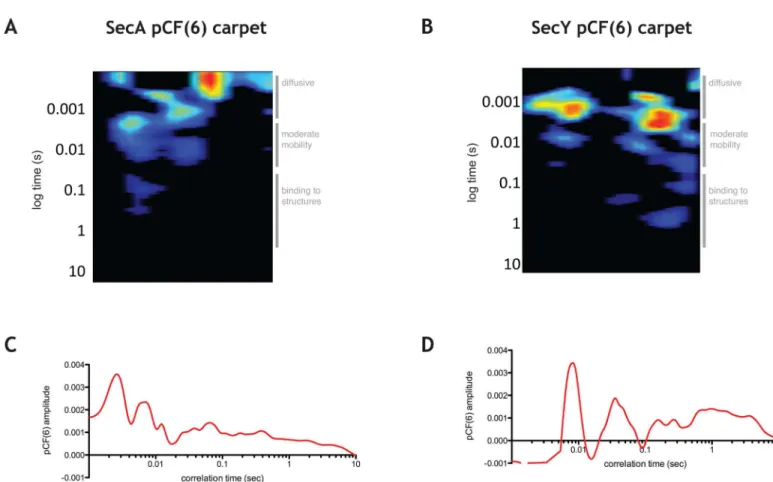
In order to characterize the diffusive paths of SecA-GFP and GFP-SecY subpopulations, we undertook pair correlation function (pCF) analysis [23,25,32]. To determine how SecA and SecY molecules traverse the distance between neighboring structures in the cell, we chose to examine pairs of points six pixels apart (pCF(6)) in a given cell, which corresponds to the average distance between SecA-GFP and GFP-SecY foci detected by TIRFM (6 pixels ~ 0.5μm). pCF(6) of
SecA-GFP showed peaks at short times, intermediate times and peaks at longer times (results from a typical cell are shown inFig 4A and 4C, for more cells seeS8A Fig). This suggests that SecA-GFP molecules traverse the average distance of ~0.5μm in the cell in different manners.
The peaks in the short time range correspond to fast diffusing population of SecA-GFP identi-fied by ACF, which is consistent with molecules traversing this distance without interacting with other proteins. The presence of peaks at intermediate times is consistent with a SecA-GFP sub-population that traverses this distance bound to protein partners and/or while associated with the membrane. Finally, the peaks and the trailing amplitude at very long times are consistent with a subpopulation of molecules of SecA-GFP that traverses this distance while being engaged in association-dissociation with structures immobile on the timescale of the experiment.
Strikingly, the freely diffusing population of GFP-SecY was nearly completely absent ~ 0.5μm away, as evidenced by the absence of significant amplitudes of pair correlation function
at short time lags (a typical cell is shown inFig 4B and 4D, for more examples seeS8B Fig),
Fig 4. pCF analysis of SecA-GFP and GFP-SecY. A.pCF(6) for a typical cell expressing SecA-GFP with the times characteristic for various diffusive species shown on the right of the graph.B.pCF(6) for a typical cell expressing GFP-SecY with the times characteristic for various diffusive species shown on the right of the graph.C.Average pCF(6) for panel A.D.Average pCF(6) for panel B.
indicating that the diffusion of free SecY molecules on the membrane detected by ACF is only local. This suggests that SecY and/or SecYEG may become only transiently released from larger structures and protein partners before being recaptured. The peaks of correlation of pCF(6) at intermediate times suggested that SecY traverses this distance while in complex with other pro-teins, while the peaks at long times indicate its interaction with structures that do not move on this timescale.
For both SecA and SecY, the pCF(2) was qualitatively equivalent to ACF (S8C and S8D Fig), as expected, given that the analysis is done within a single point spread function of the micro-scope. On the other hand, pCF(14) detected very few molecules either because they didn’t move to this location or more likely because they left the plane of the linescan during acquisi-tion (S8C and S8D Fig).
Taken together, these data suggest that, on average, the transition of SecY molecules between neighboring translocases occurs only when SecYEG is complexed with other proteins, but not alone.
Discussion
In this work, we have used cutting edge imaging techniques to examine the localization and dynamics of the two core components of the Sec machinery, SecA and SecY, in growing Bacil-lus subtiliscells. Our results reveal a remarkably dynamic secretion system in constant reorga-nization in the cell. Both SecA and SecY form clusters throughout the cytoplasmic membrane with an average linear spacing of 0.55 micrometers. Such clusters are consistent with the previ-ously reported spatial organization of SecA, SecY and the secretory protein pre-AmyQ in dis-crete sites in the membrane ofB.subtiliscells, and were proposed to be sites of protein export (i.e. translocases) [14]. In contrast, we found no evidence that translocases are distributed along spiral-like structures running the length of the cell, as previously suggested by Campo and colleagues. On the timescale of one or two minutes both SecA and SecY visit with appar-ently equal probability the entire surface of the cell, indicating that secretion complexes display no high-order organization and/or directed motion along helical structures in the membrane. This also indicates that translocases are highly dynamic, and thus not attached to large struc-tures, such as the cell wall.
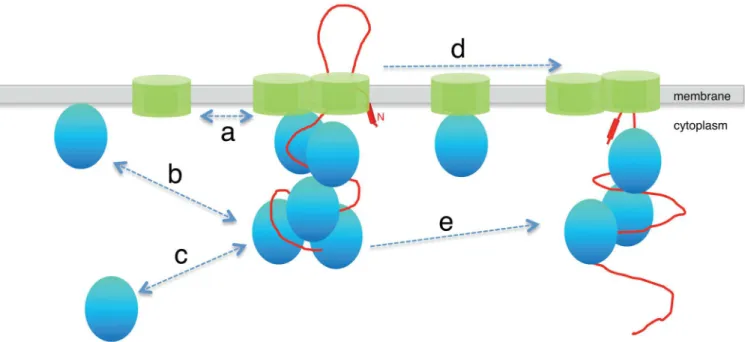
Secretion of polypeptides is believed to occur in the timescale of several seconds [27]. While membrane-associated GFP freely diffused and displayed a homogeneous localization in the cell over 3 s, SecA and SecY still localized in discrete clusters, further supporting the idea that these may correspond to translocases. Interestingly, a diffuse fluorescence signal was specifically detected around the clusters in this timescale (3 s maximum projections). Species of SecA and SecY with diffusion coefficients consistent with freely diffusing proteins were however detected in our scanning FCS analysis. If they were indeed freely diffusing throughout the membrane, these species would display a homogeneous fluorescence signal over the entire TIRF section over 3 s, like membrane-associated GFP does. The concentration of SecA and SecY molecules around the clusters suggests that both membrane-associated SecA and SecY repeatedly and transiently interact with the translocase complexes (‘a’and‘b’inFig 5). This is consistent with the sFCS analysis which shows molecular species of SecA and SecY whose diffusion times are compatible with binding to protein partners as well as to very slowly moving or largely immo-bile structures (on the timescale of the experiment).
The pair correlation function (pCF) approach complements sFCS by quantifying average times that molecular species take to traverse a specified distance in the cell. We chose the dis-tance of approximately two point spread functions for our pCF analysis, which corresponds to the average distance between the membrane foci of SecA and SecY (~0.55μm). Our pCF
analysis shows that SecA traverses this distance (i) as a freely diffusing species, (ii) complexed with protein partners, most likely SecY (arrow d inFig 5), and (iii) while being engaged in binding interactions with larger structures. These structures are consistent with the foci, pre-sumably translocases, that do not diffuse away on this timescale in our TIRF analysis. Because the pCF analysis detects individual molecules, this indicates that the same molecule of SecA interacts with multiple translocases in the cell. A recentin vitrostudy showed that there was a flux of SecA molecules on translocases [11], but couldn’t address the question of whether the same molecule of SecA engages with a given translocase multiple times or whether it interacts with multiple translocons. Our pCF analysis and TIRF imaging provide evidence that,in vivo, this flux of SecA molecules involves not only the participation of multiple SecA molecules in a single translocase, but that after dissociating from one translocase SecA molecules seem to engage with neighboring translocases without spending much time freely diffusing.
Surprisingly, pCF analysis of GFP-SecY indicated that freely diffusive SecY single molecules on average do not traverse the distance between two SecY clusters (0.5μm), indicating that
they only have a local existence on the membrane. Thus, free SecY is a transient species that quickly complexes with other protein partners on the cytoplasmic membrane. Because the Kd
of SecA—SecY interaction is in the nanomolar range (~ 4 nM) [2] and the concentration of SecA in the cell in the micromolar range [33], it is likely that SecY subunits become rapidly complexed with SecA molecules. Assuming a diffusion-limited on-rate for such an interaction of ~ 2106M-1s-1[34], the off rate would be expected to be only k
off~ 610−3s-1, indicating a
very slowly dissociating complex. Consistently, high molecular weight species with diffusion times consistent with SecYEG-SecA complexes were detected by pCF 0.5μm apart for both
SecA and SecY (‘d’inFig 5).
Fig 5. Model of the secretory machinery.The SecYEG translocon (in green) is comprised SecYEG molecules which are engaged in cycles of association and dissociation with the SecY molecules on the membrane (a). SecA (shown in blue) delivers the pre-protein (shown in red) destined for export across the membrane to the translocon, where multiple molecules of SecA associate and accumulate during translocation. This association is dynamic because molecules of SecA exchange with the surrounding free molecules on the membrane (b) and in the cytoplasm (c). The SecYEG heterotrimer moves between neighboring translocons only when complexed with other proteins, such as SecA (d). A single SecA molecule can sequentially engage with neighboring SecYEG complexes (e).
To conclude, this work draws a very dynamic picture of secretion complexes on various timescales in liveB.subtiliscells. While the mechanistic properties of the Sec system have been largely studiedin vitro, we provide insight of the Sec system in live cells for the first time. Our work shows that TIRF microscopy coupled with methods based on fluorescence autocorrela-tion spectroscopy are powerful tools to address cell biological quesautocorrela-tions related to membrane-associated processes not only in eukaryotic systems but also in bacterial cells. It is now possible to use these methods to study association and dissociation constants of proteinsin vivo, to obtain a quantitative picture of cellular processes that has so far only beenpossible in vitro.
Experimental Procedures
Strains and growth conditions
Bacillus subtilis strains used in this study are listed in Table A inS1 File. Cells were grown in Luria-Bertani (LB) medium supplemented with the appropriate antibiotics, when required, at the following concentrations: chloramphenicol, 5μg/mL; spectinomycin, 100μg/mL. Cells
from frozen stocks were subcultured in small volumes of medium and grown over night. The following day the cells were diluted 5000 fold and grown for several hours until they attained exponential phase. Cells for microscopy were taken at OD600~ 0.3–0.4. 0.05% xylose was used
for induction of GFP-SecY.
Cloning and strain construction
We used standard procedures for restriction digestion, ligation, agarose gel electrophoresis, and transformation of competent E. coli cells. Chromosomal DNA ofB.subtiliswas isolated with the Wizard Genomic DNA Purification Kit (Promega), using the manufacturers instruc-tions. Plasmid DNA from E. coli was isolated using the QIAprep Spin Miniprep Kit (Qiagen), using the manufacturers instructions. Phusion (NEB) DNA polymerase was used for cloning and ExTaq DNA polymerase (Takara) for screening for correct constructs.
In order to create an inducible GFP fusion of the membrane-binding tail of MinD, the cod-ing sequence of the C-terminal fragment ofminDwas PCR-amplified fromB.subtilis168 chro-mosomal DNA using primers minD22fwd
(CTGTTCTCGAGCAGGTGCTTGAAGAGCAAAACAAAGGAATG), minD22rev (CTATCAAGCTT AGATCTTACTCCGAAAAATGACTTAATCTTAGCC), carrying the XhoI and HindIII restriction
sites. The resulting PCR products were purified, digested and ligated to XhoI–HindIII cleaved pSG1154 vector. This resulted in the plasmid pMIND22. The plasmids were isolated and used to transformB.subtilis168 and clones were selected on LB agar plates containing spectinomy-cin. The resulting strains were tested on plates with 1% starch to confirm integration at the amyE locus, restreaked to purify and stored at -80°C.
TIRF microscopy and image processing
For microscopic observations, 2–3μL of cells from exponentially growing cultures (OD ~0.3–
0.4) were placed on a thin pad of 1% agarose poured in frames glued on microscope slides (Gene Frame from Thermo Scientific) and imaged by an inverted Nikon microscope (Ti-E) with a diode pumped solid-state laser (Cobold Calypso, 50 mW, 491 nm) and an Apo TIRF 100x oil objective (Nikon) with a numerical aperture of NA = 1.49. Images and time-lapse movies were collected with an electron-multiplying charge-coupled device (EMCCD) camera (iXon3 DU-897, Andor) with a gain set at 300. The microscope and the laser were controlled by the Nikon NIS-Elements software. Incidence angles of the laser beam were adjusted to obtain either TIRF or epifluorescence illumination, as indicated in the text.
All images and time-lapse movies were analyzed using ImageJ. To obtain the cell outlines shown in the figures, maximum projection images were produced from time-lapse movies whereupon the maximum projections were thresholded to obtain the cell outlines. To measure the total fluorescence intensities of the membranes visible in the TIRF field, a region of interest (ROI) was created from a cell outline. Fluorescence intensities were thereupon measured for each frame of a movie in this ROI. Fluorescence intensities reported in the figures are normal-ized to 100. To measure the fluorescence intensities of the foci, we used the function‘find max-ima’of ImageJ (output type: point selection) to identify the foci. We then measured the fluorescence intensities associated with the foci and calculated the reported distributions. All images shown in the figures were processed as follows: background was subtracted with a roll-ing ball radius of 50 pixels, the images were filtered usroll-ing a Gaussian filter with a sigma of 1 pixel. All images are presented with‘physics’lookup table, done in ImageJ.
Acquisition of line-scan data
The microscopy measurements were performed on a Zeiss LSM710 Quasar laser scanning microscope, using a 40X water immersion objective 1.2 N.A. (Zeiss, Germany). GFP was excited with the 488 nm emission line of an Argon laser. GFP was measured using the 510–560 nm emission range and the pinhole was set to 1 Airy Unit. A detailed description of the experi-mental settings used for the line-scan measurement is present in previous publications [23,25]. Briefly, we acquire data by rapidly scanning a diffraction-limited laser beam (488 nm) along a 32 pixel long line drawn across the long axis of a cell (as shown diagrammatically in figures) expressing SecA-GFP or SecY-GFP. The zoom was set so that 1 pixel = 80 nm. The scanning speed used for these settings was selected (pixel dwell time 10.18μs, line time 0.763 ms) so that
the GFP molecules could be correlated in time between lines. In general for each experiment, 2x10⁵consecutive lines (with no intervals between lines) were acquired. Time regions within each experiment with no average change in fluorescence intensity (e.g. photo-bleaching) were then selected for the correlation analysis.
Autocorrelation and pair correlation analysis of line-scan data
Calculation of the auto and pair correlation functions as well as the waist of the point spread function was done using the SimFCS software developed at the Laboratory for Fluorescence Dynamics (www.lfd.uci.edu), as previously described [23,25]. Intensity data are presented by using a carpet representation in which the x-coordinate corresponds to the point along the line (pixels) and the y-coordinate corresponds to the time of acquisition. The autocorrelation func-tion (ACF) and the pair correlafunc-tion funcfunc-tions (pCF(pixels)) are displayed in pseudo colors in an image in which the x-coordinate corresponds to the point along the line and the y-coordi-nate corresponds to the autocorrelation time in a log scale. The pCF analysis was carried out at a distance of 5–6 pixels (which corresponds to 500–600 nm).
Supporting Information
S1 Fig. Distribution of SecA-GFP foci in three successive 3 second partial maximum pro-jections after treatment with sodium azide.Maximum projections of successive 3 s segments of a time-lapse TIRF acquisition taken in streaming mode with 100 ms integration time; cell outlines are represented in the top panel. A typical cell is shown with‘physics’LUT from FIJI (see Materials and Methods).
S2 Fig. Distribution of SecA-GFP foci in successive 3 second partial maximum projections. A.Maximum projections of successive 3 s segments of a time-lapse TIRF acquisition taken in streaming mode with 100 ms integration time (a-h); cell outlines are represented in the top panel. A typical cell is shown with‘physics’LUT from FIJI (see Materials and Methods). The intensity scale for fluorescence is shown on the right of the cell outline panel; it also serves as a scale bar of 1μm.B.Fluorescence intensity profiles along the line drawn over the long axis of
the cell shown for framesaandh, as shown in blue and red respectively in panel A. (EPS)
S3 Fig. Dynamics of membrane associated GFP. A.Frames from a time-lapse TIRF acquisi-tion of MinDtail-GFP expressed from strain RCL237 (amyE::spc Pxyl-gfp-minDtail) taken in streaming mode with the integration time of 100 ms; top panel represents the cell outline (see Materials and Methods). A typical cell is shown with‘physics’LUT from FIJI (see Materials and Methods). Intensity scale for fluorescence is 1μm.B.Maximum projection of a 1 min
time-lapse TIRF acquisition of MinDtail-GFP.C.Fluorescence intensity profiles over the long axis of cell for frames displayed in panel A.D.Integrated fluorescence intensities for the entire surface of the cell visible in the TIRF field from panel B.
(EPS)
S4 Fig. Dynamics of SecA association/dissociation from membrane hotspots. A.Typical maximum projection of SecA-GFP (B.subtilisstrain secA::pSAG2) from a 3 s segment of a 25 s time-lapse TIRF acquisition.B.Evolution of fluorescence intensity as a function of time for the region of interest (ROI) around the hotspot shown in panel A by the white square.C. Repre-sentative frames were extracted every 0.3 s from the time series to visualize how accumulation/ dissipation of SecA-GFP in the hotspot occurs over the timescale of seconds. Images are dis-played with‘physics’LUT from FIJI (see Materials and Methods).
(EPS)
S5 Fig. Membrane localization of GFP-SecY in epifluorescence mode and the distribution of foci in successive 3 second TIRF partial maximum projections. A.Epifluorescence image of a mid-section of a cell expressing GFP-SecY (same experimental conditions as in Figs2,3
and4).B.Quantification of fluorescence intensity along the green line shown in panel A.C.
Maximum projections of successive 3 s segments of a 30 s time-lapse TIRF acquisition of expo-nentially growing cells expressing GFP-SecY, taken in streaming mode with integration time of 100 ms. The top panel are cell outlines (see Materials and Methods). A typical cell is shown with‘physics’LUT from FIJI (see Materials and Methods). The intensity scale for fluorescence is shown on the right of the cell outline panel; it serves also as a scale bar of 1μm.D.
Fluores-cence intensity profiles along the line drawn over the long axis of the cell shown for framesa
andj, as shown in blue and red respectively in panel C. (EPS)
S6 Fig. ACF analysis of SecA-GFP and GFP-SecY. A and B.ACF carpets of three exponen-tially growingB.subtiliscell expressing SecA-GFP(A)and GFP-SecY(B); the amplitudes of the autocorrelation functions in each pixel are shown as a heat map. Experimental conditions identical to those in Figs2,3and4.C.Autocorrelation functions for the pixels indicated by the yellow and red arrows in panel B. The typical diffusion times for free diffusion and the bound subpopulation of molecules are indicated.
(EPS)
S7 Fig. ACF fits for cells expressing SecA-GFP and GFP-SecY. A and B.Autocorrelation function plot averaged for six cells expressing SecA-GFP (A) and GFP-SecY (B) with the fitted
curve shown in green. Experimental conditions were as inFig 3. (EPS)
S8 Fig. pCF analysis of SecA-GFP and GFP-SecY. A and B.pCF(6) analysis for three expo-nentially growingB.subtiliscells expressing SecA-GFP (A) and GFP-SecY (B). Experimental conditions were as inFig 3.C.andD.Comparison of ACF, pCF(2), pCF(6), and pCF(14) for SecA (C), and SecY (D).
(EPS)
S1 File. Supporting Information.Supplementary tables, results and references. (DOC)
S1 Video. Movie showing dynamics of SecA-GFP.TIRFM acquisition with 100 ms integra-tion time. The AVI file was created with 10 FPS setting.
(AVI)
S2 Video. Movie showing dynamics of GFP-SecY.TIRFM acquisition with 100 ms integra-tion time. The AVI file was created with 10 FPS setting.
(AVI)
Acknowledgments
The authors thank the MIMA2 imaging facility for the use of their confocal microscope and Pierre Adenot and Renaud Fleurot for technical help. Arnaud Chastanet, Cyrillle Billaudau, and Benoit Tesson are thanked for their critical reading of the manuscript. This work was sup-ported by the CEU through project PITN-GA-2008–215524 (TranSys), by a young investigator grant from the Human Frontier Science Program Organization (HFSP-RGY0067/2009-C to R. C-L.), a starting grant from the European Research Council (ERC-StG 311231 to R.C-L.) and a fellowship from the Fondation pour la Recherche Médicale (grant FDT20111223619 to C. M.)
Author Contributions
Conceived and designed the experiments: AD EH. Performed the experiments: AD EH CM. Analyzed the data: AD EH. Contributed reagents/materials/analysis tools: AD EH. Wrote the paper: AD EH RCL.
References
1. Beckwith J (2013) The Sec-dependent pathway. Res Microbiol 164: 497–504. doi:10.1016/j.resmic. 2013.03.007PMID:23538404
2. Kedrov A, Kusters I, Driessen AJ (2013) Single-molecule studies of bacterial protein translocation. Bio-chemistry 52: 6740–6754. doi:10.1021/bi400913xPMID:24024480
3. Lycklama ANJA, Driessen AJ (2012) The bacterial Sec-translocase: structure and mechanism. Philos Trans R Soc Lond B Biol Sci 367: 1016–1028. doi:10.1098/rstb.2011.0201PMID:22411975
4. Driessen AJ, Nouwen N (2008) Protein translocation across the bacterial cytoplasmic membrane. Annu Rev Biochem 77: 643–667. PMID:18078384
5. Driessen AJ, Manting EH, van der Does C (2001) The structural basis of protein targeting and translo-cation in bacteria. Nat Struct Biol 8: 492–498. PMID:11373615
6. Rapoport TA (2008) Protein transport across the endoplasmic reticulum membrane. FEBS J 275: 4471–4478. doi:10.1111/j.1742-4658.2008.06588.xPMID:18671729
7. Rapoport TA (2007) Protein translocation across the eukaryotic endoplasmic reticulum and bacterial plasma membranes. Nature 450: 663–669. PMID:18046402
9. Hendrick JP, Wickner W (1991) SecA protein needs both acidic phospholipids and SecY/E protein for functional high-affinity binding to the Escherichia coli plasma membrane. J Biol Chem 266: 24596–
24600. PMID:1837025
10. Gold VA, Robson A, Bao H, Romantsov T, Duong F, Collinson I. (2010) The action of cardiolipin on the bacterial translocon. Proc Natl Acad Sci U S A 107: 10044–10049. doi:10.1073/pnas.0914680107
PMID:20479269
11. Bauer BW, Shemesh T, Chen Y, Rapoport TA (2014) A "Push and Slide" Mechanism Allows
Sequence-Insensitive Translocation of Secretory Proteins by the SecA ATPase. Cell 157: 1416–1429. doi:10.1016/j.cell.2014.03.063PMID:24906156
12. Hartl FU, Lecker S, Schiebel E, Hendrick JP, Wickner W (1990) The binding cascade of SecB to SecA to SecY/E mediates preprotein targeting to the E. coli plasma membrane. Cell 63: 269–279. PMID:
2170023
13. Fekkes P, de Wit JG, van der Wolk JP, Kimsey HH, Kumamoto CA, Driessen AJ. (1998) Preprotein transfer to the Escherichia coli translocase requires the co-operative binding of SecB and the signal sequence to SecA. Mol Microbiol 29: 1179–1190. PMID:9767586
14. Campo N, Tjalsma H, Buist G, Stepniak D, Meijer M, Veenhuis M, et al. (2004) Subcellular sites for bac-terial protein export. Mol Microbiol 53: 1583–1599. PMID:15341641
15. Shiomi D, Yoshimoto M, Homma M, Kawagishi I (2006) Helical distribution of the bacterial chemorecep-tor via colocalization with the Sec protein translocation machinery. Mol Microbiol 60: 894–906. PMID:
16677301
16. Brandon LD, Goehring N, Janakiraman A, Yan AW, Wu T, Beckwith J, et al. (2003) IcsA, a polarly local-ized autotransporter with an atypical signal peptide, uses the Sec apparatus for secretion, although the Sec apparatus is circumferentially distributed. Mol Microbiol 50: 45–60. PMID:14507362
17. Rosch J, Caparon M (2004) A microdomain for protein secretion in Gram-positive bacteria. Science 304: 1513–1515. PMID:15178803
18. Rosch JW, Caparon MG (2005) The ExPortal: an organelle dedicated to the biogenesis of secreted pro-teins in Streptococcus pyogenes. Mol Microbiol 58: 959–968. PMID:16262783
19. Carlsson F, Stalhammar-Carlemalm M, Flardh K, Sandin C, Carlemalm E, Lindahl G. (2006) Signal sequence directs localized secretion of bacterial surface proteins. Nature 442: 943–946. PMID:
16929299
20. Tsui HC, Keen SK, Sham LT, Wayne KJ, Winkler ME (2011) Dynamic distribution of the SecA and SecY translocase subunits and septal localization of the HtrA surface chaperone/protease during Streptococcus pneumoniae D39 cell division. MBio 2.
21. Gregory JA, Becker EC, Pogliano K (2008) Bacillus subtilis MinC destabilizes FtsZ-rings at new cell poles and contributes to the timing of cell division. Genes Dev 22: 3475–3488. doi:10.1101/gad. 1732408PMID:19141479
22. Dominguez-Escobar J, Chastanet A, Crevenna AH, Fromion V, Wedlich-Soldner R, Carballido-Lopez R. (2011) Processive movement of MreB-associated cell wall biosynthetic complexes in bacteria. Sci-ence 333: 225–228. doi:10.1126/science.1203466PMID:21636744
23. Hinde E, Cardarelli F, Digman MA, Gratton E (2010) In vivo pair correlation analysis of EGFP intranuc-lear diffusion reveals DNA-dependent molecular flow. Proceedings of the National Academy of Sci-ences of the United States of America 107: 16560–16565. doi:10.1073/pnas.1006731107PMID:
20823232
24. Petrasek Z, Ries J, Schwille P (2010) Scanning FCS for the characterization of protein dynamics in live cells. Methods Enzymol 472: 317–343. doi:10.1016/S0076-6879(10)72005-XPMID:20580970
25. Digman MA, Gratton E (2009) Imaging barriers to diffusion by pair correlation functions. Biophysical journal 97: 665–673. doi:10.1016/j.bpj.2009.04.048PMID:19619481
26. Carballido-Lopez R, Formstone A, Li Y, Ehrlich SD, Noirot P, Errington J. (2006) Actin homolog MreBH governs cell morphogenesis by localization of the cell wall hydrolase LytE. Developmental cell 11: 399–409. PMID:16950129
27. Liang FC, Bageshwar UK, Musser SM (2009) Bacterial Sec protein transport is rate-limited by precursor length: a single turnover study. Mol Biol Cell 20: 4256–4266. doi:10.1091/mbc.E09-01-0075PMID:
19656854
28. Oliver DB, Cabelli RJ, Dolan KM, Jarosik GP (1990) Azide-resistant mutants of Escherichia coli alter the SecA protein, an azide-sensitive component of the protein export machinery. Proc Natl Acad Sci U S A 87: 8227–8231. PMID:2146683
29. Kumar M, Mommer MS, Sourjik V (2010) Mobility of cytoplasmic, membrane, and DNA-binding proteins in Escherichia coli. Biophys J 98: 552–559. doi:10.1016/j.bpj.2009.11.002PMID:20159151
30. Szeto TH, Rowland SL, Habrukowich CL, King GF (2003) The MinD membrane targeting sequence is a transplantable lipid-binding helix. J Biol Chem 278: 40050–40056. PMID:12882967
31. Carballido-Lopez R, Formstone A, Li Y, Ehrlich SD, Noirot P, Errington J. (2006) Actin homolog MreBH governs cell morphogenesis by localization of the cell wall hydrolase LytE. Dev Cell 11: 399–409. PMID:16950129
32. Hinde E, Cardarelli F, Digman MA, Kershner A, Kimble J, Gratton E. (2011) The impact of mitotic versus interphase chromatin architecture on the molecular flow of EGFP by pair correlation analysis. Biophysi-cal journal 100: 1829–1836. doi:10.1016/j.bpj.2011.02.024PMID:21463597
33. Or E, Navon A, Rapoport T (2002) Dissociation of the dimeric SecA ATPase during protein transloca-tion across the bacterial membrane. EMBO J 21: 4470–4479. PMID:12198149