BGD
9, 13319–13349, 2012
Ocean acidification impacts on bacterial community structure
A.-S. Roy et al.
Title Page
Abstract Introduction
Conclusions References
Tables Figures
◭ ◮
◭ ◮
Back Close
Full Screen / Esc
Printer-friendly Version Interactive Discussion
Discussion
P
a
per
|
Dis
cussion
P
a
per
|
Discussion
P
a
per
|
Discussio
n
P
a
per
|
Biogeosciences Discuss., 9, 13319–13349, 2012 www.biogeosciences-discuss.net/9/13319/2012/ doi:10.5194/bgd-9-13319-2012
© Author(s) 2012. CC Attribution 3.0 License.
Biogeosciences Discussions
This discussion paper is/has been under review for the journal Biogeosciences (BG). Please refer to the corresponding final paper in BG if available.
Ocean acidification shows negligible
impacts on high-latitude bacterial
community structure in coastal pelagic
mesocosms
A.-S. Roy1, S. M. Gibbons2,3, H. Schunck1, S. Owens2,8, J. G. Caporaso2,4, M. Sperling1,9, J. I. Nissimov5, S. Romac6, L. Bittner6, U. Riebesell1, J. LaRoche1,*, and J. A. Gilbert2,7
1
GEOMAR Helmholtz Center for Ocean research Kiel, D ¨usternbrooker Weg 20, 24105, Kiel, Germany
2
Argonne National Laboratory, Institute for Genomic and Systems Biology, 9700, S. Cass Ave. Lemont, IL 60439, USA
3
Graduate Program in Biophysical Sciences, University of Chicago, Chicago, IL 60637, USA
4
Department of Computer Science, Northern Arizona University, Flagstaff, AZ 86001, USA
5
Plymouth Marine Laboratory, Prospect Place, Plymouth, Devon, PL1 3DH, UK
6
CNRS, UMR 7144 – Universit ´e Pierre et Marie Curie, Station Biologique de Roscoff, Place Georges Teissier, 29682, Roscoff, France
7
BGD
9, 13319–13349, 2012
Ocean acidification impacts on bacterial community structure
A.-S. Roy et al.
Title Page
Abstract Introduction
Conclusions References
Tables Figures
◭ ◮
◭ ◮
Back Close
Full Screen / Esc
Printer-friendly Version Interactive Discussion
Discussion
P
a
per
|
Dis
cussion
P
a
per
|
Discussion
P
a
per
|
Discussio
n
P
a
per
|
8
Computation Institute, University of Chicago, 5640 South Ellis Avenue, Chicago, IL 60637, USA
9
Alfred-Wegener-Institute, Am Handelshafen 12, 27570, Bremerhaven, Germany
*
now at: Department of Biology, Dahousie University, Halifax, NS, Canada
Received: 31 August 2012 – Accepted: 9 September 2012 – Published: 26 September 2012 Correspondence to: A.-S. Roy ([email protected]) and
J. LaRoche ([email protected])
BGD
9, 13319–13349, 2012
Ocean acidification impacts on bacterial community structure
A.-S. Roy et al.
Title Page
Abstract Introduction
Conclusions References
Tables Figures
◭ ◮
◭ ◮
Back Close
Full Screen / Esc
Printer-friendly Version Interactive Discussion
Discussion
P
a
per
|
Dis
cussion
P
a
per
|
Discussion
P
a
per
|
Discussio
n
P
a
per
|
Abstract
The impact of ocean acidification and carbonation on microbial community structure was assessed during a large-scale in situ costal pelagic mesocosm study, included as part of the EPOCA 2010 Arctic campaign. The mesocosm experiment included ambient conditions (fjord) and nine mesocosms, withpCO2 range from ∼145 to ∼1420 µatm. 5
Samples collected at nine time points (t-1, t1, t5, t7, t12, t14, t22, t26 to t28) in seven treatments (ambient fjord (∼145), 2× ∼185, ∼270, ∼685, ∼820, ∼1050 µatm) were
analysed for “free-living” and “particle associated” microbial community composition using 16S rRNA amplicon sequencing. This high-throughput sequencing analysis pro-duced∼20 000 000 16S rRNA V4 reads, which comprised 7000 OTUs. The main
vari-10
ables structuring these communities were, sample origin (fjord or mesocosms) and the filter size fraction (free-living or particle associated). The community was significantly different between the fjord and both the control and elevated CO2 mesocosms (which were not significant different) after nutrients were added to the mesocosms; suggesting that the addition of nutrients is the primary driver of the change in mesocosm commu-15
nity structure. The relative importance of each structuring variable depended greatly on the time at which the community was sampled in relation to the phytoplankton bloom. The size fraction was the second most important factor for community structure; separating free-living from associated bacteria. When free-living and particle-associated bacteria were analysed separately at different time points, the only taxon 20
pCO2 was found to significantly affect were the Gammaproteobacteria after nutrient addition. Finally,pCO2 treatment was found to be significantly correlated (non-linear) with 15 rare taxa, most of which increased in abundance with higher CO2.
1 Introduction
The acidification of our oceans, caused predominantly by dissolution of anthropogenic 25
BGD
9, 13319–13349, 2012
Ocean acidification impacts on bacterial community structure
A.-S. Roy et al.
Title Page
Abstract Introduction
Conclusions References
Tables Figures
◭ ◮
◭ ◮
Back Close
Full Screen / Esc
Printer-friendly Version Interactive Discussion
Discussion
P
a
per
|
Dis
cussion
P
a
per
|
Discussion
P
a
per
|
Discussio
n
P
a
per
|
microbes. Therefore, because marine microbes play a major role in global ical cycles, this increase may have unforeseen consequences on ocean biogeochem-istry (Falkowski et al., 2008; Worden and Not, 2008). Experimental manipulation of the partial pressure of carbon dioxide (pCO2) in marine mesocosms has demonstrated species-specific physiological responses to elevated dissolved CO2 concentrations, 5
for example, delayed or decreased Coccolithophore calcification (Delille et al., 2005), a significant increase in photosynthetic capacity (Fu et al., 2008), higher CO2 and N2 fixation (Hutchins et al., 2007), and a decreased abundance of picoeukaryotes (New-bold et al., 2012). However, the response of bacterial communities to elevatedpCO2 concentrations is less defined, with mixed reports of both significant increases in bac-10
terial protein production (Grossart et al., 2006), and no significant changes in microbial community structure (Tanaka et al., 2008; Allgaier et al., 2008; Newbold et al., 2012). For example, during the 2008 PeECE III mesocosms study, elevatedpCO2had no sig-nificant impact on bacterial abundance, diversity, or activity; however, the community structure of free-living bacteria was significantly altered by the induced phytoplankton 15
bloom (Allgaier et al., 2008; Arnosti et al., 2011; Riebesell et al., 2008).
While these existing studies have observed little impact of elevated pCO2 on mi-crobial community structure, they were all performed with molecular techniques that offered limited taxonomic resolution (e.g. high-performance liquid chromatography, de-naturing gradient gel electrophoresis, terminal restriction fragment length polymor-20
phism). To improve that resolution, this study employed high-throughput amplicon se-quencing of 16S rRNA to characterize microbial taxonomic community dynamics. High-throughput amplicon sequencing provides an efficient method to obtain a deep molec-ular overview of microbial community structure, without having to cultivate environ-mental isolates (Agogu ´e et al., 2011; Gilbert et al., 2009; Hubert et al., 2007; Huse 25
BGD
9, 13319–13349, 2012
Ocean acidification impacts on bacterial community structure
A.-S. Roy et al.
Title Page
Abstract Introduction
Conclusions References
Tables Figures
◭ ◮
◭ ◮
Back Close
Full Screen / Esc
Printer-friendly Version Interactive Discussion
Discussion
P
a
per
|
Dis
cussion
P
a
per
|
Discussion
P
a
per
|
Discussio
n
P
a
per
|
elevatedpCO2, the analysis of the 16S rRNA database provided insight on the effect of isolating the water column in a mesocosm, adding nutrients to the mesocosms to produce a phytoplankton bloom, and to investigate the community structure response to elevatedpCO2.
2 Methods
5
2.1 Location and carbonate system manipulation
The European Project on Ocean Acidification (EPOCA) supported a large mesocosm experiment in the Arctic which was conducted in the water of Kongsfjorden, Svalbard, Norway (78◦56.2′N; 11◦53.6′E) during the months of June and July 2010. Through-out the experiment diverse environmental parameters were measured to explore the 10
effect of ocean acidification (OA) on multiple biological processes. Briefly, nine meso-cosms containing about 45 m3of sea water and reaching down to 15 m depth were de-ployed from the settlement Ny- ˚Alesund andpCO2was manipulated by addition of CO2 -saturated seawater in seven mesocosms; resulting in a initialpCO2 range from∼185
to∼1420 µatm. The two un-manipulated mesocosms were used as controls and had
15
a startingpCO2 of∼185 µatm. Additionally, samples were taken directly from the fjord (initialpCO2∼145 µatm) in which the mesocosms were suspended and from which the
mesocosm water originated. These samples were to monitor any natural changes in pCO2 that may occur in the ambient water during the course of the experiment and were also important to detect deviations inpCO2between the fjord and the untreated 20
BGD
9, 13319–13349, 2012
Ocean acidification impacts on bacterial community structure
A.-S. Roy et al.
Title Page
Abstract Introduction
Conclusions References
Tables Figures
◭ ◮
◭ ◮
Back Close
Full Screen / Esc
Printer-friendly Version Interactive Discussion
Discussion
P
a
per
|
Dis
cussion
P
a
per
|
Discussion
P
a
per
|
Discussio
n
P
a
per
|
et al. (2012); Czerny et al. (2012a); Czerny et al. (2012b); Bellerby et al. (2012); and finally in Schulz et al. (2012).
2.2 Sampling, filtration and sample selection
A total of 10 l of water was collected using integrated water sampler (Hydrobios, Kiel, Germany) between 0 and 12 m water depth; from the fjord (∼145 µatm) and six
meso-5
cosms (startingpCO2=2× ∼185,∼ 270,∼685,∼820,∼1050 µatm) on t-1, t1, t5, t7, t12, t14, t22, t26 and t28 (Fig. 1). Only six of the mesocosms were chosen for this study due to time, personnel and equipment constraints. The collected water was first pre-filtered on a 20 µm sieve, and sequentially filtered through a 3 µm filter to isolate associate-particle bacterial fraction and through a 0.2 µm filter to isolate the free-living 10
bacterial fraction (Durapore®47 mm, Millipore). To avoid nucleic acid degradation, pro-cessing of the samples from filtration to flash-freezing (in liquid nitrogen) was performed within 30 min of the sampling event filtered and samples were flash frozen respecting this time period, and then stored at−80◦C until DNA/RNA extraction.
2.3 DNA extraction, PCR, and sequencing
15
Total nucleic acid was extracted from the 0.2 and 3 µm filters using the “Total RNA and DNA purification – NucleoSpin® RNA II RNA/DNA buffer” kits from Macherey-Nagel (Macherey-Nagel GmbH & Co. KG, D ¨uren, Germany). Standard protocol with minor modifications was followed. Changes to the protocol included, cryo vials containing filters being immersed in liquid nitrogen to allow the filters to be kept frozen until dis-20
ruption, and to facilitate the homogenization of the samples. The filters were crushed with RNase-free plastic pestles and lysozyme was directly added to the filter. DNA quality and quantity was assessed by micro-volume spectrophotometer nanodrop ND-1000 (PeqLab GmbH, Erlangen, Germany) measurements. All samples were kept at
−80◦C until further analysis.
BGD
9, 13319–13349, 2012
Ocean acidification impacts on bacterial community structure
A.-S. Roy et al.
Title Page
Abstract Introduction
Conclusions References
Tables Figures
◭ ◮
◭ ◮
Back Close
Full Screen / Esc
Printer-friendly Version Interactive Discussion
Discussion
P
a
per
|
Dis
cussion
P
a
per
|
Discussion
P
a
per
|
Discussio
n
P
a
per
|
PCR and sequencing were performed following the Illumina HiSeq2000 and MiSeq V4–16S rRNA protocol (Caporaso et al., 2012). Briefly, the V4-V5 region of the 16S rRNA gene was amplified with region-specific primers that included the Illumina (Illu-mina Inc., CA, USA) paired-end flowcell adapter sequences. The barcode was read using the custom index sequencing primer in an additional cycle (12 bp). Each sam-5
ple was amplified in triplicate, and was afterwards pooled. Each 25 µl PCR reaction contained 12 µl of MoBio PCR Water (Certified DNA-Free), 10 µl of 5 Prime HotMas-terMix, 1 µl of Forward Primer (5 µM initial concentration), 1 µl Golay Barcode Tagged Reverse Primer (5 µM initial concentration), and 1 µl of template DNA. The reactions were heated to 94 ◦C for 3 min for their initial denaturation, followed by 35 cycles in 10
series of 94◦C for 45 s, 50◦C for 60 s, and 72◦C for 90 s. The amplicons were quan-tified using Quant-itTM Picogreen® (Invitrogen by life technologiesTM, Ca, USA), and pooled in equal amounts (ng) into a 1.5 ml tube. Once pooled, the entire amplicon pool was cleaned-up with the MO-BIO UltraClean® PCR Clean-Up Kit (MO-BIO Laborato-ries, INC., CA, USA). Finally, the pooled samples were quantified using a Qubit® fluo-15
rometer (Invitrogen by life technologiesTM, Ca, USA), and the molarity was estimated based on amplicon length. From this estimate, dilutions were made down to 2 µM and the standard Illumina sample preparation for sequencing was followed. Pooled am-plicons were sequenced using custom sequencing primers, read 1, read 2, and index. These sequencing primers were designed to be complementary to the V4 amplification 20
primers to avoid sequencing of the primers. Amplicons were sequenced in a paired-end, 100 bp×100 bp cycle run on the Illumina HiSeq2000, at a concentration of 4 p.m.
with a 10 % PhiX spike. An entire control lane devoted to PhiX is also useful when se-quencing low base diversity samples, like amplicons, and was included in the present analysis.
25
2.4 Sequence data analysis
BGD
9, 13319–13349, 2012
Ocean acidification impacts on bacterial community structure
A.-S. Roy et al.
Title Page
Abstract Introduction
Conclusions References
Tables Figures
◭ ◮
◭ ◮
Back Close
Full Screen / Esc
Printer-friendly Version Interactive Discussion
Discussion
P
a
per
|
Dis
cussion
P
a
per
|
Discussion
P
a
per
|
Discussio
n
P
a
per
|
filtering of raw Illumina data. OTUs were picked against the Greengenes (McDonald et al., 2012) database pre-clustered at 97 % identity, and sequences that did not hit the reference collection were discarded. Representative sequences were aligned to the Greengenes core set with PyNAST (Caporaso et al., 2010). All sequences that failed to align were discarded. A phylogenetic tree was built from the alignment, and taxonomy 5
was assigned to each sequence using the RDP classifier (Wang et al., 2007) retrained on Greengenes. Samples were rarefied to an even depth of 81 181 sequences and only the OTUs that appeared at least twice in any sample in the dataset were included in the further analyses; 106 singleton OTUs were not included in this analysis.
2.5 Statistical analysis
10
Multivariate analysis of microbial community structure was carried out in CANOCO 4.54 (ter Braak and ˇSmilauer, 2002), where the count of each OTU (97 % similarity) was used as a measure of abundance. All analyses had samples as scaling focus, and all species data were Hellinger-transformed using the program PrCoord 1.0 (Legendre and Gallagher, 2001; ter Braak and ˇSmilauer, 2002). Analysis of variance (ANOVA) 15
followed by a Tukey test was done to test for significant differences between treatments (i.e. control vs. fjord, fjord vs. mesocosm, control vs. mesocosm) within each abundant phyla. Detrended correspondence analysis (DCA) of the transformed OTU abundance data showed axes lengths <3.0, suggesting a linear treatment of the data (Ramette, 2007). Redundancy analysis (RDA), with manual forward selection and Monte Carlo 20
permutation tests (999 permutations), was used to evaluate effects of environmental variables (salinity, temperature, pH, chlorophyll a, etc.) on the microbial community composition. An indirect gradient analysis (PCoA) was used to plot the distribution of samples in ordination space, with important environmental variables (as indicated by forward selection) overlaid as Supplement. Microbial community structure was also 25
BGD
9, 13319–13349, 2012
Ocean acidification impacts on bacterial community structure
A.-S. Roy et al.
Title Page
Abstract Introduction
Conclusions References
Tables Figures
◭ ◮
◭ ◮
Back Close
Full Screen / Esc
Printer-friendly Version Interactive Discussion
Discussion
P
a
per
|
Dis
cussion
P
a
per
|
Discussion
P
a
per
|
Discussio
n
P
a
per
|
In order to assess whether or not particular taxa were significantly influenced by pCO2, a Bonferroni-corrected g-test was done using QIIME in combination with FDR-correctedp-values to remove significance due to chance. All analyses were considered to have a significant difference ifp <0.05 after Bonferroni correction.
Heat maps presenting mean abundance count plotted againstpCO2and time (days) 5
of the three most abundant genus of the OTUs significantly correlated topCO2 were created using Ocean data view (Bremen, Germany).
3 Results
The 250 sequenced samples generated∼20 000 000 16S rRNA V4 reads (∼2 510 000
sequences per treatment); which clustered at 97 % sequence identity into 6821 OTUs. 10
3.1 Experimental timeline
Phytoplanktonic bloom evolution was identified using the daily measured chloro-phylla (chl a) concentration (µg l−1) (Fig. 1). The chla protocol and patterns are pre-sented in Schulz et al. (2012). Briefly, all treatments (fjord included) underwent a natu-ral bloom between t0 and t11, with its highest chlaconcentration on t6. Subsequently, 15
a second and third strong phytoplankton bloom happened only in the mesocosms fol-lowing nutrient addition on t13. The second bloom had its highest chlaconcentration on t19 and the third one, which varied greatly between mesocosms, reached its highest concentration on t27. These 3 blooms were represented as four general phases in phy-toplankton chlorophyll phases defined by Schulz et al. (2012): phase 0 occurred from 20
BGD
9, 13319–13349, 2012
Ocean acidification impacts on bacterial community structure
A.-S. Roy et al.
Title Page
Abstract Introduction
Conclusions References
Tables Figures
◭ ◮
◭ ◮
Back Close
Full Screen / Esc
Printer-friendly Version Interactive Discussion
Discussion
P
a
per
|
Dis
cussion
P
a
per
|
Discussion
P
a
per
|
Discussio
n
P
a
per
|
Detailed fluctuations of chla, nutrient concentrations, pH andpCO2are presented in this issue in Schulz et al. (2012) and Bellerby et al. (2012).
3.2 Community structuring variables
The significant structuring variables for the total community during the post-nutrient addition period (t13–t30) of the experiment were (in order of explanatory importance) 5
“fjord vs. mesocosm origin” (i.e. whether the sample was from water contained in a mesocosm or from the open fjord), filter size fraction (i.e. separating free-living (FL) from particle-associated (PA) bacteria), Si concentration, PO4concentration, mean pri-mary production 14C-POC (PP), temperature (T), and pH (Fig S1 and Table 1). The microbial community in the FL size fraction (0.2–3 µm) from the fjord and all the meso-10
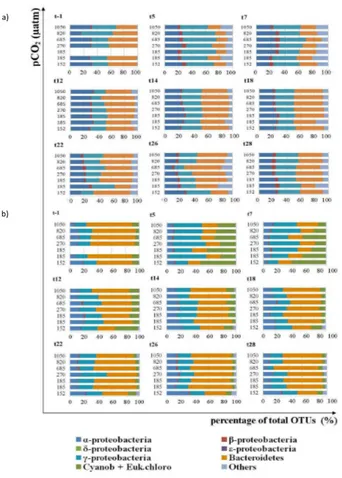
cosms, was dominated throughout the experiment by Proteobacteria (in order of abun-dance: Gamma (γ)-, Alpha (α)- and Beta (β)- proteobacteria), however, this phylum began dropping in abundance gradually after t7, coincident with the increase in the abundance of Bacteroidetes (Fig. 2). In the PA size fraction (3–20 µm) Bacteroidetes dominated consistently, while a fourth group comprised of the “Cyanobacteria and eu-15
karyotic chloroplasts” (which included Chlorophyta, Haptophyceae, Rhodophyta and Stramenopiles) were also abundant (Fig. 2). The group classified as “others” in the FL fraction was composed predominately of Cyanobacteria at the beginning of the exper-iment, and of Actinobacteria towards the end (Fig. S2). In the PA fraction, the “others” group was extremely variable until t7. For example, at t-1 the fjord “others” group was 20
dominated by the Verrucomicrobia while the mesocosms “others” groups was domi-nated by Actinobacteria; by t5 Firmicutes domidomi-nated in most mesocosms, while being almost absent from the fjord. After at t7, the Actinobacteria was the dominant taxa in the “others” group in all treatments for the remainder of the experiment. At the end (t28), some Verrucomicrobia increased in the control,∼270, and∼685 µatm mesocosms (Fig 25
S2).
BGD
9, 13319–13349, 2012
Ocean acidification impacts on bacterial community structure
A.-S. Roy et al.
Title Page
Abstract Introduction
Conclusions References
Tables Figures
◭ ◮
◭ ◮
Back Close
Full Screen / Esc
Printer-friendly Version Interactive Discussion
Discussion
P
a
per
|
Dis
cussion
P
a
per
|
Discussion
P
a
per
|
Discussio
n
P
a
per
|
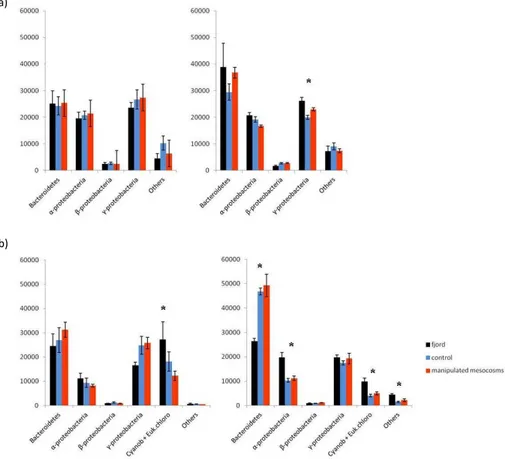
assemblage from the mesocosms in the FL and PA size fraction before (origin 3 %–4 %) and after (origin 48 %–12 %) mesocosm nutrient addition (Table 2); however, the fjord and mesocosm communities were not significantly different until after t5. The microbial community in the fjord FL fraction was not significantly different from the mesocosms communities in the pre-nutrient addition phase and only the γ-proteobacterial abun-5
dance was significantly different (p <0.05) between fjord and mesocosm in the post-nutrient addition phase. The fjord PA size fraction microbial community was significantly different from the mesocosms during both the pre- and post-nutrient addition phases. In particular, the “Cyanobacteria and eukaryotic chloroplasts” group was significantly different between fjord and mesocosms pre- and post-nutrient addition; while the Bac-10
teroidetes,α-proteobacteria and “others” were only significantly different post-nutrient addition (Fig. 3 and Table 3). Furthermore, the significant variables that correlated with community structure changes in the FL size fraction were dimethyl sulphide (DMS– 16 %), bacterial production (bp–15 %), density (d–12 %) for the pre-nutrient period (t-4 to t12), and origin (48 %),pCO2 (10 %), day (10 %) for the post-nutrient period (t13– 15
t30; Table 2). For the “large” size fraction, these variables were oxygen (O2–7 %), DMS (7 %), nitrate (NO3–5 %) and origin (4 %) for the pre-nutrient period (t-4 to t12); and Si (27 %) and origin (12 %) for the post-nutrient addition period (t13–t30; Table 2). There-fore, the differences in microbial community structure between the fjord and meso-cosms were primarily due to the addition of nutrients to the mesomeso-cosms, and not to 20
pCO2manipulation, as the control mesocosms were not significantly different from the elevated CO2mesocosms post nutrient addition.
3.3 pCO2effect on microbial community
Although not identified as a major community structuring variable, thepCO2treatment was found to be significantly correlated to the changing relative abundance for 15 rare 25
BGD
9, 13319–13349, 2012
Ocean acidification impacts on bacterial community structure
A.-S. Roy et al.
Title Page
Abstract Introduction
Conclusions References
Tables Figures
◭ ◮
◭ ◮
Back Close
Full Screen / Esc
Printer-friendly Version Interactive Discussion
Discussion
P
a
per
|
Dis
cussion
P
a
per
|
Discussion
P
a
per
|
Discussio
n
P
a
per
|
pCO2 mesocosms. The remaining three decreased, with their highest abundances in the lowest (∼185 µatm) pCO2 mesocosm, or before manipulation started (Fig. 4, Fig. S3 and S4). The three most abundant of these 15 taxa were Methylotenera (β-proteobacteria), Colwellia (γ-proteobacteria) and Fluviicola (Bacteroidetes). Methy-lotenera and Colwellia abundances were at their highest in, respectively, the ∼686 5
and ∼ 824 µatm mesocosms toward the end of the experiment (t22). Fluviicola was
present from the beginning of the experiment, but decreased precipitously after CO2 was added and then recovered in abundance after t10, reaching its highest abundance in the 1050 µatm mesocosm between t12 and t22 (Fig. 4).
4 Discussion
10
4.1 Mesocosms and structuring effects
In this study a large-scale mesocosm experiment was used to investigate the im-pacts of OA on the microbial community structure in a coastal, high latitude marine pelagic ecosystem. The experimental design provided the opportunity to test for the effects of 4 differentpCO2concentrations (∼270,∼685,∼820,∼1050 µatm) over a six
15
week period, with comparison against two negative controls (∼185 µatm). In addition, mesocosm-specific experimental artefacts were monitored for by sampling the fjord mi-crobial community throughout the course of the experiment. The mimi-crobial community structure post-nutrient-addition (t13) was significantly correlated with seven variables, the most influential of which was sample origin (fjord or mesocosm). The overall com-20
munity structure was not significantly different were not significant between mesocosms (including control versus elevatedpCO2) over the course of the experiment. The signifi-cant effect of the mesocosm enclosures on microbial community structure could be due to the mesocosms themselves (isolating a microbial community from the surrounding fjord community) or since the effect was not significant before nutrient addition, more 25
BGD
9, 13319–13349, 2012
Ocean acidification impacts on bacterial community structure
A.-S. Roy et al.
Title Page
Abstract Introduction
Conclusions References
Tables Figures
◭ ◮
◭ ◮
Back Close
Full Screen / Esc
Printer-friendly Version Interactive Discussion
Discussion
P
a
per
|
Dis
cussion
P
a
per
|
Discussion
P
a
per
|
Discussio
n
P
a
per
|
Size fraction was the second most important variable in explaining differences in community structure. Before nutrient addition, the free-living size fraction communi-ties were not significantly different between the fjord (ambient), control mesocosms, and the elevatedpCO2mesocosms. However, post-nutrient addition,γ-proteobacterial abundances were significantly different between fjord and mesocosms, and probably 5
reflect the utilization of metabolites released by decaying phytoplankton in the post-bloom system. Furthermore, the overall abundance of free-living size fraction Bac-teroidetes increased in post-blooms conditions, possibly also as a result of the decay-ing algal bloom. Theγ-proteobacteria and Bacteroidetes include many phytodetritus-assimilating organisms (Teske et al., 2011; Abell et al., 2005; Pinhassi et al., 2004). 10
Additionally, increases in Bacteroidetes abundance were observed in the particle-associated size fraction mesocosms post-nutrient addition, as decaying phytoplank-ton tend to aggregate, creating larger particles. Despite the observation that Bac-teroidetes showed bloom-related dynamics, and contradictory to the findings of Zhang et al. (2012), no significant difference in the Bacteroidetes abundance (in either frac-15
tion) was found between the control and elevatedpCO2 mesocosms, suggesting that elevatedpCO2did not impact the relative abundance of Bacteroidetes. However, their abundance in the fjord was significantly lower than in the mesocosms, suggesting that the nutrient addition or influence of the mesocosm enclosure did have an impact.
The particle-associated fraction in the mesocosms also showed differences in the 20
relative abundance of dominant phyla following nutrient addition (t13). It has previously been established that particle-associated assemblages were predominantly connected to phytoplankton development (Riemann et al., 2000; Allgaier et al., 2008). Further-more, differences in the “Cyanobacteria and eukaryotic chloroplasts” group were mea-surable before nutrient addition; however these differences are believed to be related 25
BGD
9, 13319–13349, 2012
Ocean acidification impacts on bacterial community structure
A.-S. Roy et al.
Title Page
Abstract Introduction
Conclusions References
Tables Figures
◭ ◮
◭ ◮
Back Close
Full Screen / Esc
Printer-friendly Version Interactive Discussion
Discussion
P
a
per
|
Dis
cussion
P
a
per
|
Discussion
P
a
per
|
Discussio
n
P
a
per
|
and heterotrophic community structure. However, no significant differences were found between the control and the elevated mesocosms, which suggests that pCO2 eleva-tion was not an important community-structuring variable for the particle associated fraction in this experiment. Si was the third main structuring variable and is potentially related to diatom abundance (de Kluijver et al., 2010). The re-dispersal of Si from de-5
caying diatoms, after a phytoplankton bloom, is carried out by a diverse fast growing bacteria related to cytophagales (from Flavobacteria; Riemann et al., 2000). Indeed, an increase in the abundance of Bacteroidetes, which contains the Flavobacteria, was observed in the post-nutrient addition phase.
However, when separating and analysing the phytoplankton phases independently, 10
for free-living versus particle-associated bacteria, the community structuring variables shifted completely. The most influential variable for the free-living bacteria under pre-nutrient addition was DMS concentration, while origin (Fjord vs. mesocosm) was most-influential under post-nutrient addition conditions. O2and Si were the most significant structuring variables for the particulate-associated bacteria, respectively pre- and post-15
nutrient-addition. Variables associated with phytoplankton bloom dynamics were most important for structuring the community, especially when looking at the taxonomic shifts between fjord, control mesocosms and elevated pCO2 mesocosms. The differences are greater after t13, when the nutrients were added, inducing two large phytoplank-ton blooms. These differences were most evident in the particle-associated fraction. 20
Therefore, it is possible to state that nutrients, and therefore the phytoplankton blooms, were the main drivers of microbial community structure in this experiment, which is in agreement with previous studies (Allgaier et al., 2008; de Kluijver et al., 2010; Sperling et al., 2012).
4.2 ElevatedpCO2effect 25
BGD
9, 13319–13349, 2012
Ocean acidification impacts on bacterial community structure
A.-S. Roy et al.
Title Page
Abstract Introduction
Conclusions References
Tables Figures
◭ ◮
◭ ◮
Back Close
Full Screen / Esc
Printer-friendly Version Interactive Discussion
Discussion
P
a
per
|
Dis
cussion
P
a
per
|
Discussion
P
a
per
|
Discussio
n
P
a
per
|
However, other work suggests that only the community structure of the free-living bac-teria is significantly affected by elevated pCO2 (Allgaier et al., 2008). The extensive database of 16S rRNA sequence obtained in this study provided the high resolution necessary to study subtle but significant changes in community structure hinted at in prior studies. In agreement with Allgaier et al. (2008), the effect of elevated pCO2 in 5
this experiment was slight and only impacted the free-living bacteria after nutrient ad-dition, which corresponded to post-nutrient addition and post-bloom conditions (after t13) in this study. This increased post-bloom CO2 effect was previously observed in other mesocosms experiments (Arnosti et al., 2011; de Kluijver et al., 2010); confirm-ing a possible increased CO2effect under nutrient (N, P, Si) limitation.
10
While pH was shown to be a weak driver of microbial community structure in our ex-periment, the direct impact ofpCO2was found to be non-significant, except for 15 rare taxa, which did show a response. Therefore, the level of taxonomic resolution afforded by this study suggests that, in this ecosystem, rare organisms may be disproportion-ately affected by acidification. The most abundant of these 15 rare taxa was Methy-15
lotenera (genus) and had its highest mean abundance in the medium pCO2 meso-cosms (∼685 µatm). Species from this genus are generally aerobic, ubiquitous bacteria
found in a wide range of O2, salinity, temperature and pH; Methylotenera can colonize multiple pH range (5 to 8.5) but it grows optimally at pH 7.5 (Kalyuzhnaya et al., 2006; Bosh et al., 2009), suggesting that pH may have a strong influence for this taxa. Indeed, 20
the pH close to this value from t5 until the end of the experiment in the mesocosms with apCO2 over ∼685 µatm. The highest abundance was found from t22 until t28 where
the pH was 7.9 and 7.94. A lower pH was found (pHT 7.57–7.80) in the∼1050 µatm
mesocosm, but this was not accompanied by an increase in Methylonera abundance, potentially because thepCO2concentration itself was toxic to this species at this stage, 25
BGD
9, 13319–13349, 2012
Ocean acidification impacts on bacterial community structure
A.-S. Roy et al.
Title Page
Abstract Introduction
Conclusions References
Tables Figures
◭ ◮
◭ ◮
Back Close
Full Screen / Esc
Printer-friendly Version Interactive Discussion
Discussion
P
a
per
|
Dis
cussion
P
a
per
|
Discussion
P
a
per
|
Discussio
n
P
a
per
|
et al., 2006, 2010). These organic compounds play an important role in the global car-bon cycle. In fact, these compounds were recently identified as responsible for major greenhouse emissions on a scale similar to methane emissions (Chistoserdova et al., 2009). Further investigation of the behaviour of these C1-compound-degraders in re-sponse to elevated CO2are, therefore, important for understanding biotic influences on 5
climate dynamics. The second most abundant group of these 15pCO2-correlated rare taxa was Colwellia, which includes Arctic seawater bacteria capable of growing within a wide range ofT: e.g.−1 to 10◦C (optimal growth 8◦C) forColwellia psychrerythraea;
4 to 25◦C forColwellia asteriadis sp.and 0 to 30◦C forColwellia chuckchiensis. These organisms are also capable of colonising a wide range of pH from 4 to 10 (Yu et al., 10
2011; Choi et al., 2010; Meth ´e et al., 2005).C. psychrerythreais considered a model organism for psychrophiles. This organism shows multiple molecular adaptations to the cold, like enzymes for cryoprotection, for dissolving high-molecular-weight organic compounds (ex. carbon), for stability in extreme environments (extracellular polymeric substances) and for cold-active processes (Meth ´e et al., 2005; Huston et al., 2004). 15
These features make Colwellia sp. key participants in carbon and nutrient cycling in the cold marine environments. Since some methanogenenic enzymes were previously found inColwellia sp. (Meth ´e, et al., 2005) one can speculate that these compounds were found in greater abundance toward the end of the experiment. This would also support the presence of the Methylotenera, which increased in abundant towards the 20
end of the experiment. Finally the genus Fluviicola, the third most abundant OTU cor-related withpCO2, was dominant in the elevated CO2 mesocosms (∼1058 µatm).
In-terestingly, Fluviicola was present at the beginning of the experiment but decreased shortly after CO2 treatment started. The abundance increased under elevatedpCO2, but stayed low in mediumpCO2mesocosms and absent in the controls, for both size 25
BGD
9, 13319–13349, 2012
Ocean acidification impacts on bacterial community structure
A.-S. Roy et al.
Title Page
Abstract Introduction
Conclusions References
Tables Figures
◭ ◮
◭ ◮
Back Close
Full Screen / Esc
Printer-friendly Version Interactive Discussion
Discussion
P
a
per
|
Dis
cussion
P
a
per
|
Discussion
P
a
per
|
Discussio
n
P
a
per
|
5 Conclusions
In summary, multiple parameters were found to significantly influence the structure of the bacterial community in Svalbard mesocosms (2010). The most influential factors were the origin of the sample (fjord or mesocosms) and nutrient addition. Further-more, the relative importance of size fraction (free-living versus particle-associated), 5
Si, PO4, primary production, temperature, and pH in structuring the community de-pended greatly on the time at which the community was sampled in relation to the phytoplankton blooms. The direct impact ofpCO2was found to be significant for only 15 rare taxa and should be further investigated, as this limitedpCO2effect could have evolutionary consequences creating a shift in the taxa dominance and/or diversity; pro-10
foundly affecting the structure of entire community in a high CO2 world. However, it should be noted that thepCO2 conditions in which these organisms dominated were super-elevated compared to predicted outcomes for the surface ocean under current climate change scenarios.
Future work should focus on exploring the functional responses of the community 15
(metagenomics/metatranscriptomics) to evaluate how elevatedpCO2 or OA influence these processes over a longer time period.
Supplementary material related to this article is available online at: http://www.biogeosciences-discuss.net/9/13319/2012/
bgd-9-13319-2012-supplement.pdf.
20
Acknowledgements. This work is a contribution to the “European Project on Ocean Acidifica-tion” (EPOCA) which received funding from the European Community’s Seventh Framework Programme (FP7/2007–2013) under grant agreement no. 211384. We gratefully acknowledge the logistical support of Greenpeace International for its assistance with the transport of the mesocosm facility from Kiel to Ny- ˚Alesund and back to Kiel. We also thank the captains and
25
BGD
9, 13319–13349, 2012
Ocean acidification impacts on bacterial community structure
A.-S. Roy et al.
Title Page
Abstract Introduction
Conclusions References
Tables Figures
◭ ◮
◭ ◮
Back Close
Full Screen / Esc
Printer-friendly Version Interactive Discussion
Discussion
P
a
per
|
Dis
cussion
P
a
per
|
Discussion
P
a
per
|
Discussio
n
P
a
per
|
in Svalbard (UNIS) for assistance during mesocosm transport and during deployment and recovery in Kongsfjorden. We thank the staffof the French-German Arctic Research Base at Ny- ˚Alesund, in particular Marcus Schumacher, for on-site logistical support. We would like to thank Mesoaqua for supporting J.I.N. in the field trip time to Svalbard on grant METAEPOCA. We also want to thank Tina Baustian for her help during the RNA/DNA extraction. Finally, the
5
funding for S.M.G. was provided by NIH Training Grant 5T-32EB-009412.
The service charges for this open access publication have been covered by a Research Centre of the Helmholtz Association.
10
References
Abell, G. C. J. and Bowman, J. P.: Ecological and biogeographic relationships of class Flavobac-teria in the Southern Ocean, FEMS Microbiol. Ecol., 51, 265–277, 2005.
Agogu ´e, H., Lamy, D., Neal, P. R., Sogin, M. L., and Herndl, G. J.: Water mass-specificity of bacterial communities in the North Atlantic revealed by massively parallel sequencing, Mol.
15
Ecol., 20, 258–274, 2011.
Allgaier, M., Riebesell, U., Vogt, M., Thyrhaug, R., and Grossart, H.-P.: Coupling of heterotrophic bacteria to phytoplankton bloom development at differentpCO2levels: a mesocosm study,
Biogeosciences, 5, 1007–1022, doi:10.5194/bg-5-1007-2008, 2008.
Arnosti, C., Grossart, H. P., M ¨uhling, M., Joint, I., and Passow, U.: Dynamics of extracellular
20
enzyme activities in seawater under changed atmosphericpCO2: a mesocosm investigation,
Aquat. Microb. Ecol., 64, 285–298, 2011.
Bellerby, R. G. J., Silyakova, A., Nondal, G., Slagstad, D., Czerny, J., De Lange, T., and Lud-wig, A.: Marine carbonate system evolution during the EPOCA Arctic pelagic ecosystem experiment in the context of simulated future Arctic ocean acidification, Biogeosciences,
ac-25
cepted, 2012.
BGD
9, 13319–13349, 2012
Ocean acidification impacts on bacterial community structure
A.-S. Roy et al.
Title Page
Abstract Introduction
Conclusions References
Tables Figures
◭ ◮
◭ ◮
Back Close
Full Screen / Esc
Printer-friendly Version Interactive Discussion
Discussion
P
a
per
|
Dis
cussion
P
a
per
|
Discussion
P
a
per
|
Discussio
n
P
a
per
|
Caporaso, J. G., Kuczynski, J., Stombaugh, J., Bittinger, K., Bushman, F. D., Costello, E. K., Fierer, N., Pe ˜na, A. G., Goodrich, J. K., Gordon, J. I., Huttley, G. A., Kelley, S. T., Knights, D., Koenig, J. E., Ley, R. E., Lozupone, C. A., McDonald, D., Muegge, B. D., Pirrung, M., Reeder, J., Sevinsky, J. R., Turnbaugh, P. J., Walters, W. A., Widmann, J., Yatsunenko, T., Zaneveld, J., and Knight, R.: QIIME allows analysis of high-throughput community
sequenc-5
ing data, Nat. Methods, 7, 335–336, 2010.
Caporaso, J. G., Lauber, C. L., Walters, W. A., Berg-Lyons, D., Huntley, J., Fierer, N., Owens, S. M., Betley, J., Fraser, L., Bauer, M., Gormley, N., Gilbert, J. A., Smith, G., Knight, R.: Ultra-high-throughput microbial community analysis on the Illumina HiSeq and MiSeq platforms, ISME, 6, 1621–1624, doi:10.1038/ismej.2012.8, 2012.
10
Chistoserdova, L., Kalyuzhnaya, M. G., and Lapidus, A.: The expanding world of methylotrophic metabolism, Annu. Rev. Microbiol., 63, 477–499, doi:10.1146/annurev.micro.091208.073600, 2009.
Choi, E. J., Kwon, H. C., Koh, H. Y., Kim, Y. S., and Yang, H. O.:Colwellia asteriadis sp. nov., a marine bacterium isolated from the starfishAsterias amurensis, IJSEM, 60, 1952–1957,
15
doi:10.1099/ijs.0.016055-0, 2010.
Czerny, J., Schulz, K. G., Boxhammer, T., Bellerby, R. G. J., B ¨udenbender, J., Engel, A., Krug, S. A., Ludwig, A., Nachtigall, K., Nondal, G., Niehoff, B., Siljakova, A., and Riebe-sell, U.: Element budgets in an Arctic mesocosm CO2perturbation study, Biogeosciences, in
review, 2012a.
20
Czerny, J., Schulz, K. G., Ludwig, A., and Riebesell, U.: A simple method for gas exchange measurements in mesocosms and its application for carbon budgeting, Biogeosciences, in review, 2012b.
de Kluijver, A., Soetaert, K., Schulz, K. G., Riebesell, U., Bellerby, R. G. J., and Middelburg, J. J.: Phytoplankton-bacteria coupling under elevated CO2levels: a stable isotope labelling study, 25
Biogeosciences, 7, 3783–3797, doi:10.5194/bg-7-3783-2010, 2010.
Delille, B., Harlay, J., Zondervan, I., Jacquet, S., Chou, L., Wollast, R., Bellerby, R. G. J., Michel Frankignoulle, Vieira Borges, A., Riebesell, U., and Gattuso, J. P.: Re-sponse of primary production and calcification to changes of pCO2 during experimental
blooms of the coccolithophorid Emiliania huxleyi, Global Biogeochem. Cy., 19, GB2023,
30
doi:10.1029/2004GB002318, 2005.
BGD
9, 13319–13349, 2012
Ocean acidification impacts on bacterial community structure
A.-S. Roy et al.
Title Page
Abstract Introduction
Conclusions References
Tables Figures
◭ ◮
◭ ◮
Back Close
Full Screen / Esc
Printer-friendly Version Interactive Discussion
Discussion
P
a
per
|
Dis
cussion
P
a
per
|
Discussion
P
a
per
|
Discussio
n
P
a
per
|
Fu, F.-X., Mulholland, M. R., Garcia, N. S., Beck, A., Bernhardt, P. W., Warner, M. E., Sa ˜nudo-Wilhelmy, S. A., and Hutchins, D. A.: Interactions between changingpCO2, N2fixation, and
Fe limitation in the marine unicellular cyanobacteriumCrocosphaera, Limnol. Oceanogr., 53, 2472–2484, 2008.
Gilbert, J. A., Field, D., Swift, P., Newbold, L., Oliver A., Smyth, T., Somerfield, P. J., Huse, S.,
5
and Joint, I.: The seasonal structure of microbial communities in the Western English Chan-nel, Environ. Microbiol., 11, 3132–3139, 2009.
Gilbert, J. A., Meyer, F., Schriml, L., Joint, I. R., Muhling, M., and Field, D.: Metagenomes and metatranscriptomes from the L4 long-term coastal monitoring station in the Western English Channel, SIGS, 3, 183–193, 2010.
10
Grossart, H.-P., Allgaier, M., Passow, U., and Riebesell, U.: Testing the effect of CO2
concen-tration on dynamics of marine heterotrophic bacterioplankton, Limnol. Oceanogr., 51, 1–11, 2006.
Hubert, J. A., Welch, D. M., Morrison, H. G., Huse, S. M., Neal, P. R., Butterfield, D. A., and Sogin, M. L.: Microbial population structures in the deep marine biosphere, Science, 318,
15
97–100, doi:10.1126/science.1146689, 2007.
Huse, S. M., Dethlefsen, L., Huber, J. A., Welch, D. M., Relman, D. A., and Sogin, M. L.: Explor-ing microbial diversity and taxonomy usExplor-ing SSU rRNA hypervariable tag sequencExplor-ing, Plos. Genet., 4, e1000255, doi:10.1371/journal.pgen.1000255, 2008.
Huston, A. L., Meth ´e, B., and Deming J. W.: Purification, characterization, and
se-20
quencing of an extracellular cold-active aminopeptidase produced by marine psy-chrophileColwellia psychrerythraeastrain 34 H, Appl. Environ. Microbiol., 70, 3321–3328, doi:10.1128/AEM.70.6.3321-3328.2004, 2004.
Hutchins, D. A., Fu, F.-X., Zhang, Y., Warner, M. E., Feng, Y., Portune, K., Bernhardt, P. W., and Mulholland, M. R.: CO2 control of Trichodesmium N2 fixation, photosynthesis, growth 25
rates, and elemental ratios: implications for past, present, and future ocean biogeochemistry, Limnol. Oceanogr., 52, 1293–1304, 2007.
Kalyuzhnaya, M. G., Bowerman, S., Lara, J. C., Lidstrom, M. E., and Chistoserdova, L.: Methy-lotenera mobilis gen. nov., sp. nov., an obligately methylamine-utilizing bacterium within the family Methylophilaceae, Int. J. Syst. Evol. Microbiol., 56, 2819–2823, 2006.
30
BGD
9, 13319–13349, 2012
Ocean acidification impacts on bacterial community structure
A.-S. Roy et al.
Title Page
Abstract Introduction
Conclusions References
Tables Figures
◭ ◮
◭ ◮
Back Close
Full Screen / Esc
Printer-friendly Version Interactive Discussion
Discussion
P
a
per
|
Dis
cussion
P
a
per
|
Discussion
P
a
per
|
Discussio
n
P
a
per
|
Legendre, P. and Gallagher, E. D.: Ecologically meaningful transformations for ordination of species data, Oecologia, 129, 271–280, 2001.
Lidstrom, M. E.: Aerobic methylotrophic prokaryotes, in: The Prokaryotes, edited by: Balows, A., Truper, H. G., Dworkin, M., Harder, W., and Schleifer,K.-H., Springer, New York, 618–634, 2006.
5
Lozupone, C. and Knight, R.: UniFrac: a new phylogenetic method for comparing microbial communities, Appl. Environ. Microbiol., 71, 8228–8235, 2005.
Margulies, M., Egholm, M., Altman, W. E., Attiya, S., Bader, J. S., Bemben, L. A., Berka, J., Braverman, M. S., Chen, Y.-C., Chen, Z., Dewell, S. B., Du, L., Fierro, J. M., Gomes, X. V., Godwin, B. C., He, W., Helgesen, S., He Ho, C., Irzyk, G. P., Jando, S. C., Alenquer, M. L. I.,
10
Jarvie, T. P., Jirage, K. B., Kim, J.-B., Knight, J. R., Lanza, J. R., Leamon, J. H., Lefkowitz, S. M., Lei, M., Li, J., Lohman, K. L., Lu, H., Makhijani, V. B., McDade, K. E., McKenna, M. P., Myers, E. W., Nickerson, E., Nobile, J. R., Plant, R., Puc, B. P., Ronan, M. T., Roth, G. T., Sarkis, G. J., Simons, J. F., Simpson, J. W., Srinivasan, M., Tartaro, K. R., Tomasz, A., Vogt, K. A., Volkmer, G. A., Wang, S. H., Wang, Y., Weiner, M. P., Yu, P., Begley, R. F.,
15
and Rothberg, J. M.: Genome sequencing in microfabricated high-density picolitre reactors, Nature, 437, 376–380, 2005.
McDonald, D., Price, M. N., Goodrich, J., Nawrocki, E. P., DeSantis, T. Z., Probst, A., Ander-sen, G. L., Knight, R., and Hugenholtz, P.: An improved Greengenes taxonomy with explicit ranks for ecological and evolutionary analyses of bacteria and archaea, ISME J., 6, 610–618,
20
2012.
Meth ´e, B. A., Nelson, K. E., Deming, J. W., Momen, B., Melamud, E., Zhang, X., Moult, J., Madupu, R., Nelson, W. C., Dodson, R. J., Brinkac, L. M., Daugherty, S. C., Durkin, A. S., Deboy, R. T., Kolonay, J. F., Sullivan, S. A., Zhou, L., Davidsen, T. M., Wu, M., Huston, A. L., Lewis, M., Weaver, B., Weidman, J. F., Khouri, H., Utterback, T. R., Feldblyum, T. V., and
25
Fraser, C. M.: The psychrophilic lifestyle as revealed by the genome sequence ofColwellia psychrerythraea34H through genomic and proteomic analyses, PNAS, 102, 10913–10918, 2005.
Newbold, L. K., Oliver, A. E., Booth, T., Tiwari, B., DeSantis, T., Maguire, M., Andersen, G., van der Gast, C. J., and Whiteley, A. S.: The response of picoplankton to ocean acidification,
30
BGD
9, 13319–13349, 2012
Ocean acidification impacts on bacterial community structure
A.-S. Roy et al.
Title Page
Abstract Introduction
Conclusions References
Tables Figures
◭ ◮
◭ ◮
Back Close
Full Screen / Esc
Printer-friendly Version Interactive Discussion
Discussion
P
a
per
|
Dis
cussion
P
a
per
|
Discussion
P
a
per
|
Discussio
n
P
a
per
|
Pinhassi, J., Sala, M. M., Havskum, H., Peters, F., Guadayol, O., Malits, A., and Marras ´e, C.: Changes in bacterioplankton composition under different phytoplankton regimens, Appl. En-viron. Microbiol., 70, 6753–6766, 2004.
Ramette, A.: Multivariate analyses in microbial ecology, FEMS Microbiol. Ecol., 62, 142–160, 2007.
5
Riebesell, U., Bellerby, R. G. J., Grossart, H.-P., and Thingstad, F.: Mesocosm CO2perturbation
studies: from organism to community level, Biogeosciences, 5, 1157–1164, doi:10.5194/bg-5-1157-2008, 2008.
Riebesell, U., Czerny, J., von Br ¨ockel, K., Boxhammer, T., B ¨udenbender, J., Deckelnick, M., Fischer, M., Hoffmann, D., Krug, S. A., Lentz, U., Ludwig, A., Muche, R., and Schulz, K. G.:
10
Technical Note: A mobile sea-going mesocosm system – new opportunities for ocean change research, Biogeosciences Discuss., 9, 12985–13017, doi:10.5194/bgd-9-12985-2012, 2012. Riemann, L., Steward, G. F., and Azam, F.: Dynamics of bacterial community composition and
activity during a mesocosm diatom bloom, Appl. Environ. Microbiol., 66, 578–587, 2000. Schulz, K. G., Bellerby, R. G. J., Brussaard, C. P. D., B ¨udenbender, J., Czerny, J., Engel, A.,
Fis-15
cher, M., Koch-Klavsen, S., Krug, S. A., Lischka, S., Ludwig, A., Meyerh ¨ofer, M., Nondal, G., Silyakova, A., Stuhr, A., and Riebesell, U.: Temporal biomass dynamics of an Arctic plank-ton bloom in response to increasing levels of atmospheric carbon dioxide, Biogeosciences Discuss., 9, 12543–12592, doi:10.5194/bgd-9-12543-2012, 2012.
Sogin, M. L., Morrison, H. G., Huber, J. A., Welch, D. M., Huse, S. M., Neal, P. R., Arrieta, J. M.,
20
and Gerhard J., and Herndl, G. J.: Microbial diversity in the deep sea and the underexplored “rare biosphere”, PNAS, 103, 12115–12120, doi:10.1073/pnas.0605127103, 2006.
Sperling, M., Piontek, J., Gerdts, G., Wichels, A., Schunck, H., Roy, A.-S., La Roche, J., Gilbert, J., Bittner, L., Romac, S., Riebesell, U., and Engel, A.: Effect of elevated CO2 on
the dynamics of particle attached and free living bacterioplankton communities in an Arctic
25
fjord, Biogeosciences Discuss., 9, 10725–10755, doi:10.5194/bgd-9-10725-2012, 2012. Tanaka, T., Thingstad, T. F., Løvdal, T., Grossart, H.-P., Larsen, A., Allgaier, M., Meyerh ¨ofer, M.,
Schulz, K. G., Wohlers, J., Z ¨ollner, E., and Riebesell, U.: Availability of phosphate for phy-toplankton and bacteria and of glucose for bacteria at differentpCO2levels in a mesocosm
study, Biogeosciences, 5, 669–678, doi:10.5194/bg-5-669-2008, 2008.
30
BGD
9, 13319–13349, 2012
Ocean acidification impacts on bacterial community structure
A.-S. Roy et al.
Title Page
Abstract Introduction
Conclusions References
Tables Figures
◭ ◮
◭ ◮
Back Close
Full Screen / Esc
Printer-friendly Version Interactive Discussion
Discussion
P
a
per
|
Dis
cussion
P
a
per
|
Discussion
P
a
per
|
Discussio
n
P
a
per
|
Power, Centrum voor biometrie, Plant research international Wageningen UR, Ithaca, NY, USA, p. 500, 2002.
Teske, A., Durbin, A., Ziervogel, K., Cox, C., and Arnosti, C., : Microbial community composition and function in permanently cold seawater and sediment from an Arctic fjord of Svalbard, Appl. Environ. Microbiol., 77, 2008–2018, doi:10.1128/AEM.01507-10, 2011.
5
Wang Q., Garrity, G. M., Tiedje, J. M., and Cole, J. R.: Naive Bayesian classifier for rapid assignment of rRNA sequences into the new bacterial taxonomy, Appl. Environ. Microbiol., 73, 5261–5267, 2007
Worden, A. Z. and Not, F.: Ecology and diversity of picoeukaryotes, in: Microbial Ecology of the Oceans, 2nd edn., edited by: Kirchman, D. L., John Wiley & Sons, Hoboken, NJ, USA,
10
159–205, 2008.
Yu, Y., Li, H.-R., and Zeng, Y.-X.:Colwellia chukchiensis sp. nov., a psychrotolerant bacterium isolated from the Arctic Ocean, IJSEM, 61, 850–853, 2011.
Zhang, R., Xia, X., Lau, S. C. K., Motegi, C., Weinbauer, M. G., and Jiao, N.: Response of bacterioplankton community structure to an artificial gradient ofpCO2 in the Arctic Ocean, 15
BGD
9, 13319–13349, 2012
Ocean acidification impacts on bacterial community structure
A.-S. Roy et al.
Title Page
Abstract Introduction
Conclusions References
Tables Figures
◭ ◮
◭ ◮
Back Close
Full Screen / Esc
Printer-friendly Version Interactive Discussion
Discussion
P
a
per
|
Dis
cussion
P
a
per
|
Discussion
P
a
per
|
Discussio
n
P
a
per
|
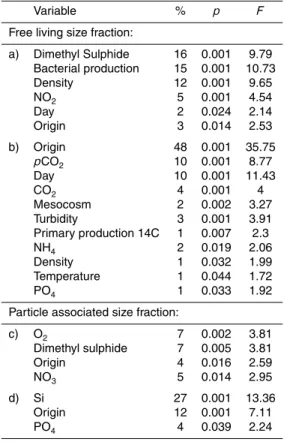
Table 1. Redundancy analysis showing the significant structuring variables for the whole
bacterial community during the post-nutrient addition period (t13–t30). Significant values are p <0.05.
Variables % p F
Origin 25 0.001 24.84
Fraction 14 0.001 17.77
Si 8 0.001 11.32
PO4 2 0.01 2.83
Primary production 2 0.026 2.31 Temperature 2 0.042 2.26
BGD
9, 13319–13349, 2012
Ocean acidification impacts on bacterial community structure
A.-S. Roy et al.
Title Page
Abstract Introduction
Conclusions References
Tables Figures
◭ ◮
◭ ◮
Back Close
Full Screen / Esc
Printer-friendly Version Interactive Discussion
Discussion
P
a
per
|
Dis
cussion
P
a
per
|
Discussion
P
a
per
|
Discussio
n
P
a
per
|
Table 2.Results from RDA forward selection (with Monte Carlo permutation tests) showing only
the significant (p <0.05) structuring variables for free living size fraction (0.2–3 µm) and for the particle associated size fraction (3–20 µm) during the pre-nutrient period from t1 to t12 (a and c, respectively) and post-nutrient period from t13 to t30 (b and d, respectively).
Variable % p F
Free living size fraction:
a) Dimethyl Sulphide 16 0.001 9.79 Bacterial production 15 0.001 10.73
Density 12 0.001 9.65
NO2 5 0.001 4.54
Day 2 0.024 2.14
Origin 3 0.014 2.53
b) Origin 48 0.001 35.75
pCO2 10 0.001 8.77
Day 10 0.001 11.43
CO2 4 0.001 4
Mesocosm 2 0.002 3.27
Turbidity 3 0.001 3.91
Primary production 14C 1 0.007 2.3
NH4 2 0.019 2.06
Density 1 0.032 1.99
Temperature 1 0.044 1.72
PO4 1 0.033 1.92
Particle associated size fraction:
c) O2 7 0.002 3.81
Dimethyl sulphide 7 0.005 3.81
Origin 4 0.016 2.59
NO3 5 0.014 2.95
d) Si 27 0.001 13.36
Origin 12 0.001 7.11
BGD
9, 13319–13349, 2012
Ocean acidification impacts on bacterial community structure
A.-S. Roy et al.
Title Page
Abstract Introduction
Conclusions References
Tables Figures
◭ ◮
◭ ◮
Back Close
Full Screen / Esc
Printer-friendly Version Interactive Discussion
Discussion
P
a
per
|
Dis
cussion
P
a
per
|
Discussion
P
a
per
|
Discussio
n
P
a
per
|
Table 3.Analysis of variance (ANOVA) showing the relationship in between each treatment
pre-and post-bloom condition for(a)free living and(b)particle associated size fraction bacteria of phyla with significant differences. Significant values arep <0.05.
Phylum Treatment p
Post-nutrient addition
Gamma-proteobacteria fjord-control 0.001 mesocosm-control 0.140 mesocosm-fjord 0.038 Pre-nutrient addition
“Cyanobacteria+euk.chloro” fjord-control 0.317 mesocosm-control 0.289 mesocosm-fjord 0.020 Post-nutrient addition
Bacteroidetes fjord-control 0.001 mesocosm-control 0.864 mesocosm-fjord 0.002 Alpha-proteobacteria fjord-control 0.002 mesocosm-control 0.787 mesocosm-fjord 0.006 “Cyanobacteria+euk.chloro” fjord-control 0.000 mesocosm-control 0.839 mesocosm-fjord 0.001
“Others” fjord-control 0.000
BGD
9, 13319–13349, 2012
Ocean acidification impacts on bacterial community structure
A.-S. Roy et al.
Title Page
Abstract Introduction
Conclusions References
Tables Figures
◭ ◮
◭ ◮
Back Close
Full Screen / Esc
Printer-friendly Version Interactive Discussion
Discussion
P
a
per
|
Dis
cussion
P
a
per
|
Discussion
P
a
per
|
Discussio
n
P
a
per
|
Table 4.Bonferroni-corrected g-test of significance (p <0.05) demonstrating which and how
taxa, for both free living and particle associated size fraction, are significantly correlated with CO2; where bold highlights mark the OTUs presented in Fig. 4.
% total
OTU Taxa Abundance sequences General response to elevatedpCO2 p
(20 863 517)
114 612 Methylotenera (genus) 2907 0.014 Highest in middlepCO2 0.000 144 699 Oceanospirillaceae (family) 1182 0.006 Increased withpCO2 0.000
105 727 Methylotenera (genus) 45 915 0.220 Highest in middlepCO2 0.000
151 803 Flavobacteriaceae (family) 1841 0.009 Increased withpCO2 0.000
522 744 Leucothrix (genus) 130 0.001 Decreased withpCO2 0.000
419 525 Sphingobacteriales (order) 171 0.001 Increased withpCO2 0.000 94 238 Oxalobacteraceae (family) 322 0.002 Highest in middlepCO2 0.000
402 252 Fluviicola (genus) 20 950 0.100 Increased withpCO2 0.001
592 739 Oleibacter (genus) 2976 0.014 Highest in middlepCO2/increased 0.001
262 549 HTCC-1288 (genus) 25 0.001 Mixed, highest in high-middlepCO2 0.001 140 859 Flavobacteriumsuccinicans (species) 344 0.0001 Decrease withpCO2 0.004
235 556 Colwellia (genus) 32 153 0.154 Highest in high-middlepCO2 0.008
591 187 Flavobacteria (class) 231 0.001 Decrease withpCO2 0.010
243 032 Thioclava (genus) 59 0.0003 Mixed, highest in highpCO2 0.011
BGD
9, 13319–13349, 2012
Ocean acidification impacts on bacterial community structure
A.-S. Roy et al.
Title Page
Abstract Introduction
Conclusions References
Tables Figures
◭ ◮
◭ ◮
Back Close
Full Screen / Esc
Printer-friendly Version Interactive Discussion
Discussion
P
a
per
|
Dis
cussion
P
a
per
|
Discussion
P
a
per
|
Discussio
n
P
a
per
|
Fig. 1.Chlorophylla(µg l−1
BGD
9, 13319–13349, 2012
Ocean acidification impacts on bacterial community structure
A.-S. Roy et al.
Title Page
Abstract Introduction
Conclusions References
Tables Figures
◭ ◮
◭ ◮
Back Close
Full Screen / Esc
Printer-friendly Version Interactive Discussion
Discussion
P
a
per
|
Dis
cussion
P
a
per
|
Discussion
P
a
per
|
Discussio
n
P
a
per
|
b) a)
Fig. 2. Microbial community overview of the most abundant phyla in (a) the free-living size
BGD
9, 13319–13349, 2012
Ocean acidification impacts on bacterial community structure
A.-S. Roy et al.
Title Page
Abstract Introduction
Conclusions References
Tables Figures
◭ ◮
◭ ◮
Back Close
Full Screen / Esc
Printer-friendly Version Interactive Discussion
Discussion
P
a
per
|
Dis
cussion
P
a
per
|
Discussion
P
a
per
|
Discussio
n
P
a
per
|
b) a)
Fig. 3. Mean abundance (±SE) of the main phyla of the bacterial community for the fjord
BGD
9, 13319–13349, 2012
Ocean acidification impacts on bacterial community structure
A.-S. Roy et al.
Title Page
Abstract Introduction
Conclusions References
Tables Figures
◭ ◮
◭ ◮
Back Close
Full Screen / Esc
Printer-friendly Version Interactive Discussion
Discussion
P
a
per
|
Dis
cussion
P
a
per
|
Discussion
P
a
per
|
Discussio
n
P
a
per
|
a)
b)
c)
Fig. 4. Heat maps presenting the mean abundance count of the three most abondant taxa
that are significantly affected bypCO2 levels(a)Methylotenera (OTU # 105727)(b)Colwellia
(OTU # 235556) and(c)Fluviicola (OTU # 402252) plotted against pCO2(µatm, y-axis) and