ACPD
13, 14927–14975, 2013Long-term observation of cluster ions at Puy de
D ˆome
C. Rose et al.
Title Page
Abstract Introduction
Conclusions References
Tables Figures
◭ ◮
◭ ◮
Back Close
Full Screen / Esc
Printer-friendly Version Interactive Discussion
Discussion
P
a
per
|
Dis
cussion
P
a
per
|
Discussion
P
a
per
|
Discussio
n
P
a
per
|
Atmos. Chem. Phys. Discuss., 13, 14927–14975, 2013 www.atmos-chem-phys-discuss.net/13/14927/2013/ doi:10.5194/acpd-13-14927-2013
© Author(s) 2013. CC Attribution 3.0 License.
Atmospheric Chemistry and Physics
Open Access
Discussions
Geoscientiic Geoscientiic
Geoscientiic Geoscientiic
This discussion paper is/has been under review for the journal Atmospheric Chemistry and Physics (ACP). Please refer to the corresponding final paper in ACP if available.
Long-term observations of positive
cluster ion concentration, sources and
sinks at the high altitude site of the Puy
de D ˆome
C. Rose1, J. Boulon1, M. Hervo1, H. Holmgren1, E. Asmi2, M. Ramonet3, P. Laj4, and K. Sellegri1
1
Laboratoire de M ´et ´eorologie Physique CNRS, UMR6016, Observatoire de Physique du Globe de Clermont-Ferrand, Universit ´e Blaise Pascal, France
2
Finnish Meteorological Institute, P.O. Box 503, 00101 Helsinki, Finland
3
Laboratoire des Sciences du Climat et de l’Environnement, UMR Commissariat `a l’Energie Atomique/CNRS 1592, Gif-sur-Yvette, France
4
Laboratoire de Glaciologie et G ´eophysique de l’Environnement, CNRS UMR5183, Universit ´e Joseph Fourier Grenoble 1, Saint Martin d’H ´eres, France
Received: 14 May 2013 – Accepted: 20 May 2013 – Published: 5 June 2013 Correspondence to: C. Rose ([email protected])
ACPD
13, 14927–14975, 2013Long-term observation of cluster ions at Puy de
D ˆome
C. Rose et al.
Title Page
Abstract Introduction
Conclusions References
Tables Figures
◭ ◮
◭ ◮
Back Close
Full Screen / Esc
Printer-friendly Version Interactive Discussion
Discussion
P
a
per
|
Dis
cussion
P
a
per
|
Discussion
P
a
per
|
Discussio
n
P
a
per
Abstract
Cluster particles (0.8–1.9 nm) are key entities involved in nucleation and new particle formation processes in the atmosphere. Cluster ions were characterized in clear sky conditions at the Puy de D ˆome station (1465 m a.s.l). The studied dataset spread over five years (February 2007–February 2012), which provided a unique chance to catch
5
seasonal variations of cluster ion properties at high altitude. Statistical values of the cluster ion concentration and diameter are reported for both positive and negative po-larities. Cluster ions were found to be ubiquitous at the Puy de D ˆome and displayed an annual variation with lower concentrations in spring. Positive cluster ions were less numerous than negative ones but were larger in diameters. Negative cluster ion
prop-10
erties seemed insensitive to the occurrence of a new particle formation (NPF) event while positive cluster ions appeared to be significantly more numerous and larger on event days. The parameters of the balance equation for the positive cluster concentra-tion are reported, separately for the different seasons and for the NPF event days and non-event days. The steady state assumption suggests that the ionization rate is
bal-15
anced with two sinks which are the ion recombination and the attachment on aerosol particles, referred as “aerosol ion sink”. The aerosol ion sink was found to be higher during the warm season and dominated the loss of ions. The positive ionization rates derived from the balance equation were well correlated with the ionization rates ob-tained from radon measurement, and they were on average higher in summer and fall
20
compared to winter and spring. Neither the aerosol ion sink nor the ionization rate were found to be significantly different on event days compared to non-event days, and thus they were not able to explain the different positive cluster concentrations between event and non-event days. Hence, the excess of positive small ions on event days may derive from an additional source of ions coupled with the fact that the steady state was not
25
ACPD
13, 14927–14975, 2013Long-term observation of cluster ions at Puy de
D ˆome
C. Rose et al.
Title Page
Abstract Introduction
Conclusions References
Tables Figures
◭ ◮
◭ ◮
Back Close
Full Screen / Esc
Printer-friendly Version Interactive Discussion
Discussion
P
a
per
|
Dis
cussion
P
a
per
|
Discussion
P
a
per
|
Discussio
n
P
a
per
|
1 Introduction
In polluted areas, atmospheric aerosol particles often affect visibility and have unde-sirable effects on human health (Seaton et al., 1995). On a more global scale, aerosol particles influence the Earth’s climate system by scattering and absorbing incoming solar radiation (direct effect) and by affecting several cloud properties (indirect effect).
5
The aerosol indirect effect is still affected by the largest uncertainty among atmospheric radiative forcings (IPCC, 2007). A better understanding of the indirect effect requires in particular more accurate information on secondary aerosol particle sources and thus on the nucleation process. Measurements, as well as recent model investigations, sug-gest that atmospheric nucleation is an important source of aerosol particles and cloud
10
condensation nuclei (Kerminen et al., 2012; Makkonen et al., 2012) but the very first steps of the nucleation process remain uncertain. Indeed, the formation and growth of ultrafine aerosol particles in the atmosphere has been studied during the last decades in various locations (see Kulmala et al., 2004 for a review) but the mechanisms involved in the particle formation are still unclear, mostly because of instrumental limitations.
15
Much effort has been made during the last years to develop instruments able to de-tect freshly nucleated neutral particles down to 1 nm sizes. Since electrical methods used in the NAIS (Neutral Air Ion Spectrometer) cannot ensure reliable concentrations for neutral particles smaller than∼1.6–1.7 nm because of the post-filtering process of corona-generated ions (Asmi et al., 2009; Manninen et al., 2011), condensation
parti-20
cle counting methods have been more deeply investigated, especially with the Particle Size Magnifier (PSM) (see for example Kim et al., 2003; Vanhanen et al., 2011; Kuang et al., 2012). However, in their recent paper, Kangasluoma et al. (2013) have shown that in the case of the PSM, measurements were greatly dependent on both the rela-tive humidity and the chemical composition of the sampled particles. In that case, data
25
ACPD
13, 14927–14975, 2013Long-term observation of cluster ions at Puy de
D ˆome
C. Rose et al.
Title Page
Abstract Introduction
Conclusions References
Tables Figures
◭ ◮
◭ ◮
Back Close
Full Screen / Esc
Printer-friendly Version Interactive Discussion
Discussion
P
a
per
|
Dis
cussion
P
a
per
|
Discussion
P
a
per
|
Discussio
n
P
a
per
with mobilities up to 3.162 cm2V−1s−1 in NTP conditions, corresponding to a particle Milikan diameter of 0.8 nm).
The “cluster ions” or “small ions” are the ions with a mobility diameter greater than 0.5 cm2V−1s−1(roughly corresponding to particle Milikan diameters smaller than 1.9 nm). Thus, they are the most relevant for new particle formation studies.
Atmo-5
spheric cluster ions are produced by external radiation, such as gamma radiation and galactic cosmic rays (GCR), and by airborne radionuclides, mainly radon and thoron. Above the ocean, GCR are the principal source for cluster ions (Hensen and Van der Hage, 1994) while in continental areas, the variation of the small ion production is mainly driven by the variation of the radon and thoron concentrations (Laakso et al.,
10
2004). The ionization rate have already been deeply studied during the last century and overviews of the earliest results can be found in Chalmers (1967) and Isra ¨el (1970). The ionization rate strongly depends on the measurement site since it is affected by diff er-ent factors such as the conter-ent of radioactive matter in the ground, the soil properties, the snow cover and the orography. Also the altitude was shown to have an influence on
15
the ionization rate (Rosen et al., 1985). Ions are believed to be involved in nucleation processes, through the ion induced nucleation mechanism (Laakso et al., 2002; Love-joy et al., 2004; Luts et al., 2006; Nieminen et al., 2011). For the ion induced nucleation mechanism, the maximum of the nucleation rate was previously found to correspond to the ionization rate (Yu and Turco, 2000). The ionization rate can be obtained from direct
20
measurements or it can be derived from calculations based on the balance equation for the concentration of small ions (Isra ¨el, 1970). Small ion properties including ionization rate have been discussed in various environments (H ˜orrak et al., 2003, 2008; Vana et al., 2008; Yli-Juuti et al., 2009). As an example, the small ion population was shown to be very sensitive to the presence of clouds at altitude sites (Lihavainen et al., 2007;
25
ACPD
13, 14927–14975, 2013Long-term observation of cluster ions at Puy de
D ˆome
C. Rose et al.
Title Page
Abstract Introduction
Conclusions References
Tables Figures
◭ ◮
◭ ◮
Back Close
Full Screen / Esc
Printer-friendly Version Interactive Discussion
Discussion
P
a
per
|
Dis
cussion
P
a
per
|
Discussion
P
a
per
|
Discussio
n
P
a
per
|
edge, the analysis proposed in this paper is the first one based on such an extended dataset for the small ion properties.
We report seasonal and diurnal variability of cluster ion concentration and size mea-sured over a five-year period (February 2007–February 2012) in clear sky conditions at the Puy de D ˆome station (corresponding to 857 days). Cluster ions were measured
5
with an Air Ion Sprectrometer (AIS) which allows ion detection in the range 0.0013– 3.2 cm2V−1s−1, corresponding to particle diameter between 0.8 and 42 nm. The be-haviour of positive cluster ions is specially investigated, with the goal of identifying the sinks and sources responsible for the reported positive cluster ion concentrations, with a special focus on the differences observed between new particle formation event days
10
and non-event days.
2 Measurements and methods
2.1 Measurement site
Measurements were conducted at the Puy de D ˆome (PDD) site in central France (45◦46′N, 2◦57′E). The station is located at 1465 m a.s.l. in an environment mainly
15
characterized by fields and forest. The nearest city, Clermont-Ferrand (300 000 inhab-itants), is located 16 km East of the mountain. A more complete description of the station can be found in Asmi et al. (2011); Freney et al. (2011).
2.2 The Air Ion Spectrometer (AIS)
The ion size distributions were measured with an AIS (Airel Ltd., Mirme et al., 2007)
20
which allows ion detection in the mobility range 0.0013–3.2 cm2V−1s−1, corresponding to particle Milikan diameter 0.8–42 nm. The instrument was on the roof of the station and was operating behind an individual non-heated short inlet (30 cm), meaning that measured ion size distributions were directly influenced by the presence of a cloud. The AIS has two identical cylindrical Differential Mobility Analyzers (DMA) for the
ACPD
13, 14927–14975, 2013Long-term observation of cluster ions at Puy de
D ˆome
C. Rose et al.
Title Page
Abstract Introduction
Conclusions References
Tables Figures
◭ ◮
◭ ◮
Back Close
Full Screen / Esc
Printer-friendly Version Interactive Discussion
Discussion
P
a
per
|
Dis
cussion
P
a
per
|
Discussion
P
a
per
|
Discussio
n
P
a
per
neous measurement of positive and negative ions. Each analyser has a sample flow rate of 30 L min−1
and a sheath flow rate of 60 L min−1
. Such high flow rates are used to avoid diffusion losses and ensure significant signal to noise ratio, even when ion concentrations are low. The inner cylinder of each analyser is divided into four isolated parts which keep a constant voltage during a measurement cycle. The outer cylinder is
5
divided into 21 isolated rings connected to 21 electrometers. Naturally charged parti-cles are moved by a radial electric field from the inner cylinder of the DMA to the outer cylinder. The current carried by the ions is further amplified and measured with elec-trometers. Each measurement cycle is followed by an offset measurement during which particles in the sample air are charged by a unipolar corona charger and electrically
10
filtered.
2.3 Auxiliary measurements
In addition to the AIS size distributions, auxiliary measurements were used for the present study. Routine meteorological parameters such as wind speed and direc-tion, temperature, pressure and relative humidity are continuously recorded at the
sta-15
tion. The aerosol particle number size distributions (10–420 nm) were measured with a Scanning Mobility Particle Sizer (SMPS). The hygroscopic properties of the aerosol particles were obtained from a Hygroscopic Tandem Differential Mobility Analyser (HT-DMA). The SMPS and the HTDMA are both custom built instruments and were oper-ating behind a Whole Air Inlet (WAI) with a cut-offsize of 30 µm. More detailed
expla-20
nations on the SMPS and the inlet system can be found in Venzac et al. (2009) and complementary information on the HTDMA is available in Duplissy et al. (2009). Radon (222Rn) concentrations were determined from measurements of its short-lived daugh-ters produced by disintegration. At the PDD the 222Rn was measured with the active deposit method which is fully described in Biraud et al. (2000). Cloudiness conditions
25
ACPD
13, 14927–14975, 2013Long-term observation of cluster ions at Puy de
D ˆome
C. Rose et al.
Title Page
Abstract Introduction
Conclusions References
Tables Figures
◭ ◮
◭ ◮
Back Close
Full Screen / Esc
Printer-friendly Version Interactive Discussion
Discussion
P
a
per
|
Dis
cussion
P
a
per
|
Discussion
P
a
per
|
Discussio
n
P
a
per
|
2.4 Data analysis
2.4.1 The simplified balance equation for small ions
The initial balance equation for the small ions concentration originates from (Isra ¨el, 1970):
dn±
dt =Q±−αn±n∓−n±
Z
dp ∞
X
q=−∞
β±(dp,q)N(dp,q)ddp (1)
5
whereQ± is the positive or negative ion production rate,n± is the concentration of
pos-itive or negative small ions,α is the ion-ion recombination coefficient,β±(dp,q) is the
small ion-aerosol particle attachment coefficient,qis the charge of the aerosol particle and N(dp,q) is the concentration of aerosol particles. Equation (1) can be simplified
under the assumption of (1) small ions in a bipolar environment, (2) equal
concen-10
trations of negative and positive small ions and (3) symmetrical charging of aerosol particles. The resulting simplified balance equation for cluster ions concentration is given by Hoppel et al. (1986):
dn
dt =Q−αn
2−β
effNtotn (2)
wheren is the cluster ions concentration, βeff is the effective ion-particle attachment
15
coefficient andNtotis the total aerosol particle concentration. Two processes
responsi-ble for the loss of small ions are taken into account in Eq. (2). The first one is the ion recombination (αn) while the second one represents the adsorption of small ions on aerosol particles (βeffNtot) and will be referred as “aerosol ion sink” (Sa) in the following
sections. The calculation of the ion recombination sink was done using the common
20
ACPD
13, 14927–14975, 2013Long-term observation of cluster ions at Puy de
D ˆome
C. Rose et al.
Title Page
Abstract Introduction
Conclusions References
Tables Figures
◭ ◮
◭ ◮
Back Close
Full Screen / Esc
Printer-friendly Version Interactive Discussion
Discussion
P
a
per
|
Dis
cussion
P
a
per
|
Discussion
P
a
per
|
Discussio
n
P
a
per
equation for small ions. In the case of steady state, the ionization rate can be derived from Eq. (2):
Q=αn2+βeffNtotn (3)
The aerosol ion sink was calculated using a simple approximation function from Tam-met (1991) and further improved by H ˜orrak et al. (2008) for the single size ion-aerosol
5
attachment coefficientw(dp):
Sa=βeffNtot=
Z
dp
w(dp)N(dp)ddp=
Z
dp
s
dp−1 nm
dp+5 nm
dp
40 nm10
−6N
(dp)ddp (4)
where the aerosol particle diameterdpis given in nanometers. In this study, the aerosol
ion sink was calculated by using exclusively the SMPS aerosol size distribution (10– 420 nm) since the contribution of larger particles to the ion sink was shown to be weak
10
(H ˜orrak et al., 2008).
2.4.2 Nucleation events classification
The classification of event days was achieved visually using the contour plot of the positive and negative ion size distributions. Data were first separated into three main groups: undefined, non-event and nucleation event days. A closer analysis suggested
15
by Hirsikko et al. (2005) was then performed to classify event days into different classes (Ia, Ib, II and Bump) according to their applicability to a growth rate and a nucleation rate analysis:
– Ia: a continuous growth is observed from the cluster size (0.5 nm) up to particles larger than 20 nm;
20
ACPD
13, 14927–14975, 2013Long-term observation of cluster ions at Puy de
D ˆome
C. Rose et al.
Title Page
Abstract Introduction
Conclusions References
Tables Figures
◭ ◮
◭ ◮
Back Close
Full Screen / Esc
Printer-friendly Version Interactive Discussion
Discussion
P
a
per
|
Dis
cussion
P
a
per
|
Discussion
P
a
per
|
Discussio
n
P
a
per
|
– II: an event is clearly detected but the growth is definitely not regular and the shape of the size distribution is unclear. Further analysis of the event characteristics is complicated or impossible;
– Bump: a burst of clusters is visible but it is not followed by a significant growth and particle formation process.
5
3 Results and discussion
3.1 New particle formation event statistics
The purpose of this section is only to discuss new particle formation (NPF) event fre-quency and type at the PDD station to further examine the behaviour of cluster ions on event and non-event days in the next sections. Formation and growth rates analysis
10
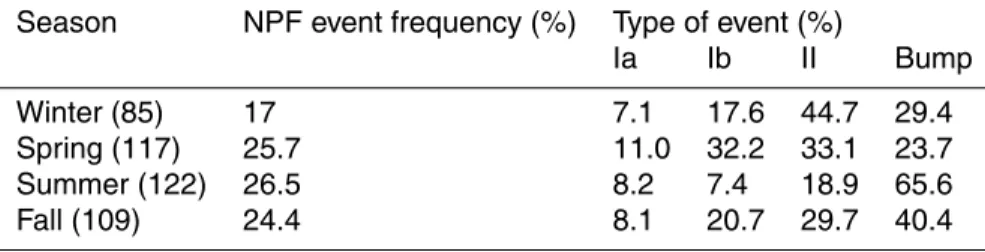
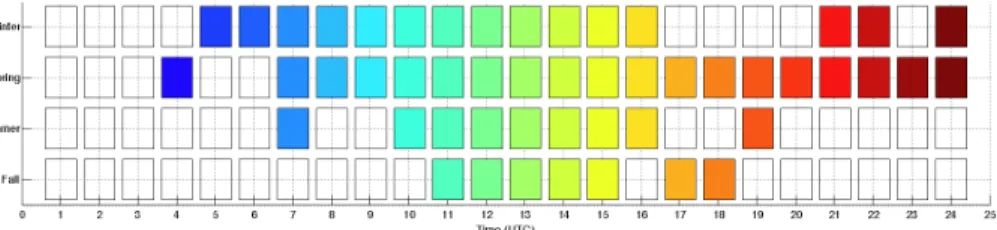
are beyond the scope of this paper and were performed in Boulon et al. (2011). The monthly mean NPF event frequency at the Puy de D ˆome is presented in Fig. 1, considering the whole initial dataset (in-cloud measurements will be excluded in the next sections). The average NPF event frequency was around 24.5 %, which is some-what smaller than previously reported (30.8 %) in the studies by Boulon et al. (2011)
15
or Venzac et al. (2007), performed on shorter time periods. In the present study, it was possible to distinguish three maxima with frequencies equal or greater than 30 % (one in late winter/early spring, one in summer and one in late fall); in the previous work from Boulon et al. (2011), the same pattern was observed but the maxima were slightly higher (around 40 %) and they were obtained earlier in summer and fall. Despite the
20
fact that the influence of the event classification on cluster ion properties will not be deeply discussed later in this study, the frequency of each class is given according to the season as additional information in Table 1. Considering all the seasons, Ia events are rare since they represent on average only 10 % (7.1–11 %) of all events. In winter and spring, class II events are dominating with 44.7 and 33.1 % respectively while in
25
ACPD
13, 14927–14975, 2013Long-term observation of cluster ions at Puy de
D ˆome
C. Rose et al.
Title Page
Abstract Introduction
Conclusions References
Tables Figures
◭ ◮
◭ ◮
Back Close
Full Screen / Esc
Printer-friendly Version Interactive Discussion
Discussion
P
a
per
|
Dis
cussion
P
a
per
|
Discussion
P
a
per
|
Discussio
n
P
a
per
At altitude stations such as the Puy de D ˆome, air masses might not be homogeneous over the whole diurnal cycle, as they are influenced alternatively by boundary layer (BL) air masses and free tropospheric air masses. Moreover, the presence of clouds is frequent at the station, eventually interrupting the NPF growth process. Hence, the NPF event growth is likely to be less regular than at BL stations.
5
The influence of several atmospheric parameters as well as air mass back trajec-tories on NPF event characteristics at the Puy de D ˆome was previously studied by Boulon et al. (2011). Only the relative humidity, the ozone concentration and the con-densation sink showed significant differences between NPF and no NPF event days, being lower on event days. The link between the occurrence of NPF events and cluster
10
ion properties will be discussed in the following sections.
3.2 Cluster ion concentration and size
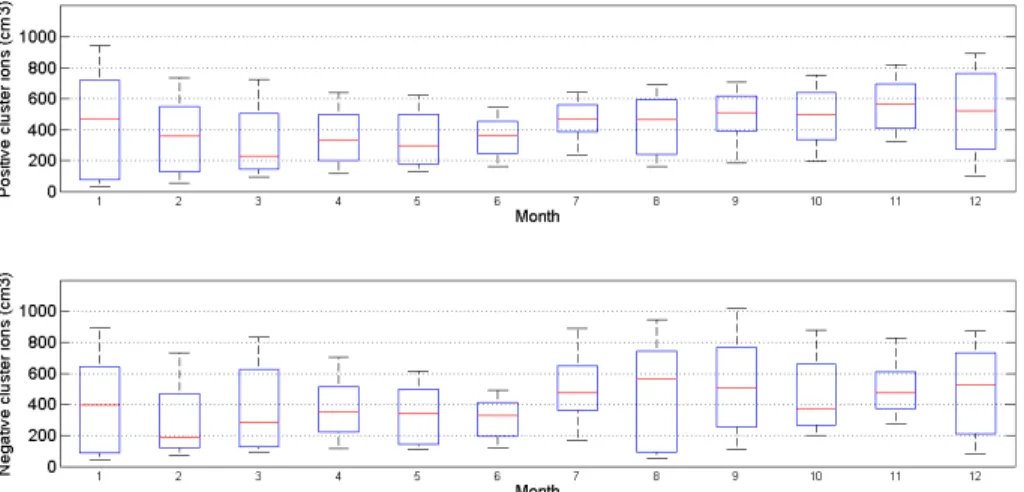
Figure 2 shows the annual variation of the median concentration of the positive (upper panel) and negative (bottom panel) cluster ions obtained after filtering the cloudy con-ditions out. Based on the five years measurement period, both positive and negative
15
cluster ions are always present at the Puy de D ˆome and their monthly-median concen-trations display similar annual trends with lower values in late winter – early spring. Negative ion concentrations are on average slightly higher than positive ones and they also spread over a larger range of values, but considering the two polarities the monthly-median concentrations typically vary between 200 and 600 cm−3. For positive
20
ions, the highest monthly-median concentration is 569 cm−3in November whereas the lowest is in March (229 cm−3). For negative ions the highest concentration is 566 cm−3 in August while the lowest is 189 cm−3in February. These values are in agreement with the previous study made by Venzac et al. (2007).
Cluster ions appear to be ubiquitous in the atmosphere, and this observation is not
25
ACPD
13, 14927–14975, 2013Long-term observation of cluster ions at Puy de
D ˆome
C. Rose et al.
Title Page
Abstract Introduction
Conclusions References
Tables Figures
◭ ◮
◭ ◮
Back Close
Full Screen / Esc
Printer-friendly Version Interactive Discussion
Discussion
P
a
per
|
Dis
cussion
P
a
per
|
Discussion
P
a
per
|
Discussio
n
P
a
per
|
et al., 2009). The annual variation of the cluster ion concentration at the Puy de D ˆome is similar to the annual variation of positive cluster ions described by Boulon et al. (2010) at the high altitude station of Jungfraujoch but it differs from the annual variation ob-served in Hyyti ¨al ¨a, Finland, which displays two maxima in August and October, and two minima in February and July (Hirsikko et al., 2005). Moreover, cluster ion
concentra-5
tions recorded at the Puy de D ˆome are in general slightly lower than the concentrations measured in Hyyti ¨al ¨a (200–1500 cm−3for both polarities). However, spring cluster ion concentrations from the Puy de D ˆome are comparable to the concentrations reported by Komppula et al. (2007) for the coastal station of Ut ¨o, Finland (250±110 cm−3 for positive ions, 280±120 cm−3for negative ions).
10
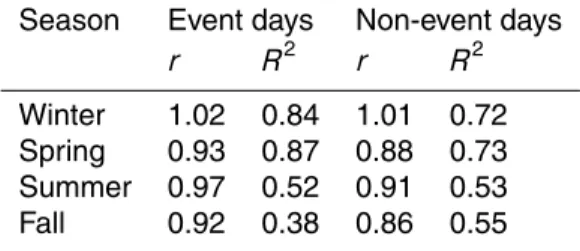
We further investigated the cluster ion concentrations, separately for the different seasons. The entire dataset includes the equivalent of 800 available days of measure-ment in clear sky conditions which are distributed over the seasons as follow: 181 days in winter, 191 in spring, 239 in summer and 189 in fall. Furthermore, days were classi-fied as “event day” or “non-event day” according to the detection of a NPF event or not
15
and were analysed independently. Table 2 presents the ratio of the positive ion concen-tration to the negative ion concenconcen-tration and the correlation between the concenconcen-trations of the two polarities. The concentrations of positive and negative cluster ions are rela-tively closely correlated and the correlation is in general better on event days with cor-relation coefficients ranging between 0.38 and 0.87 in different seasons. However, the
20
correlation is not as strong as the correlation of 93.6 % reported by H ˜orrak et al. (2008) in Hyyti ¨al ¨a. It can also be seen from Table 2 that negative ion concentrations are in general higher than positive ones, with the exception of winter season. It is worth to notice that this difference is smaller on event days which display ratios of positive to negative cluster ion concentrations higher than 0.90 in all seasons. This last
obser-25
ACPD
13, 14927–14975, 2013Long-term observation of cluster ions at Puy de
D ˆome
C. Rose et al.
Title Page
Abstract Introduction
Conclusions References
Tables Figures
◭ ◮
◭ ◮
Back Close
Full Screen / Esc
Printer-friendly Version Interactive Discussion
Discussion
P
a
per
|
Dis
cussion
P
a
per
|
Discussion
P
a
per
|
Discussio
n
P
a
per
Ut ¨o (Komppula et al., 2007) while in Thakuse, Estonia, both Komppula et al. (2007) and H ˜orrak et al. (2003) reported that positive ions were predominant.
Figure 3 shows the diurnal variation of the positive ion concentration for the different seasons and separately for event and non-event days. No distinct diurnal variation is observed for none of the seasons on non-event days. However, on event days, positive
5
cluster ion concentration displays a maximum around 12:00 UTC time (−1 h local winter time) and on average the concentrations appear to be slightly higher compared to non-event days. For negative cluster ions (figure not shown) it is hard to distinguish any clear diurnal variation of the concentration, both on event and non-event days. The major difference between event and non-event days can be seen in winter and spring,
10
which exhibit higher positive cluster ion concentrations during the whole day. In spring, the concentrations are raised by a factor in the range 1.10–1.47 on event days and in winter the increase is even more pronounced with factors in the range 1.51–2.86. In order to verify these last statements, the differences in cluster ion concentrations recorded on event and non-event days were tested with the Mann–Whitney U test.
15
Figure 4 shows that for positive ion concentrations, the null hypothesis of samples with different medians cannot be rejected at the threshold of 5 %, at least during the time period 10:00–16:00 UTC for all the seasons. This means that on event days positive cluster ion concentrations are significantly higher than on non-event days. This is the case during almost the whole day in winter and spring and on a more restricted time
20
period in summer and fall. The last observation can be related to the fact that bump type events are predominant in summer and fall. Indeed, it appears that in case of bump type events, for all seasons, the positive cluster ions concentration displays clear differences on a well-defined and restricted period during the day compared to non-event days. The most significant differences between event and non-event days are in
25
ACPD
13, 14927–14975, 2013Long-term observation of cluster ions at Puy de
D ˆome
C. Rose et al.
Title Page
Abstract Introduction
Conclusions References
Tables Figures
◭ ◮
◭ ◮
Back Close
Full Screen / Esc
Printer-friendly Version Interactive Discussion
Discussion
P
a
per
|
Dis
cussion
P
a
per
|
Discussion
P
a
per
|
Discussio
n
P
a
per
|
days. For the negative ions, theU test confirms that the concentrations between event and non-event days are significantly different only in winter and spring.
Several articles have already reported higher positive cluster ions concentrations on event days but none of them mentioned the use of a statistical test to confirm their observation. Boulon and co-workers (2010) found that positive ion concentrations
in-5
creased on average by a factor of 1.5 on event days between 09:00 and 12:00 Local Time (LT) at the Jungfraujoch (JFJ) station. H ˜orrak et al. (2008) measured averaged positive ion concentrations of 530 cm−3on NPF event days against 424 cm−3on non-event days in Hyyti ¨al ¨a in spring. The diurnal variation of the positive cluster ion concen-tration with a stable minimum at night and a maximum around noon observed at the Puy
10
de D ˆome seems to be representative of high altitude sites (Boulon et al., 2010) but is clearly different from the diurnal variation observed in BL sites. In Tahkuse, the positive cluster ion concentration displayed a maximum in the early morning (06:00–07:00 LT) and a minimum around 18:00 LT (H ˜orrak et al., 2003); moreover, this diurnal variation was more evident during the warm season, between April and September. The same
15
pattern for the diurnal variation of the cluster ion concentration with a maximum during night time was reported for Hyyti ¨al ¨a (H ˜orrak et al., 2008) and K-Puszta, Hungary, in late spring (Yli-Juuti et al., 2009). For these three BL stations, radon seems to be a major source for cluster ions. Thus radon accumulation during night calms (weak winds, sta-ble nocturnal layer) can explain higher cluster ion concentrations compared to day time
20
which favours radon dilution in the mixing layer. On the contrary, at high altitude sites, the influence of surface emissions (including radon) is higher during day time when the BL reaches the station or when katabatic winds bring valley breezes to the station (Boulon et al., 2010). For the studies which focused on both positive and negative ions, the authors did not mention significant differences between the diurnal variations of the
25
ACPD
13, 14927–14975, 2013Long-term observation of cluster ions at Puy de
D ˆome
C. Rose et al.
Title Page
Abstract Introduction
Conclusions References
Tables Figures
◭ ◮
◭ ◮
Back Close
Full Screen / Esc
Printer-friendly Version Interactive Discussion
Discussion
P
a
per
|
Dis
cussion
P
a
per
|
Discussion
P
a
per
|
Discussio
n
P
a
per
In order to study the evolution of the small ion diameter, a log-normal distribution was fitted to the hourly median cluster ion size distributions to obtain the representa-tive diameter of the mode. This diameter corresponds to the location parameter of the log-normal distribution (usually referred as “µ” in the literature). In the following, the representative diameter of the cluster mode will be referred asd+ andd− for positive
5
and negative ions respectively. An illustration of the fitting process for the determination ofd+ is given in Fig. 5. Negative ions appeared to be significantly smaller than positive ones asd+ was typically fluctuating in the range 1.2–1.3 nm whiled− was in the range
0.9–1.1 nm. Figure 6 shows the diurnal variation ofd+ separately for the different sea-sons and for event and non-event days (figure not shown ford−). For positive ions, no
10
major difference can be seen between the different seasons whereas for negative ones the diameters are smaller in winter and spring, especially on non-event days. On event days, the diurnal variation ofd+ shows a maximum around noon which is not detected on non-event days; as a consequence, the diameter of the cluster mode is significantly larger around noon on event days (Figs. 6 and 7) compared to non-event days. For
15
negative ions, no diurnal variation of the median diameters can be seen except on event days in summer with a significant maximum around noon which displays median values increased by a factor of 1.09 compared to hourly morning median values. The result of the U test applied on negative ion diameters shows that these differences between event and non-event days are statistically confirmed in summer. TheU test
20
also exhibits some differences in winter and spring. However, especially in winter, the differences are only observed on very short time period during the day and they do not match well with the time period during which the NPF process takes place. Thus this observation suggests the link between the NPF process and the increase of the negative ion size is weak, whereas it appears to be potentially stronger in the case of
25
ACPD
13, 14927–14975, 2013Long-term observation of cluster ions at Puy de
D ˆome
C. Rose et al.
Title Page
Abstract Introduction
Conclusions References
Tables Figures
◭ ◮
◭ ◮
Back Close
Full Screen / Esc
Printer-friendly Version Interactive Discussion
Discussion
P
a
per
|
Dis
cussion
P
a
per
|
Discussion
P
a
per
|
Discussio
n
P
a
per
|
The diurnal variation with higher median diameters for positive ions on event days has also been reported by Boulon et al. (2010) at the JFJ station. In order to compare the diameters of the cluster ion mode obtained at the Puy de D ˆome with diameters from other stations, we calculated the mean value of the cluster mode diameter con-sidering all the seasons together and we converted it into mobility. The mean diameters
5
of the positive cluster ion mode are 1.219±0.117 nm and 1.192±0.138 nm on event and non-event days, respectively. The corresponding mobilities (calculated atT =283 K andP =860 hPa) are in the range 1.325–1.950 cm2V−1s−1on event days and 1.335– 2.130 cm2V−1s−1 on non-event days. These mobility values are slightly higher than the values reported by Vana et al. (2008) in Mace Head (1.49± 0.14 cm2V−1s−1) or
10
by H ˜orrak et al. (2003) in Tahkuse (1.36±0.06 cm2V−1s−1), but they are very similar to the values obtained by Manninen et al. (2009) in Hyyti ¨al ¨a (1.1–1.3 nm). Concern-ing the negative polarity, the mean diameters of the cluster ion mode are 0.973 ± 0.138 nm and 0.952±0.087 nm on event and non-event days, respectively. The corre-sponding mobilities are in the range 2.111–3.080 cm2V−1s−1on event days and 2.192–
15
3.165 cm2V−1s−1on non-event days. Once again, these values are slightly higher than the value of 1.86±0.21 cm2V−1s−1 reported for Mace Head and they also differ from the values reported for Hyyti ¨al ¨a, negative ions being on average smaller at the Puy de D ˆome.
We have demonstrated so far that positive and negative cluster ions showed different
20
behaviours, both in term of concentration and size. Particularly, we have shown that positive cluster ions appeared to be more likely concerned by the NPF process. Hence, we will now focus exclusively on positive cluster ions for the end of the present study.
First, since event days are characterized by an increase of both the positive clus-ter ion concentration and mode diameclus-ter, we shall investigate if the increase of the
25
ACPD
13, 14927–14975, 2013Long-term observation of cluster ions at Puy de
D ˆome
C. Rose et al.
Title Page
Abstract Introduction
Conclusions References
Tables Figures
◭ ◮
◭ ◮
Back Close
Full Screen / Esc
Printer-friendly Version Interactive Discussion
Discussion
P
a
per
|
Dis
cussion
P
a
per
|
Discussion
P
a
per
|
Discussio
n
P
a
per
hourly median cluster ion mode size distribution at 06:00, 12:00 and 18:00 UTC on event and non-event days. The critical size range to study in order to reject the pos-sibility of an artificial increase of the cluster ion concentration due to the sizing limit of the AIS is in the left most part of the size distribution. The small ion concentration corresponding to the diameter 0.82 nm does not show any important diurnal variation
5
on event days compared to non-event days: for this size class, the most significant change is observed on event days in winter when the hourly median small ion con-centration rises from 6.18 cm−3at 06:00 to 7.99 cm−3at 12:00 UTC. Even in this case, the increase is far too weak to explain the global rise of the cluster ion concentration on event days. Thus, an artificial increase of the cluster ion concentration due to sizing
10
limit of the instrument can be rejected. Most of the modifications on the size distribution are observed for ions larger than 1.26 nm. On event days during the time period 06:00– 12:00 UTC the concentration of small ions in the size range 1.26–1.94 nm is raised by a factor between 1.14 in spring and 1.36 in winter. For the same size range, ion con-centrations are decreased by factors in the range 1.13 (spring)–1.53 (winter) between
15
12:00 and 18:00 UTC and the resulting size distribution is very similar to the size dis-tribution at 06:00 UTC. These observations suggest that both formation and growth of positive cluster ions do occur during the nucleation process on event days in the morn-ing; a large fraction of these clusters is then lost later in the afternoon (the effect of different sinks will be discussed in the next section). At the JFJ station, (Boulon et al.,
20
ACPD
13, 14927–14975, 2013Long-term observation of cluster ions at Puy de
D ˆome
C. Rose et al.
Title Page
Abstract Introduction
Conclusions References
Tables Figures
◭ ◮
◭ ◮
Back Close
Full Screen / Esc
Printer-friendly Version Interactive Discussion
Discussion
P
a
per
|
Dis
cussion
P
a
per
|
Discussion
P
a
per
|
Discussio
n
P
a
per
|
3.3 Positive cluster ion loss and production
3.3.1 Dry and wet aerosol ion sink
The aerosol ion sink was first estimated by using the dry diameters of the SMPS size distribution. For each season, Fig. 9 represents the median diurnal variation of the dry aerosol ion sink (Sadry) on the left plot and hourly median size distribution of the aerosol
5
ion sink at 06:00, 12:00 and 18:00 UTC on the right plot. The lowest dry aerosol ion sinks are in the range 1.19×10⁻³–3.75×10⁻³s−1in winter while the highest are in the range 4.62×10⁻³–8.87×10⁻³s−1 in spring. In winter and fall, the dry sink shows the same diurnal pattern, being almost constant until 12:00 UTC with comparable values on event and non-event days. The diurnal variation of the dry sink displays a maximum
10
around 15:00 UTC on non-event days and later at 17:00–18:00 UTC on event days. During the afternoon, the sink is increased by a factor of 1.93, both on event and non-event days in fall while in winter the increase is even more important on non-event days (factor of 3.16 on event days against 1.68 on non-event days). Concerning spring and summer, the sink seems to be higher on non-event days but this observation will be
15
discussed in the following section using the U test. The diurnal variation of the dry sink shows a minimum around 07:00 UTC and a maximum at 11:00 UTC on non-event days; the maximum is reached later on event days, after 15:00 UTC. The maximum sink value is typically 1.3–1.4 times higher than the minimum value. The most significant difference is on event days in spring with multiplying factors around 1.9.
20
The diurnal variations of the dry aerosol ion sink discussed above are compara-ble to the diurnal variations of the CPC median concentrations reported by Venzac et al. (2009) at the Puy de D ˆome. On event days, the increase of the ion sink dur-ing day-time can mainly be attributed to the NPF process while on non-event days it is more likely the pre-existing aerosol particles contained in the BL reaching the site
25
ACPD
13, 14927–14975, 2013Long-term observation of cluster ions at Puy de
D ˆome
C. Rose et al.
Title Page
Abstract Introduction
Conclusions References
Tables Figures
◭ ◮
◭ ◮
Back Close
Full Screen / Esc
Printer-friendly Version Interactive Discussion
Discussion
P
a
per
|
Dis
cussion
P
a
per
|
Discussion
P
a
per
|
Discussio
n
P
a
per
superimpose well with each other, which signifies that the size distribution of the dry sink does not evolve during day time. Thus the increase of the ion sink is not linked to a growth process of aerosol particles. On the contrary, we can observe that on event days, the ion sink size distribution measured at 18:00 UTC significantly differs from the size distributions measured at 06:00 and 12:00 UTC, especially in winter and fall. The
5
contribution of the largest particles to the sink increases along the day. This suggests that on event days the NPF process mostly influences the sink variations with particle growth.
Since the effect of the hygroscopic growth of aerosol particles has been reported to be significant on aerosol ion sink and further on ionization rate calculations by H ˜orrak
10
and co-workers (2008), we made new calculations of the aerosol sink by calculating wet diameters from the SMPS size distribution. In order to estimate the dependence on ambient relative humidity (RH) of the hygroscopic growth factor (GF) of aerosol particles, we used a parameterization originating from Zhou et al. (2001) and already used in several studies (H ˜orrak et al., 2008; Laakso et al., 2004):
15
GF=dwet
ddry
=
1− RH 100
γ
(5)
The exponentγ is a function of particle size and was parameterized from the particle GF measurements of monodisperse aerosol samples (25, 35, 50, 75, 110, 165 nm) at RH=90 % carried at the Puy de D ˆome during the period October 2008–December 2012. Gamma parameterizations are given for each season in Table 3. The resulting
20
values of the growth factor are shown on Fig. 10 and compared to measurements car-ried at the Puy de D ˆome at different relative humidities (40 %, 60 %, 80 % and 90 %) during the same time period. As one could expect, at RH=90 %, the parameteriza-tion fits well with the measurements. Decreasing the RH, calculaparameteriza-tion and measure-ment do not match so well. Several hypothesis can be proposed to explain this gap:
25
dis-ACPD
13, 14927–14975, 2013Long-term observation of cluster ions at Puy de
D ˆome
C. Rose et al.
Title Page
Abstract Introduction
Conclusions References
Tables Figures
◭ ◮
◭ ◮
Back Close
Full Screen / Esc
Printer-friendly Version Interactive Discussion
Discussion
P
a
per
|
Dis
cussion
P
a
per
|
Discussion
P
a
per
|
Discussio
n
P
a
per
|
rare, so the comparison must be done carefully. For diameters above 300 nm, we ob-tain GF values larger than 2 at RH=90 % in spring and summer, which seems to be slightly overestimated since it is relatively closed to the value of 2.4 reported for pure NaCl at dp=300 nm (H ¨ameri et al., 2001). Because particles larger than 300 nm do
not represent the major fraction of the aerosol ion sink (Fig. 9), we assume that the
5
overestimation of the GF for the largest diameters should not dramatically impact our estimations of the wet aerosol ion sink. Based on Fig. 9, the largest contribution to the ion sink comes from particles in the size range 100–300 nm, for which we obtain GF values between 1.27 and 1.73 at RH=90 %. These values appear to be comparable with the values reported by H ¨ameri et al. (2001) under the assumption of “more
hygro-10
scopic particles”. For RH>90 % the parameterization seems to widely overestimate the GF (Figure not shown); H ˜orrak et al. (2008) also reported that the use of the model was critical for RH>90 %. Thus we decided to exclude all the data points correspond-ing to RH>90 % when taking into account the effect of the hygroscopic growth in the balance equation for small ions.
15
Statistical values of the factors of the small ion balance equation, including the wet aerosol ion sink, are presented in Table 4, separately for the different seasons and for event and non-event days. Considering all the measurements, the median wet aerosol ion sink (Sawet) varies in the range of 2.3×10
−3
–10.2×10⁻³s−1. The lowest values are found during the cold season (winter+fall) and the highest values during the warm
20
season (summer+spring). As mentioned before, the increased boundary layer height during the warm season can explain the high values of the ion sink, at least on non-event days. Based on the median values in Table 4, the wet aerosol ion sink appears to be 1.07 times smaller on event days compared to non-event days, and the difference is more noticeable during the warm season with sinks 1.32 times smaller on event days.
25
ACPD
13, 14927–14975, 2013Long-term observation of cluster ions at Puy de
D ˆome
C. Rose et al.
Title Page
Abstract Introduction
Conclusions References
Tables Figures
◭ ◮
◭ ◮
Back Close
Full Screen / Esc
Printer-friendly Version Interactive Discussion
Discussion
P
a
per
|
Dis
cussion
P
a
per
|
Discussion
P
a
per
|
Discussio
n
P
a
per
expressive differences which are observed in winter are obtained too late in the evening to explain the behaviour of small ion concentration around noon and will not be further considered.
3.3.2 Ionization rate calculation from the balance equation
The values of the positive ionization rate (Q) were derived from Eq. (3) and are
pre-5
sented in Table 4. It should be noticed that instead of assuming equal concentrations for positive and negative ions, we used the measured concentrations for each polarity. Considering all the measurements, the median values of the positive ionization rate are in the range 1.27–3.76 cm−3
s−1
. The lowest values are in winter and spring and the highest values are in summer and fall. Based on the median values presented in
10
Table 4, the ionization rate is higher on event days in fall, spring and especially in sum-mer with a multiplying factor of 1.43. A deeper analysis of the ionization rate with the U test leads to conclude that differences are significant only in summer between 09:00 and 24:00 UTC. The ionization rates at the Puy de D ˆome are on average comparable with the ionization rates reported by Komppula et al. (2007) in Ut ¨o (3 cm−3s−1) and in
15
Tahkuse (2.6 cm−3s−1) in spring or by Laakso et al. (2004) in Hyyti ¨al ¨a (2.63 cm−3s−1), also in spring. However, it seems that large discrepancies can occur between ioniza-tion rates derived from the small ions balance equaioniza-tion and the measured ionizaioniza-tion rates. For example in Hyyti ¨al ¨a, Laakso et al. (2004) reported measured values 1.7 times higher than calculated values for the same period. As a possible explanation, the
20
authors suggested that some sinks were missing in the balance equation. The loss of ions by ion induced nucleation or deposition on vegetation could be part of them.
At the Puy de D ˆome, the sink of small ions is most of the time mainly dominated by the aerosol ions sink but the loss of ions due to ion recombination can represent up to 24 % of the total loss on event days in winter. The values of the recombination
25
ACPD
13, 14927–14975, 2013Long-term observation of cluster ions at Puy de
D ˆome
C. Rose et al.
Title Page
Abstract Introduction
Conclusions References
Tables Figures
◭ ◮
◭ ◮
Back Close
Full Screen / Esc
Printer-friendly Version Interactive Discussion
Discussion
P
a
per
|
Dis
cussion
P
a
per
|
Discussion
P
a
per
|
Discussio
n
P
a
per
|
values are recorded at the same time. These fractions are in agreement with the values reported by Tammet (1991) for continental areas.
As previously mentioned in Sect. 3.3.1, growth factor calculations were made under the assumption that the exponentγ was not dependent on ambient relative humidity. Since measured and calculated GF values did not always match well for RH<90 %,
5
we studied the uncertainty propagation from the gamma parameterization to the calcu-lation of the ion sink and production as a function of humidity (Fig. 11). The sensitivity test is in the form of factors that should multiply the values of the studied parameters when multiplying (blue) or dividing (red)γ values by 2. For the growth factor and the wet aerosol ion sink, the sensitivity is given according to the size of aerosol particles
10
(10 nm, 100–300 nm, 420 nm). All the calculations are detailed in Appendix A. Figure 11 shows that uncertainties increase with ambient relative humidity but the strongest effect comes from the particle size. For the growth factor and the aerosol ion sink, in the size range below 300 nm the multipliers never exceed 1.72 when using maximum gamma or 0.77 when using minimum gamma at RH=95 %. However, for all the seasons except
15
winter, high uncertainties are observed for the largest particles (around 420 nm), even at RH=80 % with multipliers larger than 2 or smaller than 0.6. At RH=95 % for the same size the multipliers are larger than 6 or smaller than 0.4. Even if Fig. 9 shows that the major contribution to the aerosol ion sink does not come from the largest sizes but from the size range 100–300 nm, the high uncertainties obtained for the largest
20
sizes at RH=95 % are an additional support for ignoring data points with RH>90 %. At RH=90 %, the uncertainties reported on Fig. 11 are not fully realistic; since the γparameterization was derived from measurements at RH=90 %, it seems exagger-ated to consider multiplying/dividing factors up to 2 for γ. For both the wet sink and the calculated source at RH<90 % and fordp<300 nm, the multipliers never exceed
25
2 and 0.5. Moreover, we must keep in mind that these uncertainties can be considered as maximum since extreme multiplying factors were applied onγ values.
ACPD
13, 14927–14975, 2013Long-term observation of cluster ions at Puy de
D ˆome
C. Rose et al.
Title Page
Abstract Introduction
Conclusions References
Tables Figures
◭ ◮
◭ ◮
Back Close
Full Screen / Esc
Printer-friendly Version Interactive Discussion
Discussion
P
a
per
|
Dis
cussion
P
a
per
|
Discussion
P
a
per
|
Discussio
n
P
a
per
days but the aerosol ion sink and the ionization rate only show significant differences in summer. At this stage it is thus difficult to link small ion properties to ion sink and production. In order to investigate the relevance of the positive ionization rate values derived from the balance equation, we compared them with ion production rate estima-tions from radon measurements. The results related to these estimaestima-tions are discussed
5
in the following section.
3.3.3 Estimation of the ionization rate based on radon measurements
The main sources for the small ions in the atmosphere are airborne radionuclides (mainly radon, 222Rn) and external radiation (cosmic radiation and gamma radiation from the ground). Since222Rn is continuously monitored at the Puy de D ˆome, it was
10
possible to have an estimation of the contribution of this radionuclide source on the small ion production. The ionization attributable to the 222Rn was derived from the
222
Rn concentration using the decay scheme (three alpha and two beta) and energies from Zhang et al. (2011), assuming that222Rn was in equilibrium with its short lived progeny and that 34 eV were needed for the production of one ion pair. Concerning
15
the cosmic radiation, there was no measurement available at the Puy de D ˆome. Even if cosmic radiation is known to be influenced by solar modulation (with a periodicity of 11 yr) and by latitude modulation (Hensen and Van der Hage, 1994), the use of 2 ion pair cm−3s−1as an average value seemed to be rational at ground level (Hensen and Van der Hage, 1994; Yu, 2002; Usoskin et al., 2004). However, since the pressure at
20
the Puy de D ˆome is around 0.86 bar, the value of 2 ion pair cm−3s−1 was decreased to 1.7 ion pair cm−3s−1. For the gamma radiation, since we had neither measurement nor estimation, we just ignored this contribution on a first approximation, assuming it was not driving the variation of the total ionization rate. The latter approximation was supported by the study by Laakso and co-workers (2004) who showed that the
contri-25
contribu-ACPD
13, 14927–14975, 2013Long-term observation of cluster ions at Puy de
D ˆome
C. Rose et al.
Title Page
Abstract Introduction
Conclusions References
Tables Figures
◭ ◮
◭ ◮
Back Close
Full Screen / Esc
Printer-friendly Version Interactive Discussion
Discussion
P
a
per
|
Dis
cussion
P
a
per
|
Discussion
P
a
per
|
Discussio
n
P
a
per
|
the ionization rate obtained from radon measurement and galactic cosmic rays (GCR) estimation as a function of the time of the day. For all seasons, the measured and the calculated ionization rates are on average in good agreement. In winter and spring the ionization rates derived from the balance equation are slightly smaller than the ioniza-tion rates derived from radon measurements, and the difference appears not to be time
5
dependent. We must keep in mind that this radon and GCR contribution is a priori the lower limit of the real expected measured ionization rate since we ignored the almost constant contribution of gamma radiation. Thus it seems that in winter and spring, both on event and non-event days, we underestimate the ionization rate when using the bal-ance equation. This could be explained either by a misestimating calculated sink or by
10
the fact that the steady state assumption is not valid. In summer and fall the ionization rates derived from the balance equation are typically slightly higher than the ionization rates derived from radon measurements. Moreover, the differences between calculated and measured ionization rates spread over a larger range of values compared to winter and spring but they are still not dependent on the time of the day. Figure 13 shows that
15
the difference between the ionization rates derived from the balance equation (Qcalc)
and the ionization rates obtained from radon measurements (Qmeas is increasing with
temperature, especially in spring and summer. The red dashed lines represent the shift of the zero level of the differenceQcalc−Qmeasif a constant contribution of 1.7 ion pair
cm−3
s−1
from gamma radiation is added to Qmeas. The value of 1.7 ion pair cm −3
s−1
20
was chosen because it seemed to represent on average the gamma contribution to the ionization rate measured at ground level in Hyyti ¨al ¨a (Laakso et al., 2004). It can be seen from Fig. 13 that even with the addition of this constant gamma contribution, the ionization rates derived from the balance equation are most of the time higher than the measured ones in summer and fall. This observation indicates that when
estimat-25
ACPD
13, 14927–14975, 2013Long-term observation of cluster ions at Puy de
D ˆome
C. Rose et al.
Title Page
Abstract Introduction
Conclusions References
Tables Figures
◭ ◮
◭ ◮
Back Close
Full Screen / Esc
Printer-friendly Version Interactive Discussion
Discussion
P
a
per
|
Dis
cussion
P
a
per
|
Discussion
P
a
per
|
Discussio
n
P
a
per
Figure 12 suggests that the fraction of the total ionization rate due to radon does not differ from event to non-event days. The confirmation is given by theU test (figure not shown) for all the seasons except summer. In summer, the radon contribution appears to be significantly different on event days compared to non-event days on the time period 08:00–18:00 (UTC) but a closer look at the radon contribution reveals that it is
5
lower on event days. Thus, since radon concentrations are not increased on event days compared to non-event days, it seems that radon is not the determining source for the excess small ions contributing to nucleation on event days.
We have shown so far that positive cluster ions were more numerous on event days compared to non-event days but neither the sources nor the sinks seem to be able to
10
explain these differences. A possible explanation could however come from an inap-propriate use of the steady state assumption on event days. Indeed, if cluster ions are produced during the NPF process as suggested by this study, this means that on event days the concentration of positive cluster ions is constantly changing in a significant way, meaning that the assumption of steady state can no longer be applied. Thus, it is
15
likely that at the beginning of the NPF process the production of positive cluster ions is faster than the loss of these ions, which leads to higher concentrations compared to non-event days on the same time period.
4 Conclusions
We investigated the behaviour of cluster ions (mobility diameter greater than
20
0.5 cm2V−1s−1) in clear sky conditions at the Puy de D ˆome station. Concentrations were analysed with respect to the season and to the occurrence of a new particle formation event. We used a dataset which spread over five years (February 2007– February 2012), leading to 800 days of measurement.
At the Puy de D ˆome, the nucleation frequency was around 24.5 % and displayed an
25
ACPD
13, 14927–14975, 2013Long-term observation of cluster ions at Puy de
D ˆome
C. Rose et al.
Title Page
Abstract Introduction
Conclusions References
Tables Figures
◭ ◮
◭ ◮
Back Close
Full Screen / Esc
Printer-friendly Version Interactive Discussion
Discussion
P
a
per
|
Dis
cussion
P
a
per
|
Discussion
P
a
per
|
Discussio
n
P
a
per
|
33.1 %, respectively) while bump type events were the most present in summer and fall (65.6 and 40.4 %, respectively).
The monthly medians of the cluster ion concentration were fluctuating typically be-tween 200 and 600 cm−3and presented an annual variation with lower values in spring. Positive small ions were on average less numerous than negative ones. The negative
5
cluster ion concentration did not display any diurnal variation whereas on event days, the positive cluster ion concentration exhibited a maximum around noon. Using the Mann–WhitneyU test, we showed that during the time period 10:00–16:00 UTC, posi-tive cluster ion concentrations were significantly raised by a factor of 1.12–1.76 during event days compared to non-event days on the same time period. The mode diameter
10
of the positive cluster ion mode did not show any clear annual variation, with median typically around 1.2–1.3 nm. On event days, the median diameter of the positive cluster ion mode was found to be increased around noon compared to non-event days for all the seasons. From the size distribution study, we showed that the diameter increase could not explain the rise of positive ion concentration detected by the AIS, and we
15
concluded that both positive ion size and concentrations were significantly modified on event days during the time period of interest for the nucleation process.
The loss of cluster ions on aerosol particle was found to be predominant compared to the ion recombination which on average did not exceed 24 % of the total ion sink. The median aerosol ion sink derived from the wet SMPS size distribution varied in the
20
range 2.310−3–10.210−3s−1 with the highest values during the warm season due to enhanced dynamics of the BL. The median values of the positive ionization rate derived from the balance equation were in the range 1.27–3.76 cm−3s−1with the highest values in summer and fall. The ionization rates derived from the balance equation (Qcalc) were
compared with a direct estimation of the ion source (Qmeas) from 222
Rn measurements
25
and a constant GCR contribution of 1.7 ion pair cm−3s−1. For all seasons,Qcalc and
Qmeas were well correlated but Qcalc was on average higher in summer and fall. The
difference betweenQcalc and Qmeas was shown to be correlated with the temperature,
ACPD
13, 14927–14975, 2013Long-term observation of cluster ions at Puy de
D ˆome
C. Rose et al.
Title Page
Abstract Introduction
Conclusions References
Tables Figures
◭ ◮
◭ ◮
Back Close
Full Screen / Esc
Printer-friendly Version Interactive Discussion
Discussion
P
a
per
|
Dis
cussion
P
a
per
|
Discussion
P
a
per
|
Discussio
n
P
a
per
sources and sinks, we unexpectedly found that theU test could not clearly distinguish event and non-event days, except in summer. But even in summer, we showed that radon could not explain the excess ions on event days.
Our findings demonstrate that positive cluster ions properties such as the concen-tration are significantly different on event and non-event days but neither the sinks nor
5
the sources that we considered are able to explain these differences. It is likely that on event days, at least at the beginning of the NPF process, the steady state of the cluster ion concentration is not verified since the production of cluster ions is faster than the loss of these clusters. Thus it is most likely the imbalance between sources and sinks instead of an extra source which could explain the higher positive cluster ion
10
concentrations at the beginning of the NPF process.
Appendix A
As previously indicated, the sensitivity study related to the use of the gamma parame-terization was done by calculating factors that should multiply the values of the studied
15
parameters when changing the gamma values. The multipliers for the growth factor cor-responded to the ratio of the growth factor using parameterizedγ to the growth factor obtained after multiplying/dividing parameterized gamma values by 2:
GF multipliers=GFmodified
GFinitial =
1−RH
100
γmodified
1−RH
100
ACPD
13, 14927–14975, 2013Long-term observation of cluster ions at Puy de
D ˆome
C. Rose et al.
Title Page
Abstract Introduction
Conclusions References
Tables Figures
◭ ◮
◭ ◮
Back Close
Full Screen / Esc
Printer-friendly Version Interactive Discussion
Discussion
P
a
per
|
Dis
cussion
P
a
per
|
Discussion
P
a
per
|
Discussio
n
P
a
per
|
Then the modified values of the growth factor were used to calculate the aerosol ion sink multipliers:
Sawet multipliers=
Sawetmodified
Sawetinitial
=
r
dp.GFmodified−1 nm dp.GFmodified−5 nm
r
dp.GFinitial−1 nm dp.GFinitial−5 nm
GFmodified
GFinitial
(A2)
The ionization rate multipliers were finally derived from the balance equation, using the modified aerosol ion sink and assuming a constant concentration for positive and
5
negative small ions; this concentration was set to 400 cm−3 since it was almost the average annual concentration observed at the Puy de D ˆome:
Q multipliers=Qmodified
Qinitial
=α.400
2
+400.Sawet
modified
α.4002+400.Sa wetinitial
(A3)
Acknowledgements. This work was performed in the framework of the Research Infrastructure Action under the FP6 Structuring the European Research Area Program, EUSAAR Contract
10
No. RII3-CT-2006-026140, and ACTRIS (Aerosols, Clouds and Trace gases Research Infra Structure Network). It was supported by the LEFE/DFG program within the project “Secondary organic aerosol production in the lower troposphere over western Europe”.
The publication of this article is financed by CNRS-INSU.