ACPD
7, 15619–15650, 2007HCHO intercomparison
A. Wisthaler et al.
Title Page
Abstract Introduction
Conclusions References
Tables Figures
◭ ◮
◭ ◮
Back Close
Full Screen / Esc
Printer-friendly Version
Interactive Discussion
EGU Atmos. Chem. Phys. Discuss., 7, 15619–15650, 2007
www.atmos-chem-phys-discuss.net/7/15619/2007/ © Author(s) 2007. This work is licensed
under a Creative Commons License.
Atmospheric Chemistry and Physics Discussions
Technical Note: Intercomparison of
formaldehyde measurements at the
atmosphere simulation chamber SAPHIR
A. Wisthaler1, E.C. Apel2, J. Bossmeyer3,∗, A. Hansel1, W. Junkermann4, R. Koppmann3,∗∗, R. Meier4, K. M ¨uller5, S. J. Solomon6, R. Steinbrecher4, R. Tillmann3, and T. Brauers3
1
Institut f ¨ur Ionenphysik und Angewandte Physik – Leopold-Franzens-Universit ¨at Innsbruck (IAP-LFUI), Innsbruck, Austria
2
Atmospheric Chemistry Division, National Center for Atmospheric Research (NCAR), Boulder, USA
3
Institut f ¨ur Chemie und Dynamik der Geosph ¨are, ICG-II: Troposph ¨are, Forschungszentrum J ¨ulich, Germany
4
ACPD
7, 15619–15650, 2007HCHO intercomparison
A. Wisthaler et al.
Title Page
Abstract Introduction
Conclusions References
Tables Figures
◭ ◮
◭ ◮
Back Close
Full Screen / Esc
Printer-friendly Version
Interactive Discussion
EGU
5
Leibniz-Institut f ¨ur Troposph ¨arenforschung (ift), Leipzig, Germany
6
Institut f ¨ur Umweltphysik – Universit ¨at Bremen (iup-UB), Bremen, Germany
∗now at: Cohausz & Florack, D ¨usseldorf, Germany
∗∗now at: Fachbereich C – Atmosph ¨arenphysik, Bergische Universit ¨at Wuppertal, Wuppertal,
Germany
Received: 20 September 2007 – Accepted: 19 October 2007 – Published: 6 November 2007
ACPD
7, 15619–15650, 2007HCHO intercomparison
A. Wisthaler et al.
Title Page
Abstract Introduction
Conclusions References
Tables Figures
◭ ◮
◭ ◮
Back Close
Full Screen / Esc
Printer-friendly Version
Interactive Discussion
EGU
Abstract
The atmosphere simulation chamber SAPHIR at the Research Centre J ¨ulich was used to test the suitability of state-of-the-art analytical instruments for the measurement of gas-phase formaldehyde (HCHO) in air. Five analyzers based on four different sensing principles were deployed: a differential optical absorption spectrometer (DOAS), car-5
tridges for 2,4-dinitrophenylhydrazine (DNPH) derivatization followed by off-line high pressure liquid chromatography (HPLC) analysis, two different types of commercially available wet chemical sensors based on Hantzsch fluorimetry, and a proton-transfer-reaction mass spectrometer (PTR-MS). A new optimized mode of operation was used for the PTR-MS instrument which significantly enhanced its performance for on-line 10
HCHO detection at low absolute humidities.
The instruments were challenged with typical ambient levels of HCHO ranging from zero to several ppb. Synthetic air of high purity and particulate-filtered ambient air were used as sample matrices in the atmosphere simulation chamber onto which HCHO was spiked under varying levels of humidity and ozone. Measurements were compared to 15
mixing ratios calculated from the chamber volume and the known amount of HCHO injected into the chamber; measurements were also compared between the different instruments. The formal and blind intercomparison exercise was conducted under the control of an independent referee. A number of analytical problems associated with the experimental set-up and with individual instruments were identified, the overall agree-20
ment between the methods was good.
1 Introduction
Formaldehyde (HCHO) is an important indoor and outdoor air pollutant. It adversely affects human health (e.g.Rumchev et al.,2002;Solomon et al.,2007) and plays a key role as an intermediate in the tropospheric photochemical oxidation of hydrocarbons. It 25
forma-ACPD
7, 15619–15650, 2007HCHO intercomparison
A. Wisthaler et al.
Title Page
Abstract Introduction
Conclusions References
Tables Figures
◭ ◮
◭ ◮
Back Close
Full Screen / Esc
Printer-friendly Version
Interactive Discussion
EGU tion (e.g.Sumner et al.,2002;Liu et al.,2007). HCHO is ubiquitously found throughout
the troposphere with levels ranging from a few ppt in clean background air conditions to a few tens of ppb in polluted atmospheres such as metropolitan areas or contaminated indoor environments (e.g.Dingle and Franklin,2002;Koppmann and Wildt,2007).
A number of techniques have been developed for atmospheric HCHO measure-5
ments including: (i) in-situ spectroscopic methods such as Fourier transform infrared spectroscopy (FTIR), differential optical absorption spectroscopy (DOAS) and tunable diode laser absorption spectroscopy (TDLAS), (ii) derivatization-chromatography meth-ods such as 2,4-dinitrophenylhydrazine (DNPH) derivatization followed by gas chro-matography (GC) or high pressure liquid chrochro-matography (HPLC), (iii) fluorimetric tech-10
niques based on the Hantzsch reaction or the formaldehyde dehydrogenase catalyzed reduction of NAD+ to NADH, (iv) on-line chemical ionization methods such as proton-transfer-reaction mass spectrometry (PTR-MS), and (v) remote spectroscopic methods used on satellite-borne platforms (Heard,2006, and references therein).
For method validation purposes, a number of intercomparison exercises have been 15
performed in the last two decades which have been thoroughly reviewed in a recent paper byHak et al.(2005). The authors summarize that the level of agreement during these past intercomparisons varied from good to quite poor, with no obvious patterns discernible. Their own intercomparison exercise revealed significant discrepancies and confirmed the need for more method validation work.
20
In this study we challenged five state-of-the-art HCHO sensors (DOAS, DNPH-HPLC, Hantzsch (2), and PTR-MS) in an intercomparison exercise conducted at the atmosphere simulation chamber SAPHIR at the Research Centre J ¨ulich (FZJ). We performed five days of formal blind inter-comparison experiments with an independent referee (E. Apel, NCAR). The experiments took place under near natural conditions 25
com-ACPD
7, 15619–15650, 2007HCHO intercomparison
A. Wisthaler et al.
Title Page
Abstract Introduction
Conclusions References
Tables Figures
◭ ◮
◭ ◮
Back Close
Full Screen / Esc
Printer-friendly Version
Interactive Discussion
EGU pounds were injected into the chamber to generate ppb levels of aldehydes and
ke-tones (acetaldehyde, butanal, hexanal, benzaldehyde, methacrolein, acetone, methyl vinyl ketone), pure hydrocarbons (n-butane, toluene), esters (methyl acetate) and al-cohols (methanol, ethanol, 1-propanol, 1-butanol, 2-methyl-3-buten-2-ol). Results from the other species, obtained by using additional instruments, will be presented in a sep-5
arate publication (Apel et al., 20071).
2 Description of the formaldehyde instruments
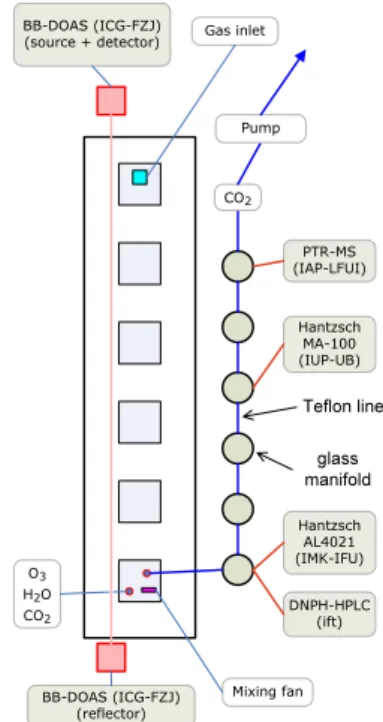
Table1overviews the instruments participating in the HCHO intercomparison exercise. The inlet-based instruments (1, 2, 3, and 5; Hantzsch, DNPH, and PTR-MS) were con-nected to manifolds which were continuously flushed with chamber air (see Sect.3.2 10
and Fig.1). The variety of deployed techniques allowed us to compare results from a true in-situ technique such as DOAS (which measured HCHO mixing ratios in the chamber) with results from inlet-based instruments. Since spatial gradients were elimi-nated in the well-mixed atmosphere simulation chamber, spatial DOAS measurements could be directly compared with point measurements from the inlet-based instruments. 15
Finally, we were able to cross-validate a variety of calibration methods (gas-phase standards, liquid standards, absolute measurements).
2.1 Hantzsch AL4021 (IMK-IFU)
A commercially available instrument (AL4021, Aerolaser GmbH, Garmisch-Partenkirchen, Germany) was used for HCHO detection (Junkermann and Burger, 20
2006). The technique for the measurement of gas-phase HCHO using the fluorimetric Hantzsch reaction in the liquid phase requires the quantitative transfer of HCHO from
1
ACPD
7, 15619–15650, 2007HCHO intercomparison
A. Wisthaler et al.
Title Page
Abstract Introduction
Conclusions References
Tables Figures
◭ ◮
◭ ◮
Back Close
Full Screen / Esc
Printer-friendly Version
Interactive Discussion
EGU the gas phase into the liquid phase. The stripping of the water soluble HCHO from
the air was carried out using a temperature controlled stainless steel stripping coil with well known surface area and gas and liquid flows. Stainless steel was used as it is simpler to maintain at a stable temperature. Gas and liquid flows were separated be-hind the coil and the liquid was further analyzed. The technique was calibrated using 5
liquid standards by calculating the gas phase concentration from the enrichment factor between gas and liquid flows in the stripper. The following instrument features were used: (1) the stripping coil inner diameter was 2 mm with a total length of 120 cm; (2) the stripping flow was set to 0.42 ml min−1 at 10◦C with a Hantzsch reagent flow of 0.15 ml min−1 and a reactor temperature of 65±0.1◦C. The fluorimeter consisted of a
10
phosphor coated mercury lamp with an excitation filter of 405±20 nm. The detection
was achieved by using a colored glass filter with a cut-off wavelength of 500 nm and a photomultiplier. The fluorimeter temperature was stabilized at 40±0.1◦C. The gas
phase detection limit with these instrument settings was≈50 ppt. Zeroing signals were
obtained by passing the ambient air through a filter cartridge containing a Hopkalit 15
catalyst. For the span signal, liquid standards with 10−6mol l−1 were applied to the stripping solution line. The preparation of this standard was done by dilution of a long term stable 0.01 mol l−1 working standard using the stripping solution for dilution. In
previous experiments a positive O3interference of≈200 ppt HCHO signal for 100 ppb
of O3was found. The interference was found to be linear and humidity-independent. A 20
Teflon line (L=2 m; OD=6.35 mm) was connected to one of the glass manifolds taking a sampling flow of 1 l min−1(STP) for analysis.
2.2 Hantzsch MA-100 (iup-UB)
A commercial, wet-chemical instrument (Methanalyser, Alpha Omega Power Technolo-gies, Model MA-100, Albuquerque, New Mexico, USA) was deployed for HCHO mea-25
ACPD
7, 15619–15650, 2007HCHO intercomparison
A. Wisthaler et al.
Title Page
Abstract Introduction
Conclusions References
Tables Figures
◭ ◮
◭ ◮
Back Close
Full Screen / Esc
Printer-friendly Version
Interactive Discussion
EGU in the air diffuses through the membrane into a counter-flow of water. The aqueous
HCHO then reacts with NH+4 and acetyl acetone (Hantzsch reaction) inside the liquid reactor forming a fluorescent product, 3,5-diacetyl-1,4-dihydrolutidine (DDL), which is continuously monitored. For the experiments presented here a two-way inlet system was used to allow semi-continuous measurements of HCHO and methanol (Solomon 5
et al., 2005). Air was sampled at a constant flow rate of 1.7 l min−1 (STP) from the
glass manifold via a Teflon PFA tubing (OD=6.35 mm), passed through a Teflon pump (KNF Neuberger Inc., Model N86 KTDC B, Trenton, New Jersey, USA) and directed into a 3-way PFA Teflon valve (Metron Technologies, Unterschleissheim, Germany) where it was either diverted through a catalytic methanol-to-formaldehyde converter 10
for methanol measurements or directly led to the instrument for HCHO measurements (Solomon et al.,2005). Gas phase HCHO calibration was performed using a perme-ation tube-based gas standard generator (KIN-TEK, Model 491 MB, LaMarque, Texas, USA) providing an accuracy of 8%. The detection limit was 80 ppt at an integration time of 120 s.
15
2.3 DNPH-HPLC (ift)
HCHO collection was performed by using self-prepared glass cartridges (L=100 mm; OD=10 mm) filled with ≈1 g silica gel (Merck, Darmstadt; sphere diameter: 125–
200 µ m) spiked with phosphoric acid and 2,4-dinitrophenylhydrazine (DNPH) (M ¨uller, 1997). The glass cartridges were located between two stainless steel valves in an 20
automatic multi-channel sampler. A quartz fiber particle filter was installed in front of the sampler to prevent contamination of the valves. The air flow through the cartridges was regulated by a mass flow controller to 2 l min−1(STP). A collection efficiency of 95– 100% was found for similar cartridges in previous studies (Slemr, 1991; Zhang et al., 1994) and verified by laboratory experiments. At the sampler inlet a copper tube coil 25
scrub-ACPD
7, 15619–15650, 2007HCHO intercomparison
A. Wisthaler et al.
Title Page
Abstract Introduction
Conclusions References
Tables Figures
◭ ◮
◭ ◮
Back Close
Full Screen / Esc
Printer-friendly Version
Interactive Discussion
EGU ber. The cartridge sampler was connected to the glass sample manifold via a Teflon
PTFE tube (L=2 m; OD=6.35 mm). Sampling times ranged from 60 min to 120 min. One cartridge of the sampler was not exposed to chamber air but handled identically to a sample to serve as a blank. HPLC analysis was carried out using a ternary gra-dient HPLC-system equipped with a temperature controlled column holder (Thermo-5
quest, AS3000) and a multiwavelength fast scanning UV/VIS detector (Thermoquest, UV3000HR). The analytical column in use was a WATERS RP18 (300×3.9 mm, 4µm,
60 ˚A). The separation was carried out at 45◦C and a solvent flow rate of 1.5 ml min−1.
The detection wavelengths were set to 360 and 380 nm. A three-point calibration using a liquid gravimetric standard was carried out (accuracy is 15%). The detection limit of 10
the method is 0.04 ppb.
2.4 BB-DOAS (ICG-FZJ)
Differential Optical Absorption Spectroscopy (DOAS) is a direct and non-extractive method based on the Beer-Lambert law. The atmosphere simulation chamber SAPHIR is equipped with a Broadband-DOAS system (Bossmeyer et al.,2006;Brauers et al., 15
2007). A Xenon short arc lamp (OSRAM, XBO 75W/2) serves as a light source and is housed outside the chamber. The light is transferred to the chamber via mirrors and an optical fibre. During the intercomparison campaign, an edge filter (Schott, U-330) was used to prevent excess light from entering the spectrograph. The light enters and leaves the chamber through a quartz window. Inside the chamber the light travels 48 20
times within a modified version of a White type multiple reflection system of 20 m base length. The optical components of the White cell are integrated at the north and south end. After passing the White cell, the light is guided via an optical fibre assembly into a Czerny-Turner type spectrograph (Jobin Yvon, HR 460) equipped with a blazed holo-graphic grating. There it is dispersed and projected onto a photo diode array (Hama-25
inter-ACPD
7, 15619–15650, 2007HCHO intercomparison
A. Wisthaler et al.
Title Page
Abstract Introduction
Conclusions References
Tables Figures
◭ ◮
◭ ◮
Back Close
Full Screen / Esc
Printer-friendly Version
Interactive Discussion
EGU comparison exercise HCHO was detected in the spectral range from 310 to 350 nm
using a 960 m light path inside SAPHIR. For the evaluation of the spectra we used the cross section ofMeller and Moortgat(2000) as described inBrauers et al.(2007). The accuracy was 6% with an additional uncertainty in the temperature coefficient (Brauers et al.,2007). The 1-σ precision of the measurements presented here was in the order 5
of 400 ppt.
2.5 PTR-MS (IAP-LFUI)
A commercial PTR-MS instrument (PTRMS-FDT-s, Ionicon Analytik GmbH, Innsbruck, Austria) was used for HCHO measurements. PTR-MS is a chemical ionization tech-nique based on proton-transfer reactions from H3O+ primary ion to gaseous organic 10
analytes (Lindinger et al., 1999) with a higher proton affinity than H2O. The PTR-MS was run in the selected ion monitoring (SIM) mode with a single ion dwell time of 2 s and a total SIM cycle time of 75 s. Protonated HCHO was measured atm/z=31. In or-der to optimize the performance of the PTR-MS instrument for HCHO measurements the PTR-MS experimental set-up and operational parameters were slightly modified 15
(Wisthaler et al., 2006). The length of the Teflon PFA tube (OD=6.25 mm) through which the ion source is evacuated was shortened to ≈6 cm to maximize the water
pump-down from the ion source. This simple modification reduced the water leakage from the ion source into the drift tube to<0.1%. Given that the absolute humidity in the analyte air is also low (<1%) the drift field needed to prevent hydration of ions can be 20
greatly reduced leading to an increase in sensitivity due to an increased ion residence time. In this study the PTR-MS operating parameters were reduced from typical val-ues ranging from≈130 Td (1 Td=10−17cm2V molecule−1) to 75 Td. Lowering the E/N
levels also reduces the rate of the collision-energy driven backward reaction between protonated HCHO and water resulting in an additional sensitivity gain. The simple 25
ACPD
7, 15619–15650, 2007HCHO intercomparison
A. Wisthaler et al.
Title Page
Abstract Introduction
Conclusions References
Tables Figures
◭ ◮
◭ ◮
Back Close
Full Screen / Esc
Printer-friendly Version
Interactive Discussion
EGU turned out to be problematic since large day-to-day variations (up to 40%) in PTR-MS
response factors were found when a permeation-tube-based gas standard generator (KIN-TEK, Model 491 MB LaMarque, Texas, USA) was used. Thus, PTR-MS response factors for HCHO were obtained with two alternative methods: (1) by calculation us-ing simple pseudo first-order ion-molecule reaction kinetics (Sprung et al.,2001) and 5
(2) by using acetaldehyde (CH3CHO) as a surrogate for HCHO. An acetaldehyde cal-ibration was obtained by dynamic dilution from a certified gas standard (Apel-Riemer Environmental Inc., Denver, Colorado, USA). A slightly different mass discrimination in the MS detection system and different electrical properties (dipole moment, molec-ular polarizability) of HCHO and CH3CHO were taken into account. Response fac-10
tors of both calibration procedures were in good agreement (±10%). The PTR-MS
instrument was connected to the main sampling manifold through a 2 m long Teflon PFA tube (OD=3.175 mm) pumped at a flow rate of 250 cm3min−1 (STP). A flow of
≈150 cm3min−1 was branched offto the inlet of the PTR-MS instrument, which con-sisted of a 1m long pressure-controlled Silcosteel (Restek Corp., Bellefonte, PA, USA) 15
capillary (OD=0.39 mm). An effective sample flow of ≈20 cm3min−1 was supplied to
the PTR-MS drift tube, with the overflow being discarded. All inlet lines were heated to 60◦C. To determine the instrumental background signals the sample flow was
pe-riodically diverted through a VOC scrubber (platinum coated quartz wool, T=350◦C) capable of removing VOCs with an efficiency>99.9%.
20
3 Experimental
3.1 Atmosphere simulation chamber SAPHIR
The atmosphere simulation chamber SAPHIR consists of an almost cylindrical, double-wall Teflon FEP (DuPont) tube held in a steel frame. The inner tube (r=2.5 m,L=18 m) is used as a reactor for simulation experiments (e.g. Rohrer et al.,2005;Bossmeyer 25
ACPD
7, 15619–15650, 2007HCHO intercomparison
A. Wisthaler et al.
Title Page
Abstract Introduction
Conclusions References
Tables Figures
◭ ◮
◭ ◮
Back Close
Full Screen / Esc
Printer-friendly Version
Interactive Discussion
EGU is 268±5 m3, with a volume-to-surface ratio of about 0.8 m. The space between the
inner and outer tube is≈0.2 m. This interstitial space is continuously flushed with
ultra-pure synthetic air to prevent diffusion and permeation of trace gases from outside into the reactor. The pressure of the inner chamber is always held at a pressure of 60 Pa above ambient. The wall of the inner tube consists of FEP film with a thickness of 5
125µm except for the floor (52 m2) which is made of a 500µm FEP film. The outer tube consists of a 250µm FEP film. The reactor is covered by a movable, opaque roof construction, which can be opened to perform experiments with sunlight illumination. The experiments presented here were performed under dark conditions.
Before experiments were started, the chamber was flushed with synthetic air of high 10
purity (N2:O2=79:21; high purity (7.0, equivallent to 99.99999%) for both N2 and O2; obtained from headspace of liquid N2and liquid O2, respectively) which in the following is referred to as “zero air”. Flushing was carried out at a flow rate of 300 m3h−1 for
several hours to purge all trace impurities below the detection limits of the instruments. During flushing the water vapor pressure was reduced to levels of less than 0.1 hPa, 15
corresponding to a dewpoint lower than−40◦C.
During the intercomparison exercise the analytical instruments continuously with-drew air from the chamber. Also gas is lost through unavoidable small leaks in the FEP film of the chamber wall. These losses are compensated by adding zero air (3– 10 m3h−1) through a separate inlet line to the chamber (replenishment flow) to keep 20
the air volume and pressure inside the chamber constant. Consequently, the HCHO mixing ratio in the chamber was diluted by this process. Inside the chamber a powerful fan is installed which provides mixing of injected gases in less than 2 min. The fan was always switched on when trace gases or water was added.
Ozone (O3) was generated using a silent discharge ozonizer (Ozat CFS-1A, Ozonia 25
ACPD
7, 15619–15650, 2007HCHO intercomparison
A. Wisthaler et al.
Title Page
Abstract Introduction
Conclusions References
Tables Figures
◭ ◮
◭ ◮
Back Close
Full Screen / Esc
Printer-friendly Version
Interactive Discussion
EGU O3-41M, Karlsruhe, Germany).
Water vapor mixing ratios in the chamber air were adjusted by injection of water steam into the flushing air stream. Ultrapure H2O (Milli-Q, Millipore) was stored in a reservoir vessel with high-purity N2 being continuously bubbled through the water column to remove any dissolved trace gases. The clean H2O was vaporized and trans-5
ferred into the SAPHIR chamber with a flow of zero air. Humidity in the chamber was determined with a frost point hygrometer (General Eastern, model Hygro M4, General Electric Corp., Fairfield, Connecticut).
3.2 Setup of the formaldehyde instruments at SAPHIR
Chamber air was drawn at a flow rate of 41.0±0.5 l min−1through a heated (60–65◦C)
10
Teflon PTFE line (L=40 m; ID=10 mm) from the floor of the SAPHIR chamber to six laboratory containers situated below the chamber. In each container a heated glass manifold was installed where the inlet lines of the individual instruments were con-nected to (Fig. 1). Possible leakages in the sampling line were monitored by a CO2 sensor (GMM222, Vaisala, Finland) placed at the end of the main inlet. The zero air in 15
the chamber did not contain CO2so that leaks would have been rapidly detectable.
3.3 Formaldehyde injection
Gas-phase HCHO was generated by thermolysis of a weighted amount of para-HCHO powder (Merck; purity >95%) in an external glass reactor similar to the procedure described inBrauers et al.(2007). During heating the reactor was flushed with a con-20
stant flow of high-purity N2 which transferred the gas-phase HCHO into the chamber. The HCHO mixing ratio in the chamber after injection, HCHOinj, was derived from the known chamber volume V and the amount of HCHO injected. However, the transfer line (Teflon PFA,L=4 m; OD=6 mm) was not heated and thus at sub-zero ambient tem-perature. Therefore, the calculation of the initial HCHO mixing ratios in the chamber 25
ratio-time-ACPD
7, 15619–15650, 2007HCHO intercomparison
A. Wisthaler et al.
Title Page
Abstract Introduction
Conclusions References
Tables Figures
◭ ◮
◭ ◮
Back Close
Full Screen / Esc
Printer-friendly Version
Interactive Discussion
EGU profile in the chamber was calculated from the volume V, the injected formaldehyde
HCHOinjand the replenishment flow rateF(t) using equation
HCHOcalc(t)=HCHOinj×exp
−
Zt
0
F(t′)/V d t′
(1)
with a 1 min time step. Injected amounts of HCHO and dilution were known only to the independent referee of the intercomparison exercise.
5
3.4 Experiment
The HCHO intercomparison exercise presented here took place 24–28 January 2005. HCHO instruments were inter-compared on five successive days with different experi-mental conditions.
On day 1 (24 January 2005), a blank experiment was conducted without HCHO being 10
injected into the chamber. The chamber was initially filled with dry zero air; H2O and O3were sequentially added during the course of the day to investigate potential HCHO formation and interferences. Because of a number of technical problems associated with both individual instruments and manifold leaks in the laboratory containers, no data are reported for this day.
15
On day 2 (25 January 2005), HCHO was spiked into dry zero air. On day 3 (26 January 2005), the sample air matrix onto which HCHO was spiked was humidified zero air. On day 4 (27 January 2005), both H2O and O3 were added to the chamber prior to HCHO injection. In order to challenge the instruments with different levels of HCHO, the spiked sample air matrix was diluted with zero air twice during days 2, 3 and 20
4. Consequently, each of the respective days consisted of three 3 h sampling intervals labeled A, B, and C (see Figs.2,3and4).
The additional dilution steps were included in the calculation of HCHOcalc(t). The degree of dilution was known only to the independent referee. Investigated HCHO mixing ratios varied from tenths of a ppb to less than 10 ppb; this range was known 25
ACPD
7, 15619–15650, 2007HCHO intercomparison
A. Wisthaler et al.
Title Page
Abstract Introduction
Conclusions References
Tables Figures
◭ ◮
◭ ◮
Back Close
Full Screen / Esc
Printer-friendly Version
Interactive Discussion
EGU throughout an entire day, compensation injections were made during the major dilution
steps.
On day 5 (28 January 2005), the chamber was flushed with particulate-filtered am-bient air for 3 h (see Fig.5). The purpose of this experiment was to challenge the in-struments with low HCHO levels present in wintertime J ¨ulich boundary-layer air. After 5
a sampling interval of 2 h, this real-world matrix was spiked with HCHO and monitored by the instruments for another 3.5 h.
4 Results and discussion
For comparison analysis, we produced multiple graphs for each day of the intercompar-ison exercise with the exception of day 1 for reasons given above. In the lower panel 10
of the multiple graphs (Figs.2,3,4, and5), the time series of experimental conditions (O3mixing ratio,Toutsidetemperature outside of the chamber,Tinsidetemperature inside the chamber, andTdewp dewpoint temperature inside) are displayed. The upper panel of each figure shows the experimentally derived HCHO mixing ratios together with the calculated mixing ratio-time profile HCHOcalc(t). Experimental data were not corrected 15
after submission to the referee with two exceptions in the case of the Hantzsch MA-100 analyzer. During day 3 an obvious time conversion error had occurred during data processing and a time correction was necessary. In addition, during day 5 (level B) a series of outliers (n=14) in the 3 to 5 ppb range were removed which were caused by a leaking valve between the calibration gas stream and the analyte gas stream. 20
The middle panel displays the ratios of measured-to-calculated HCHO mixing ratios in the chamber versus time. Table 2 summarizes these ratios for each experimental condition and each instrument. As mentioned above injections at low temperatures losses were less accurate, resulting in less accurate HCHOcalc(t) values. Therefore, the observed ratios were lower than 1 on day 2 and 3 while on day 4 higher ratios were 25
accu-ACPD
7, 15619–15650, 2007HCHO intercomparison
A. Wisthaler et al.
Title Page
Abstract Introduction
Conclusions References
Tables Figures
◭ ◮
◭ ◮
Back Close
Full Screen / Esc
Printer-friendly Version
Interactive Discussion
EGU racy. Consequently, a time-constant ratio of measured-to-calculated HCHO levels was
used as an indicator for the linearity of the instrumental response and the constancy of an eventual instrumental offset. This was valid as long as external injection was the only source of HCHO and dilution was the only sink for HCHO in the chamber. The middle panel figures give most of the information which is typically contained in linear 5
regression plots used for comparison analysis. We have thus refrained from presenting additional regression plots.
4.1 Day 2 (dry zero air)
HCHOinj was at least 20% higher than all experimentally derived HCHO mixing ratios at the start of the experiment. This indicates possible transfer losses when HCHO was 10
flushed into the chamber. Since the BB-DOAS system did not measure during day 2 (due to technical problems), no in-situ chamber measurement was obtained. However, the relative diurnal profile of the calculated concentration is known with high accuracy (Eq.1).
The data produced by the Hantzsch AL4021 and the PTR-MS instruments were 15
in excellent agreement during day 2 (Fig. 2, top). The larger scatter of the PTR-MS data reflects its higher statistical error at the chosen 2 s signal integration time; the Hantzsch AL4021 analyzer produced 60 s time averages. At level C a small discrepancy of ≈0.1 ppb between the two instruments was observed. While the
ra-tios HCHOPTR−MS/HCHOcalc and HCHOAL4021/HCHOcalc remained constant through-20
out levels A and B (Fig.2, middle), 4% lower ratios were observed for PTR-MS at level C while the ratios of Hantzsch AL4021 analyzer increased by 10% suggesting that this instrument was affected by a positive bias on the order of 0.1 ppb.
The Hantzsch MA-100 data were substantially higher than the data produced by both the Hantzsch AL4021 analyzer and the PTR-MS instrument. Notably, the ratio 25
instrumen-ACPD
7, 15619–15650, 2007HCHO intercomparison
A. Wisthaler et al.
Title Page
Abstract Introduction
Conclusions References
Tables Figures
◭ ◮
◭ ◮
Back Close
Full Screen / Esc
Printer-friendly Version
Interactive Discussion
EGU tal problem of the MA-100 analyzer, we consider it more likely that the modified inlet
system biased the measurements. The sample flow for this instrument was pumped through a Teflon diaphragm pump prior to analysis. Previous studies have shown that these pumps release C2–C4 aldehydes in significant amounts (Apel et al., 2003) as aldehydes permeate from the pumps into the sample air stream. Even though Apel 5
et al. (2003) did not measure HCHO in their experiments we consider it very likely to be the case also for the C1 aldehyde. HCHO carry-over from the methanol-to-HCHO converter and an occasional valve malfunction (as observed later) leading to leakage from the HCHO calibration channel into the sample air channel were other possible failure scenarios associated with the inlet system.
10
The DNPH-HPLC data severely underestimated HCHO levels during the entire day 2. This can be simply explained by the fact that hydrazine-to-hydrazone conversion is greatly suppressed at low humidities. This phenomenon has not been studied in detail for HCHO but tests conducted with acetone, propanal and diethylketone test atmo-spheres at the ift laboratories revealed that below 5% RH the hydrazone yield was only 15
5–35% of the yield observed at 40% RH. The applied DNPH-HPLC method is thus obviously not suited for HCHO measurements at low humidities.
4.2 Day 3 (humid zero air)
After flushing the chamber over night with zero air, water was injected into the chamber from 05:45 to 06:10 (Fig.3, bottom). The PTR-MS instrument was the only analyzer 20
that sampled the humidified air matrix for a period of≈25 min before HCHO injection.
The obtained data indicate that no HCHO was introduced in the chamber during the humidification step.
While HCHOinj was 7.05 ppb, all measured HCHO values show a rapid initial decay by more than a factor of 2 indicating a strong loss of HCHO in the chamber during 25
phase A. During this phase the dew point temperature inside the chamber was in the range of −1◦C to −2◦C. This was between the measured temperatures outside and
ACPD
7, 15619–15650, 2007HCHO intercomparison
A. Wisthaler et al.
Title Page
Abstract Introduction
Conclusions References
Tables Figures
◭ ◮
◭ ◮
Back Close
Full Screen / Esc
Printer-friendly Version
Interactive Discussion
EGU observed on the FEP foil of the chamber and gas-phase HCHO was scavenged into
the liquid phase. This effect, reflecting the high solubility of HCHO, was not observed in simultaneous measurements of other compounds like alcohols and higher aldehydes (Apel et al., 20071).
Notably, most of the scavenged HCHO was released back into the gas phase when 5
the chamber was flushed with dry air during the transition from level A to level B. When going from level B to level C a further minor recovery of HCHO was observed. For level C, calculated and measured HCHO values were in excellent agreement indicating that no injection losses occurred during day 3. In humidified air the agreement between Hantzsch AL4021 and PTR-MS data was again excellent. The DNPH-HPLC data were 10
also in good agreement, although≈0.2–0.3 ppb lower during levels A and B.
The Hantzsch MA-100 data were again affected by a non-constant HCHO offset leading to an overestimation of HCHO levels during levels A and level B. However, for level C agreement with the other instruments was good. The BB-DOAS system measured only at different wavelengths (Apel et al., 20071).
15
4.3 Day 4 (humid zero air with ozone)
Again after flushing overnight, H2O and O3 were both injected into the chamber from 05:55 to 06:36 and at 06:43, respectively. The PTR-MS instrument was again the only analyzer that sampled the humidified and ozonized air matrix before HCHO injection. A HCHO mean value of 0.52±0.17 ppb was measured for the period 07:05 to 07:35.
20
This finding indicates that traces of HCHO were already present in the chamber before HCHO injection, most likely due to formation during the O3generation/injection process and/or heterogeneous O3reactions on the chamber walls. Here we will shortly refer to results from day 1 which have otherwise been excluded from the analysis. The PTR-MS instrument was operational when O3was added to humidified air during day 1. A 25
ACPD
7, 15619–15650, 2007HCHO intercomparison
A. Wisthaler et al.
Title Page
Abstract Introduction
Conclusions References
Tables Figures
◭ ◮
◭ ◮
Back Close
Full Screen / Esc
Printer-friendly Version
Interactive Discussion
EGU 0.3 ppb (all the other monitored C2–C10 aldehydes increased as well). During the first
hour after O3addition HCHO levels increased to a maximum level of≈0.4 ppb followed by a 0.1 ppb decrease in the 2 h thereafter. We thus conclude that a time-varying ad-ditional HCHO source has to be considered whenever O3 is present in the chamber. All instruments (with the exception of the Hantzsch MA-100) show an increase in the 5
measured-to-calculated HCHO levels during day 4 (Fig. 4, middle). This may be ex-plained by the fact that the calculated values do not consider the additional HCHO from the three O3additions (one primary injection, 2 compensation injections). For level A, measurements of DOAS, PTR-MS and Hantzsch MA-100 were in close agreement. Taking into account a 0.5 to 0.8 ppb offset due to HCHO formation from the O3injection 10
the calculated values were close to the values reported by these instruments. This finding again indicates that no injection losses occurred on day 4. However, two other instruments, the Hantzsch AL4021 and the DNPH-HPLC, reported significantly lower values at the highest H2O and O3 mixing ratios and it is not a priori clear which set of instruments is in error. Based on the assumption that a positive ozone interference 15
can be excluded with high confidence for the DOAS system we concluded that the Hantzsch AL4021 was affected by a negative ozone interference. This result is dif-ficult to explain, as for this method no negative ozone bias has been reported so far. Successive intensive laboratory tests to investigate this phenomenon yielded a positive bias of 200 ppt HCHO at 100 ppb O3. In consequence, at present we have no sound 20
explanation for the observed negative bias.
The DNPH-HPLC data were somehow too low for level A and B but in quite good agreement for level C. A KI O3 scrubber was placed upstream the DNPH cartridges to prevent any negative O3 bias. The findings would be explainable by a varying per-formance of the KI ozone scrubber. It is known that these devices need water for 25
ACPD
7, 15619–15650, 2007HCHO intercomparison
A. Wisthaler et al.
Title Page
Abstract Introduction
Conclusions References
Tables Figures
◭ ◮
◭ ◮
Back Close
Full Screen / Esc
Printer-friendly Version
Interactive Discussion
EGU system participated in the intercomparison for HCHO. The agreement between DOAS
and PTR-MS data is remarkably good for all three levels. This is noteworthy as data from two instruments that require no external calibration, one a true in-situ instrument and the other an inlet-based sensor, agree very well. The MA-100 data again showed a strange behavior. Contrary to the other instruments the measured-to-calculated ratio 5
decreased with time. For level C, the instrument which usually overestimated HCHO levels, produced values that are significantly lower than those reported by the other four instruments.
4.4 Day 5 (ambient air)
Flushing of the chamber with particulate-filtered ambient air (flow rate≈500 m3h−1)
10
started at 05:00 and lasted until 08:00. Before flushing the chamber was filled with the sample air matrix prepared for day 4. The HCHO decay from level C of day 4 to am-bient levels of the wintertime J ¨ulich boundary layer was monitored only by the DOAS system and the PTR-MS instrument. Data from both instruments were in excellent agreement as can be seen in Fig. 5 (top). On the morning of day 5 (05:00–09:25) the 15
PTR-MS instrument was operated in the full scan mode with an upper mass limit of m/z=150. Many PTR-MS signals increased when ambient air was introduced into the SAPHIR chamber confirming the complexity of this new air matrix to be investigated. The series of C6–C10 aromatics was clearly discernible in the PTR-MS spectrum in-dicating that the sampled air was strongly impacted by the morning traffic. Most of 20
the observed PTR-MS signals reached a steady-state level between 06:00 and 07:00. Level A of day 5 was sampled from 08:00 to 10:20. Wintertime ambient HCHO mixing ratios were only a few hundred ppt which is close to the BB-DOAS and PTR-MS de-tection limits for the signal integration times used here. The mean value (±1-σ) over
the entire period A was calculated to better compare the results of the five instruments. 25
Results were: 0.29±0.04 (Hantzsch AL4021), 0.29±0.10 (DNPH-HPLC), 0.09±0.18
(BB-DOAS), 0.44±0.19 (PTR-MS), 0.45±0.14 (Hantzsch MA-100). Apart from the
ACPD
7, 15619–15650, 2007HCHO intercomparison
A. Wisthaler et al.
Title Page
Abstract Introduction
Conclusions References
Tables Figures
◭ ◮
◭ ◮
Back Close
Full Screen / Esc
Printer-friendly Version
Interactive Discussion
EGU was satisfactory. At 10:20 we spiked the chamber air with 3.4 ppb of HCHO. Taking
into account that the 0.3–0.4 ppb of HCHO already present in the ambient air matrix were not considered for HCHOinj calculation, the calculated HCHO values are roughly a factor of 2 too high. This finding indicates that significant injection losses occurred during day 5. For level B, Hantzsch AL4021 and DNPH-HPLC data were in excellent 5
agreement but the three other instruments reporting somewhat higher levels (PTR-MS: 0.2–0.4 ppb; Hantzsch MA-100: 0.8 ppb). 14 outliers in the 3 to 5 ppb range were re-moved for the Hantzsch MA-100. Data from the DOAS instrument were in reasonable agreement at the beginning of level B. After 12:00, however, an upward drift of≈0.5 ppb
was seen which remains unexplained. 10
5 Conclusions
A formal blind intercomparison exercise for the determination of atmospheric HCHO was conducted at the atmosphere simulation chamber SAPHIR at the Research Centre J ¨ulich. Five state-of-the-art HCHO instruments (based on four different sensing prin-ciples) were deployed: a custom-built DOAS instrument (optical spectroscopy), self-15
prepared DNPH cartridges for HPLC analysis (derivatization-chromatography), two dif-ferent types of commercially available wet chemical sensors (Hantzsch fluorimetry) and a PTR-MS instrument (chemical ionization mass spectrometry). The deployed meth-ods were independently calibrated. The instruments were challenged with typical am-bient levels of HCHO ranging from tenths of a ppb to several ppb. Synthetic air of high 20
purity and particulate-filtered ambient air were used as sample matrices in the simu-lation chamber onto which HCHO was spiked under varying levels humidity and O3. Measurements were compared to mixing ratios calculated from the chamber volume and the known amount of HCHO injected into the chamber, summarized in Table 2. Due to injection uncertainties, calculated HCHO mixing ratios were less accurate than 25
ACPD
7, 15619–15650, 2007HCHO intercomparison
A. Wisthaler et al.
Title Page
Abstract Introduction
Conclusions References
Tables Figures
◭ ◮
◭ ◮
Back Close
Full Screen / Esc
Printer-friendly Version
Interactive Discussion
EGU The intercomparison exercise revealed a series of analytical problems associated
with the experimental set-up and individual instruments. In dry synthetic air, hydrazine-to-hydrazone conversion was greatly suppressed in the DNPH cartridges resulting in highly under estimated HCHO levels by the DNPH-HPLC under this condition. The data of the Hantzsch MA-100 instrument equipped with a modified inlet system were 5
affected by a non-constant offset under most conditions. It is unclear whether the observed discrepancies were caused by the modified inlet system or whether they arose from other instrumental deficiencies. With O3 present at 44±2 ppb both DOAS
and PTR-MS produced significantly higher levels than the Hantzsch AL4021 and the DNPH-HPLC. Based on the assumption that a positive ozone bias can be excluded 10
with high confidence for the DOAS system we concluded that both the DNPH-HPLC and the Hantzsch AL4021 were affected by a negative ozone interference during part of the experiment. However, this interference was not observed in other experiments for the Hantzsch AL4021. The bias varied with time and/or HCHO concentration and remains unexplained.
15
Apart from the problems reported above the obtained agreement can be considered as good. The PTR-MS in its optimized mode of operation proved to be a promising tool for on-line sub-ppb detection of HCHO at low absolute humidities (<1%). The detailed analysis, however, revealed a series of minor discrepancies, unresolved features and open questions remain to be answered before measurements of atmospheric HCHO 20
with high accuracy and precision are guaranteed. A recommendation from this study is that a validated reference standard should be developed against which the accuracy of the individual instruments can be assessed. The generation of defined atmospheres in SAPHIR seems a promising candidate since injection losses may be easily minimized using a heated transfer line. As for many previous HCHO intercomparisons the gen-25
ACPD
7, 15619–15650, 2007HCHO intercomparison
A. Wisthaler et al.
Title Page
Abstract Introduction
Conclusions References
Tables Figures
◭ ◮
◭ ◮
Back Close
Full Screen / Esc
Printer-friendly Version
Interactive Discussion
EGU Acknowledgements. This work was supported by the EU FP-6 programs ACCENT and
EU-ROCHAMP. We acknowledge the inputs from all participants of the 2005 ACCENT OVOC intercomparison campaign. We thank R. H ¨aseler and F. J. Johnen for the support with the experiments.
References
5
Apel, E. C., Hills, A. J., Lueb, R., Zindel, S., Eisele, S., and Riemer, D. D.: A fast-GC/MS system to measure C-2 to C-4 carbonyls and methanol aboard aircraft, J. Geophys. Res., 108, 8794, doi:10.1029/2002JD003199, 2003
Bossmeyer, J., Brauers, T., Richter, C., Rohrer, F., Wegener, R., and Wahner, A.: Simulation Chamber Studies on the NO3 Chemistry of Atmospheric Aldehydes, Geophys. Res. Lett.,
10
33, L18810, doi:10.1029/2006GL026778, 2006. 15634
Brauers, T., Bossmeyer, J., Dorn, H.-P., Schlosser, E., Tillmann, R., Wegener, R., and Wahner, A.: Investigation of the formaldehyde differential absorption cross section at high and low spectral resolution in the simulation chamber SAPHIR, Atmos. Chem. Phys., 7, 3579–3586, 2007,
15
http://www.atmos-chem-phys.net/7/3579/2007/. 15626,15628
Dingle, P. and Franklin, P.: Formaldehyde levels and the factors affecting these levels in homes in Perth, western Australia, Indoor and Built Environment, 3(11), 111–116, 2002. 15626,
15627,15628,15630,15638
Fan, Q. and Dasgupta, P. K.: Continuous automated determination of atmospheric formalde-20
hyde at the parts per trillion levels, Anal. Chem., 66, 551–556, 1994.15622
Finlayson-Pitts, B. J. and Pitts, J. N.: Chemistry of the Upper and Lower Atmosphere – Theory, Experiments and Applications, Academic Press, San Diego, 2000. 15624
Gratien, A., Picquet-Varrault, B., Orphal, J., Perraudin, E., Doussin, J.-F., and Flaud, J.-M.: Lab-oratory intercomparison of the formaldehyde absorption cross sections in the infrared (1660-25
1820 cm−1
) and ultraviolet (300-360 nm) spectral regions, J. Geophys. Res., 112, D05305, doi:10.1029/2006JD007201, 2007.
ACPD
7, 15619–15650, 2007HCHO intercomparison
A. Wisthaler et al.
Title Page
Abstract Introduction
Conclusions References
Tables Figures
◭ ◮
◭ ◮
Back Close
Full Screen / Esc
Printer-friendly Version
Interactive Discussion
EGU four different in-situ techniques for ambient formaldehyde measurements in urban air, Atmos.
Chem. Phys., 5, 2881–2900, 2005,
http://www.atmos-chem-phys.net/5/2881/2005/.
Heard, D. E. (Ed.): Analytical Techniques for Atmospheric Measurement, Blackwell Publishing, ISBN 1405123575, Oxford, UK, 2006.15622
5
Junkermann, W. and Burger, J. M.: A new portable instrument for continuous measurement of formaldehyde in ambient air, J. Atmos. Oceanic Technol., 23(1), 38–45, 2006. 15622
Kleffmann, J., L ¨orzer, J. C., Wiesen, P., Kern, C., Trick, S., Volkamer, R., Rodenas, M., and Wirtz, K.: Intercomparison of the DOAS and LOPAP techniques for the detection of nitrous acid (HONO), Atmos. Environ., 40, 3640–3652, 2006. 15623
10
Koppmann, R. and Wildt, J.: Oxygenated Volatile Organic Compounds in: Volatile Organic Compounds in the Atmosphere, edited by: Koppmann, R., pp. 129–172, Blackwell Publishing Ltd., Oxford, 2007.
Kraus, S. and Geyer, A.: DOASIS Jscript programming description, Institut f ¨ur Umweltphysik, University of Heidelberg, 2001. 15622
15
Li, J., Dasgupta, P. K., Genfa, Z., and Hutterli, M. A.: Measurement of Atmospheric Formalde-hyde with a Diffusion scrubber and light-emitting diode-liquid-core wave-guide based fluo-rometry, Field Anal. Chem. Tech., 5(1–2), 2–12, 2001.
Lindinger, W., Hansel, A., and Jordan, A.; Proton-transfer-reaction mass spectrometry (PTR-MS): on-line monitoring of volatile organic compounds at pptv levels, Chem. Soc. Rev., 27, 20
347–354, 1998. 15624
Liu, L., Flatøy, F., Ord ´o ˜nez, C., Braathen, G. O., Hak, C., Junkermann, W., Andreani-Aksoyoglu, S., Mellqvist, J., Galle, B., Pr ´ev ˆot, S. H., and Isaksen, I. S. A.: Photochemical modelling in the Po basin with focus on formaldehyde and ozone. Atmos. Chem. Phys., 7, 121–137, 2007,
http://www.atmos-chem-phys.net/7/121/2007/. 25
Meller, R. and Moortgat, G. K.: Temperature dependence of the absorption cross sections of formaldehyde between 223 and 323 K in the wavelength range 225–375 nm, J. Geophys. Res., 201(D6), 7089-7101, 2000. 15622
M ¨uller, K.: Determination of aldehydes and ketones in the atmospherea comparative long time study at an urban and a rural site in Eastern Germany, Chemosphere, 35, 2093–2106, 1997. 30
15627
ACPD
7, 15619–15650, 2007HCHO intercomparison
A. Wisthaler et al.
Title Page
Abstract Introduction
Conclusions References
Tables Figures
◭ ◮
◭ ◮
Back Close
Full Screen / Esc
Printer-friendly Version
Interactive Discussion
EGU 2000. 15625
Rohrer, F., Bohn, B., Brauers, T., Br ¨uning, D., Johnen, F.-J., Wahner, A., and Kleffmann, J.: Characterisation of the photolytic HONO-source in the atmosphere simulation chamber SAPHIR, Atmos. Chem. Phys., 5, 2189–2201, 2005,
http://www.atmos-chem-phys.net/5/2189/2005/. 5
Rumchev, K. B., Spickett, J. T., Bulsara, M. K., Phillips, M. R., and Stick, S. M.: Domestic exposure to formaldehyde significantly increases the risk of asthma in young children, Eur. Respir. J., 20, 403–406, 2002. 15628
Schlosser, E., Bohn, B., Brauers, T., Dorn, H.-P., Fuchs, H., H ¨aseler, R., Hofzumahaus, A., Holland, F., Rohrer, F., Rupp, L. O., Siese, M., Tillmann, R., and Wahner, A.: Intercomparison 10
of Two Hydroxyl Radical Measurement Techniques at the Atmosphere Simulation Chamber SAPHIR, J. Atmos. Chem., 56(2), 187–205, doi:10.1007/s10874-006-9049-3, 2006. 15621
Slemr, J.: Determination of volatile carbonyl compounds in clean air, Fresenius J. Anal. Chem., 340, 672–677, 1991.
Solomon, S. J., Custer, T., Schade, G. W., Soares Dias, A. P., and Burrows, J. P.: Atmospheric 15
methanol measurement using selective catalytic methanol to formaldehyde conversion. At-mos. Chem. Phys., 5, 2787–2796, 2005,
http://www.atmos-chem-phys.net/5/2787/2005/.
Solomon, S. J., Schade, G. W., Ladst ¨atter-Weissenmayer, A., Kuttippurath., J., and Burrows, J. P: VOC concentrations in an indoor workplace environment of a university building, Indoor 20
and Built Environment, in press, 2007. 15625
Sprung, D., Jost, C., Reiner, T., Hansel, A., and Wisthaler, A: Airborne measurements of acetone and acetonitrile in the tropical Indian Ocean boundary layer and free troposphere: Aircraft-based intercomparison of AP-CIMS and PTR-MS measurements, J. Geophys. Res., 106(22), 28 511–28 528, 2001. 15621
25
Sumner, A. L., Shepson, P. B., Grannas, A. M., Bottenheim, J. W., Anlauf, K. G., Worthy, D., Schroeder, W. H., Steffen, A., Domine, F., Perrier, S., and Houdier, S.: Atmospheric chemistry of formaldehyde in the Arctic troposphere at Polar Sunrise, and the influence of the snowpack, Atmos. Environ., 36, 15–16, 2002.15628
Tago, H. , Kimura, H., Kozawa, K., and Fujie, K.: Formaldehyde concentrations in ambient air 30
in urban and rural areas in Gunma prefecture, Japan, Water Air Soil Pollut., 163, 269–280, 2002. 15622
Wah-ACPD
7, 15619–15650, 2007HCHO intercomparison
A. Wisthaler et al.
Title Page
Abstract Introduction
Conclusions References
Tables Figures
◭ ◮
◭ ◮
Back Close
Full Screen / Esc
Printer-friendly Version
Interactive Discussion
EGU ner, A., Hansel, A., and Wisthaler, A.: Investigation of the ozonolysis of short chained
alkenes in the atmosphere simulation chamber SAPHIR, J. Geophys. Res., 112, D13301, doi:10.1029/2006JD007531, 2007.
Wisthaler, A., Hansel, A., Koppmann, R., Brauers, T., Bossmeyer, J., Steinbrecher, R., Junker-mann, W., M ¨uller, K. , Solomon, S. J., and Apel, E. C.: PTR-MS measurements of HCHO and 5
results from HCHO intercomparison measurements in the atmosphere simulation chamber SAPHIR, Geophys. Res. Abstr., 8, 04776, 2006. 15628
Zhang, J., He, Q., and Lioy, P. J.: Characteristics of aldehydes: concentrations, sources, and exposures for indoor and outdoor residential microenvironments, Environ. Sci. Technol., 28, 146–152, 1994. 15627
ACPD
7, 15619–15650, 2007HCHO intercomparison
A. Wisthaler et al.
Title Page
Abstract Introduction
Conclusions References
Tables Figures
◭ ◮
◭ ◮
Back Close
Full Screen / Esc
Printer-friendly Version
Interactive Discussion
EGU
Table 1.Overview of instrumental parameters of the HCHO instruments, details are described in the instruments section.
instrument details
# Instrument Group accuracy precision detection time
(1-σ)a limit (2-σ) resolution calibration
1 Hantzsch AL4021 IMK-IFU 5% 5% 50 ppt 60 s single-point liquid standard
2 Hantzsch MA-100 iup-UB 8% 1% 80 ppt 120 s HCHO permeation tube
3 DNPH-HPLC ift 15% 10% 40 ppt 1–2 h 3-point liquid standard
4 BB-DOAS ICG-FZJ 6% 20% 0.4 ppb 100 s literature absorption cross section
5 PTR-MS IAP-LFUI 10% 10% 0.2 ppb 2 sb ion-molecule reaction kinetics
a
Precision determined at 1 ppb HCHO mixing ratio.
b
ACPD
7, 15619–15650, 2007HCHO intercomparison
A. Wisthaler et al.
Title Page
Abstract Introduction
Conclusions References
Tables Figures
◭ ◮
◭ ◮
Back Close
Full Screen / Esc
Printer-friendly Version
Interactive Discussion
EGU
Table 2. Performance of the instruments during synthetic air matrix experiments. The results are presented as the ratio of measured to calculated concentrations for the individual days 2–4 and different concentration levels A–C.
Day 2 (dry) Day 3 (humid) Day 4 (humid+O3)
2
# Instrument A B C A1 B C A B C
1 Hantzsch AL4021 0.78 0.77 0.90 0.49 0.86 0.95 0.83 1.05 1.32
2 Hantzsch MA-100 0.88 1.19 1.25 0.59 1.04 0.88 1.40 1.08 0.52
3 DNPH-HPLC 0.11 0.26 0.38 0.44 0.72 0.89 0.66 0.83 1.14
4 BB-DOAS – – – – – – 1.33 1.33 1.28
5 PTR-MS 0.78 0.78 0.74 0.48 0.80 0.93 1.25 1.41 1.70
1
HCHO loss in the chamber possibly induced by water condensation. For details see text.
2
ACPD
7, 15619–15650, 2007HCHO intercomparison
A. Wisthaler et al.
Title Page
Abstract Introduction
Conclusions References
Tables Figures
◭ ◮
◭ ◮
Back Close
Full Screen / Esc
Printer-friendly Version
Interactive Discussion
EGU
Mixing fan Gas inlet
O3 H2O CO2
BB-DOAS (ICG-FZJ) (source + detector)
BB-DOAS (ICG-FZJ) (reflector)
DNPH-HPLC (ift) CO2
Pump
Hantzsch AL4021 (IMK-IFU)
Hantzsch MA-100 (IUP-UB) PTR-MS (IAP-LFUI)
glass manifold Teflon line
Fig. 1. Setup of the instruments at SAPHIR (top view onto the chamber floor). The squares indicate the instrument flange plates in the chamber floor. The red vertical line indicates the broad-band DOAS absorption light path. The blue line indicates the Teflon line connecting the glass manifolds. The HCHO instruments were connected to these manifolds using their individual inlet lines. The CO2sensors in the chamber and at the end of the Teflon line were
ACPD
7, 15619–15650, 2007HCHO intercomparison
A. Wisthaler et al.
Title Page
Abstract Introduction
Conclusions References
Tables Figures
◭ ◮
◭ ◮
Back Close
Full Screen / Esc
Printer-friendly Version
Interactive Discussion
EGU
Fig. 2. Time series of measured and calculated HCHO mixing ratios and chamber conditions during the zero air experiment. Upper panel: Original measurements of the individual instru-ments at their original time resolution. The calculated values are at 1 min time-step. Middle panel: Measurements ratioed to HCHOcalcin log-scale. Lower panel: Ozone mixing ratio (left
ACPD
7, 15619–15650, 2007HCHO intercomparison
A. Wisthaler et al.
Title Page
Abstract Introduction
Conclusions References
Tables Figures
◭ ◮
◭ ◮
Back Close
Full Screen / Esc
Printer-friendly Version
Interactive Discussion
EGU
Fig. 3. Time series of measured and calculated HCHO mixing ratios and chamber conditions during the zero air experiment with humidity. Upper panel: Original measurements of the individual instruments at their original time resolution. The calculated values are at 1 min time-step. Middle panel: Measurements ratioed to HCHOcalc in log-scale. Lower panel: Ozone
ACPD
7, 15619–15650, 2007HCHO intercomparison
A. Wisthaler et al.
Title Page
Abstract Introduction
Conclusions References
Tables Figures
◭ ◮
◭ ◮
Back Close
Full Screen / Esc
Printer-friendly Version
Interactive Discussion
EGU
Fig. 4. Time series of measured and calculated HCHO mixing ratios and chamber conditions during the zero air experiment with humidity and ozone. Upper panel: Original measurements of the individual instruments at their original time resolution. The calculated values are at 1 min time-step. Middle panel: Measurements ratioed to HCHOcalcin log-scale. Lower panel: Ozone
ACPD
7, 15619–15650, 2007HCHO intercomparison
A. Wisthaler et al.
Title Page
Abstract Introduction
Conclusions References
Tables Figures
◭ ◮
◭ ◮
Back Close
Full Screen / Esc
Printer-friendly Version
Interactive Discussion
EGU