F UNO A
ç
Ã
O
GETULIO VARGAS
EPGE
Escola de Pós-Graduação
em Economia
Ensaios Econômicos
Escola de
Pós-Graduação
em Economia
da Fundação
Getulio Vargas
N° 475 ISSN 0104-8910
The Long Run Economic Impact of AIDS
Pedro Cavalcanti Gomes Ferreira, Samuel de Abreu Pessoa
Os artigos publicados são de inteira responsabilidade de seus autores. As
opiniões neles emitidas não exprimem, necessariamente, o ponto de vista da
Fundação Getulio Vargas.
ESCOLA DE PÓS-GRADUAÇÃO EM ECONOMIA Diretor Geral: Renato Fragelli Cardoso
Diretor de Ensino: Luis Henrique Bertolino Braido Diretor de Pesquisa: João Victor Issler
Diretor de Publicações Científicas: Ricardo de Oliveira Cavalcanti
Cavalcanti Gomes Ferreira, Pedro
The Long Run Economic Impact of AIDS/
Pedro Cavalcanti Gomes Ferreira, Samuel de Abreu Pessoa - Rio de Janeiro: FGV,EPGE, 2010
(Ensaios Econômicos; 475)
Inclui bibliografia.
The Long-Run Economic Impact of AIDS*
Pedro Cavalcanti Ferreira
tFundação Getulio Vargas
Samuel Pessoa
Fundação Getulio Vargas
February 10, 2003
Abstract
This paper studies the long-run impact of HIV/AIDS on per capita income and
ed-ucation. We introduce a channel from HIV/AIDS to long-run income that has been
overlooked by the literature, the reduction of the incentives to study due to shorter
expected longevity. We work with a continuous time overlapping generations mo deI in
which life cycle features of savings and education decision play key roles. The
simu-lations predict that the most affected countries in Sub-Saharan Africa will be in the
future, on average, a quarter poorer than they would be without AIDS, due only to
the direct (human capital reduction) and indirect (decline in savings and investment)
effects of life-expectancy reductions. Schooling will decline on average by half. These
findings are well above previous results in the literature and indicate that, as pessimistic
as they may be, at least in economic terms the worst could be yet to come.
1
Introduction
In the time it takes to read this paper, more than 1600 people will get infected by the HIV
virus worldwide and 1000 will die due to AIDS. Seventy-five percent of the deaths will occur
*This paper was partially writen when the first author was visiting the University of Illinois at Urbana-Champaign. He would like to thank the hospitality of the department of economics and Steve Parente,
Werner Baer and Frank Shupp for the helpful discussions.
in Africa, by far the worst-affected region. Out of the 42 million persons estimated to be
living with HIV/AIDS in the world, almost 30 million live in Sub-Saharan Africa (UNAIDS
(2002)). Worst still, of the 5 million adults and children newly infected with HIV, 3.5 million
are Africans, an indication that the epidemic may not yet have reached its peak. In some
countries, such as Botswana, one out of 3 adults are infected, and the figures for Lesotho,
Swaziland and Zimbabwe are not very different. By the end of 2001 there were 12 countries
in Africa in which more than 10 percent of the adult population was infected with HIV.
It is clear today that AIDS in not only a health disaster, but a major development crisis.
There is now a large array of papers, books and newspapers articles1 dedicated to the study
of the economic consequences of AIDS in Africa (and elsewhere). The majority of them are
case studies based on household or hospital surveys, on firm or plant leveI evidence and on
government reports.
These studies point to the fact that the hardest hit people are between the ages of 15 and
49 (UNAIDS (2000)), a period of life when they are highly productive. Also to the fact that
the productivity of infected individuaIs, especially in the advanced stages of AIDS, are well
below that of a healthy worker. There is also evidence of absenteeism due to illness (e.g.,
Morris, Burdge and Cheevers (2001)) or time off to attend funeraIs; of cost increases due to
AIDS-related benefits and of reduction in agriculture output as big as 60% in some regions
of Zimbabwe (Guiness and Alban (2000). In many regions, school enrollment has declined
as children have had to leave school to care for family members and/or have been unable to
afford the direct cost or opportunity cost of staying in school.
There are few papers that consider the economic impact of HIV / AIDS at more aggregate
leveIs and very few cross-country studies. Cuddigton (1993) and Cuddington and Hancock
(1994) use modified versions of the Solow model in which fractions of the annual AIDS-related
medicaI costs are financed out of savings. Both articles assume that labor productivity of
infected workers is a fraction of that of healthy workers and that there is a loss of effective
units of labor due to the reduction of experienced labor force. Haacker (2002) simulates a
similar model for 9 of the most affected African economies. In ali these papers the estimated
impact of the epidemic on per capita GDP was found to be very modest, a long-run decline
of O to 3% in most cases.
1 See Guinness and Alban (2000) for a survey of lhe lileralure and Dixon, McDonald and Roberls (2002)
Arndt and Lewis (2000) simulate a CGE model in which AIDS affects TFP, labor pro-ductivity and public expenditures. Moreover, as in the previous case, it is imposed that AIDS-affected individuaIs do not save. They estimate that income per capita in South Africa will fall by 8% until 2010, and, not surprisingly, half this fall will be caused by re-duced savings. Finally, Bonnel (2002) estimates an structural model, using cross-country data, in which AIDS indirectly affects growth through its impact on policy and institutional variables. He finds that HIV/AIDS has reduced the rate of growth of per capita GDP by 0.7 percentage points per year between 1990-1997.2
In the present paper we introduce a channel from HIV/AIDS to long-run income that has been overlooked by the literature, the reduction of the incentives to study due to shorter expected longevity. According to the World Population Prospects, the 2000 Revision (United Nations (2000)), life expectancy at birth in the 35 highly affected countries of Africa is estimated to be, in 1995-2000, 6.5 years less than it would have been without AIDS. In Botswana, life expectancy went from 60 years in 1985 to less than 40 in 1999 while in countries such as Swaziland, Zimbabwe, Zambia and South Africa it decreased in the same period by more than 10 years.
We start from these facts to construct an artificial economy where life is finite and life cycle features of savings and education decisions play key roles. Agents decide how much education they want to acquire comparing the costs of being in school - wages forgone and tuition - with the expected return of this investment, which is the increase in wages due to enhanced skilllevels. The reduction of life expectancy - especially of the magnitude observed in Africa - decreases productive life span, and consequently the present value of the flow of wages and the return to human capital investment. Agents respond by leaving school earlier, so that average education leveI decreases. This will have a direct impact on output, as human capital is a factor of production. Moreover, the marginal productivity of capital decreases with the reduction of education, a complementary input. As savings and physical capital investment are endogenous in this model, they will both fall in equilibrium, further reducing output.
We use this model to simulate the long-run impact of the HIV/AIDS epidemics in Africa. The exploration of the general equilibrium impact, explained in the above paragraph, of
life cycle factors such as the reduction in life-expectancy is compared to the impact of channels previously explored in the literature, such as productivity /TFP reduction. The model predicts that the most affected countries will be in the future, on average, a quarter poorer than they would be without AIDS, due only to the effects of life-expectancy reduction. This estimated decrease in per capita output is well above previous results in the literature. When introducing extra channels in the model, the impact of the epidemics is even stronger, of course, but the additional impact is never of the same order of magnitude as the one we explore here. The model also estimates that, in the long run, schooling could fall to less than half of the leveIs observed before the epidemic.
The findings of this study are, to say the least, extremely worrisome. It indicates that the current catastrophic situation in Sub-Saharan Africa, or in any country where HIV/AIDS reaches similar leveIs, is not yet at its peak and the worst, in economic terms at least, is still to come. We are already observing a decline in school enrolment in affected areas. According to the 2002 Report on the Global HIV/AIDS Epidemic (UNAIDS (2002)), in Central African Republic and Swaziland it fell by 20-36%, and in parts of KwaZulu-Natal Province in South Africa, the number of pupils attending the first year of primary school was 20% lower in 2001 than in 1998, and economic hardship was the major factor. This is consistent with the channel stressed by our model, which was previously neglected by the literature. As this trend spreads across countries and regions, human and physical capital, savings and output will continuously fall, until they settle at leveIs well below those that would prevail without AIDS. The full impact, however, will mostly be felt in the future.
One possible caveat of this paper is that the probability of getting infected is not in-fluenced by education. One could think of a model in which, for instance, more educated people would have less chance of contracting HIV. Hence, when deciding their schooling leveI agents would be indirectly affecting their life expectancy and this would of course change the equilibrium of the mode!. By not exploring the link between education and infection the model simplify matters considerably and therefore our results may be regarded as a first approximation to a broader set of questions.
education. The exercises in this paper do not take these facts into account and hence assume
that the current state of the world will persist forever in the future or that the behavior of
the upcoming generations will be similar to that of the current ones.
The paper is organized in four sections in addition to this introduction. In the next section
the theoretical model is presented and in Section 3 we briefly discuss the calibration and
measurement procedures. In Section 4 the results are presented while Section 5 concludes.
2
The Model
The theoretical model - a continuous time overlapping generation model of capital
accumu-lation with exogenous technological change and two sectors, educational and goods - follows
closely Ferreira and Pessôa (2002). Agents are finitely lived and the model takes into account
life-cycle features of human capital accumulation. The skilllevel of workers is an increasing
function of schooling and the accumulation of skills is mostly done at school, outside the
labor market, although experience effects will be introduced later. At each moment,
individuaIs weigh the opportunity costs of being in school the wages forsaken plus tuitions
-against its benefit, which is the increase in the present value of wages due to higher human
capital. One of the key variables to consider in this decision is life expectancy, because the
present value of the flow of wages, everything else being the same, increases with longevity.
In addition to the one-time decision of when to leave school, at each instant of time agents
decide how much to save out of their labor and capital incomes and public transfers. Welfare
and technology functions are the same across countries. However, total factor productivity
leveIs, life span, the cost of education and infection rates are country specific. Governments
tax or subsidize education services and saving returns.
We will first present a sim pIe version of the model, and in later sections we will add an
experience effect and (a very simple form of) health expenditures. In the first case we want to
model human capitalloss due to the death of more trained workers, while in the second case
we want to investigate the impact of reduced disposable income on the consumption-saving
decision.
The utility function of an individual bom at time s who lives until period T is given by:
where c( s,
t)
is his consumption at timet
and p the discount rate. This individual has three sources of income, the rents from capital, wages and public transfer, which he uses to buy consumption goods and educational services. The individual stays in school for Ts years, works duringT
w periods and then retires forT
R =T - Ts - T
w periods.Let w( s, Ts ,
t)
be the wage at timet
of a worker born in s with Ts years of formal education, 1] the amount of education services that the student has to buy in order to be in school,q(t)
is the price of one unit of educational services in units of consumption goods, X government transfer, TH taxes on tuition and r is the interest rate. The budget constraintof an individual is then:3
(2)
where
Ty
=Te
+
Ts,
andTe
is the childhood, the period of life individuaIs stay at home. The above expression says that the present value of total consumption and tuition costs should be equal to the present value of wages and transfers. A distortion TH is imposed on the totalcost of the educational services, 1]q. We interpret TH not only as taxation of educational
services, but as the end result of many possible distortions or incentives to human capital accumulation, such as credit constraints or public schools, that will make the social and private marginal rate of return of education differ.
Following Mincer (1974), we assume that w(s, Ts ,
t)
=w(t)é(Tsl
wherew(t)
is the wage of a worker with no education. We assume thatq/(T
s )>
O,q/'(T
s )<
O and <;&(0) = O. Inthis formulation, though, a worker with Ts years of education is
é(Ts
l more productive than an unskilled worker of the same cohort.The model also assumes a common exogenous technological change at a rate g.4 The model, of c ourse , will allow for transitions and convergence, although we will only work at steady-state growth paths. In this balanced growth path it will be the case that
w(t)
=we
gt,3Note that in the intertemporal budget constraint the rent term is canceled out.
as well as X(s,t) = xegt and q(t) = qegt .
The problem of individuaIs is to pick Ts - the optimal time to leave school - and the sequence of consumption in order to maximize (1) subject to their intertemporal budget constraint
(2).
In taking the educational decision, individuaIs consider that the longer they stay in school, the shorter their productive life, Tw , as retirement age TR is exogenous.Moreover, in addition to the foregone wages there is the direct cost of school tuition. U sing w(t) = wegt , q(t) = qegt , and after some simplifications, we can write the optimal choice of
education as:
max wef(Ts) - 7Jq .
{
e-(r-g)Ts _ e-(r-g)(T-TR) 1 _ e-(r-g)Ts }
~ r-g r-g
The expression to the right gives the present value of total tuition costs, while the one to the left gives the present value of labor income.
From the first order condition of this problem at a balanced growth path we obtain:
1 - e-(r-g)Tw
Wé(Ts)q,'(Ts ) = Wé(Ts)
+
7Jq.r-g
(3)
The expression above equates the present value of staying in school one additional unit of time to the opportunity cost of not working plus the tuition cost at the stopping time.
Some intuition can be obtained from a partial equilibrium analysis (i.e., simulation) of the above expression. Everything else being the same, decreases in Tw imply that individuaIs will
pick smaller Ts . This means that if the productive lives of agents decrease for some reason, it will be optimal for them to reduce the time in school, as they will benefit from the return of this investment for a shorter period. For our purposes here, if Tw falls with T, decreases in
longevity will imply less schooling, which means that labor force productivity will diminish. Rence the link between the AIDS epidemic and education: the spread of the disease and the huge number of deaths imply a severe drop in life expectancy in a vast number of African countries. At some point in the future, if not now, this will reduce productive life span and so the return to human capital investment and education.
xe
g' and
q(t)
=qe
g', the expression for initial consumption can be shown to bec(s s)
(1 - e-pT) 1- - ' - = - - {wef(Tsle-(r-glTs
(1 -
e-(r-glTw )(4)
egs p r - 9
-(1
+
TH)1jq(1 -
e-(r-glTs ) e-(r-glTc+
X(1 -
e-(r-glT)} .The right- hand term is the individual's total wealth at the time of birth and
p/
(1 - e-pT ) is the propensity to consume. This expression is useful for the derivation of aggregate consumption, which is done by adding the individual consumption over cohorts:11'
C(t)
= -c(s, t)ds.
T '-T(5)
Assuming that initial consumption increases at a rate g, so that
c(
s, s) = xegs, we obtain, after substituting(4)
into(5),
that:c
C(t)
=-,-V--",---.,. {wef(Tsl e-(r-glTy(1 _
e-(r-glTw)eg' T(r -
g)
(6)
-(1
+
TH)1jq(1 -
e-(r-glTs ) e-(r-glTc+
X(1 -
e-(r-glT)} .where v, =
p/
(1 - e- pT ) X (1 - e-(g-r+plT) /(g -
r+
p).
This expression says that aggre-gate consumption in each period is a fraction of the permanent income of the representative agent. The latter, in its turn, is a function of wages, transfers and school tuitions.As for the production side of the model, it is assumed two sectors, one that produces consumption and investment goods and another that produces educational services. Let output
Yí
in the Goods Sector be a function of physical capital services KI and skilled laborHI according to:
where AI is the sector total factor productivity and eg
' is the exogenous technological progresso
As was seen, the Mincerian formulation implies that skilled labor is given by:
where LI is raw labor.
First, in order to assess the isolated impact of changes in mortality and life expectancy, we assume no impact of the epidemics on productivity, as in the equation above. A second hypothesis follows Cuddington and Hancock (1994), among others (e.g.,Hansack (2002)). The main idea is that the epidemics may have a negative effect on the "quality" of the labor force, which depends of workers' health and not only on education and experience. A simple proxy for reduced health is the proportion I of workers infected with HIV (or AIDS). In other words, there is a productivity decrease in the labor productivity of infected workers, and the overall impact on the economy depends on the prevalence rate of HIV/AIDS in the country. Hence, we posit in this case that effective units of labor be given by:
Hi =
r
(r)
Lié(Ts ),ri
<
o, r(o)
= 1, i = 1,2.A third alterna tive formulation, explained in detail in section 4.2, assumes that in addition to formal education, labor productivity is also affected by the experience (i.e., time in the labor market) of workers. In this case, we have that
where À gives the percentage increase in labor productivity caused by increases in experience. The problem of first-sector firms is:
where rI is the rental price of capital and WI is the wage rate, both in the first sector. Profit
maximization of the firm gives
where
k = KI
I - egtílLIef(Ts)'
(7)
is the stock of capital in efficiency units. In the above formulation, íl stands either for
r
(I),
The educational sector employs only labor and no capital. This is a simplification of the
fact that the production of educational services is labor intensive. For instance, in the last
ten years, according to the Survey of Current Business, published by the US Department of
Commerce, the average capital share in income of the educational services sector was only
6% in the USo Most likely, the number for Africa is even smaller. We also be assume that
there is no technological progress in the sector.5 The production function of the sector is:
and wages are
We assume that at each instant a cohort of size ~ is born. Consequently, the total population is equal to 1. Let us call Ns , Nw , and NR respectively the population of students, workers and retirees. We have that the student-population ratio is proportional to the ratio
of years of education to life span:
Ns = N
s = Ts .
N
T
Likewise, we posit that:
N
w
= TandNRT
w
Finally, government budget constraint at each period is given by:
where TK is tax rate on capital returns.
2.1
Long-Run General Equilibrium
The following equations describe the long-run equilibrium of this economy along the balanced
growth path.
Letting
h
be the fraction of the total labor force employed in the goods sector (so thatLl
=hN
w ), the goods market equilibrium is:(8)
where c is given optimally by equation (6) after substituting in the expression for X.
The equilibrium in the market for educational services is:
(9)
A third condition is given by the equilibrium in the assets market, which implies that
(10)
Fourth, free labor mobility across sectors implies equality of wages in sectors one and two, both in units of good one:
Under a balanced growth path this last equation simplifies to
(11)
Finally, we need that individuaIs pick Ts optimally:
Wé(Ts )
q/(T
s ) - 1 - (1+
TH)1jq = O.{
I - e-(r-g)Tw }
r-g
(12)
3
Calibration and Measurement
exerclses.
An important feature of the model is that instead of assuming linear returns to educa-tion as it is often done, we assume diminishing returns, as this seems to be the case when comparing micro estimates across countries. Rence, the function q,(Ts ) is given by:
"'(1'< )
= _()_T,I->P.'Y s 1_1jJs
(13)
and is taken from Bils and Klenow (2000). Following these authors, we have 1jJ = 0.58 and () = 0.32. For the US calibration we assume that
h,
Ts , T, g, Q, r and 8 are observable andtheir values are obtained from usual sources such as the NIPA and the World Bank.6 We
then solve the model in order to obtain the values of AI, &, 1JQ, p, and taxes, also using
~
investment ratio information in the Summers and Reston database to estimate the physical capital stock.
To calibrate Tw - which is equivalent to the calibration of TR , assumed to be exogenous
- we use population and labor force data from the World Development Report (World Bank 1990) so that the model's value for
Nw Tw
N
T
reproduces the data.7 In other words, we use data on labor force participation, Nw IN, and longevity, T, to obtain Tw and then TR . Rence, in this model the ratio of working time to
life span is equal to the ratio of labor force to total population.
As for the African countries, we assume the same functional forms and that the values for (), 1jJ, p, Q and 8 are those calibrated for the USo Moreover, g, r and A2 are also equal
across economies.s Using data from the same sources for the observable variables, and the same procedure as above to find Tw and TR , we solve the model for AI, 1JQ, l2, TH, TK and
k. Once these parameters are estimated from the model, it is possible to simulate the model for changes in exogenous parameters such as T, I and taxes.
The calibration of the
r
function will be discussed in Section 4.1 and that of the experience factor in Section 4.2.6For lhe record: h = 98.4%, Ts = 11.89, T = 76, 9 = 1.36%, Q = 1/3, r = 4.5% and b = 6.6%.
7We assume that the daily shift does not vary across economies.
4
The pure life-expectation effect
In the first group of simulations we assume that the only channel from HIV / AIDS to long-run income is through its impact on life-expectancy. As already said, reductions in the latter decrease the returns to the investment in education and so the long-run leveIs of human capita and output.
In the simulations we assume that African countries were in a given steady-state growth path in recent past and we examine the long-run impact of changes in exogenous parameters. Hence, we basically compare steady states. We first assume that 1985 data correspond to the initial steady-state growth path. At this point the impact of the HIV/AIDS epidemics on the continent was still very low, with no effect for instance on longevity.g
In the present experiment, we keep parameters constant (such as government policies and productivity) at the 1985 measured values, but change life expectancy numbers for those of 1999. This gives us new long-run values of endogenous variables such as output and schooling assuming that life expectancy will remain at the 1999 values. As already commented, because of the epidemics, in many countries the 1999 numbers are well below those of 1985. For instance, in Botswana, Lesotho and Zimbabwe, 3 of the worst affected countries, life expectancy went from 60 to 39, 56 to 45 and 56 to 40, respectively, between 1985 and 1999. In this last year, the prevalence rate of HIV (
%
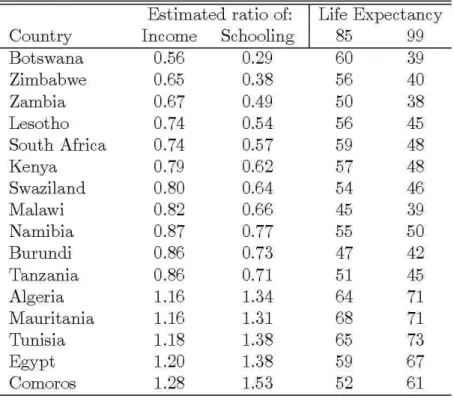
of adults infected) in these countries was, respectively, 36, 24, and 25 percent.Table 1 below presents the results in terms of 1985-1999 ratios for income per capita and schooling (as well as life expectancy) of some chosen countries
The first nine countries in the table had in 2001 adult infection rates at or above 15 percent, and are the most affected countries in the world by the HIV epidemics. As one can see, the long-run impact of AIDS in these economies may in the future be very dramatic. In Botswana, the worst-infected country in the world, the model predicts that income per capita will be only 56 percent of what it would be if its life expectancy had not dropped from 60 to only 39 years between 1985 and 1999. In other 4 countries, income will be more than a quarter below its 1985 trend, and of the 45 African countries for which we have data, in 21 of them output per capita trends will decrease. On average, the model predicts that the 9 most highly affected countries will be in the future 26.3 percent poorer than they would
Table 1: Long-Run Variations of Selected Varibles Estimated ratio of: Life Expectancy
Country Income Schooling 85 99
Botswana 0.56 0.29 60 39
Zimbabwe 0.65 0.38 56 40
Zambia 0.67 0.49 50 38
Lesotho 0.74 0.54 56 45
South Africa 0.74 0.57 59 48
Kenya 0.79 0.62 57 48
Swaziland 0.80 0.64 54 46
Malawi 0.82 0.66 45 39
Namibia 0.87 0.77 55 50
Burundi 0.86 0.73 47 42
Tanzania 0.86 0.71 51 45
Algeria 1.16 1.34 64 71
Mauritania 1.16 1.31 68 71
Tunisia 1.18 1.38 65 73
Egypt 1.20 1.38 59 67
Comoros 1.28 1.53 52 61
be without AIDS.
The decrease in per capita output predicted by the model is well above previous results
in the literature. For instance, Haacker(2002) predicts only a 3.2 percent per capita GDP
decline in the long run in Botswana (but 10 percent in the medium run) and 2 percent in
Lesotho. Cundigton(1993) predicts that, under his most plausible scenario, per capita GDP
in Tanzania will be only 3 percent smaller with HIV than without it. Both authors work
with modified Solow models. Arndt and Lewis(2000), using a CGE model, predict that
South African output per capita will be 7 percent lower than it would be had it not been
affected by HIV. In contrast, Bonnel(2000) estimates cross-country regressions and finds that
HIV/AIDS reduced the growth rate of per capita income by 0.7 percentage points per year
in the 1990-97 period. If this falllasts for many more years, the impact on the leveI of GDP
per capita would be sizable. For the period he studies, however, the impact on South Africa,
for instance, is only one-third of that in Table 1. Although the channels vary, none of these
models exploit the influence of HIV/AIDS on life cycle decisions as we do.
The direct cause for the decrease in relative long-run per capita income in our simulation is
in the incentives to study are such that, everything else being the same, the model estimates that educational attainment in Botswana will be less than 30 percent of what it would be without the HIV/AIDS crisis. Although this is an exaggerated number, in 15 countries it was estimated that schooling will decrease by more than 25 percent. As said before, decreases in expected life span of the magnitude observed in Africa imply shorter working life and so a fall in the returns to education investment and an increase in the opportunity cost of staying in school. Hence, the estimated decline in human capital.
It is important to note also that the fall in education also reduces incomes through its impact on physical capital. This is so because the marginal return to physical capital decreases with education, and consequently investment. From our simulations, we find that the long-run k leveIs of Botswana, South Africa and Lesotho will be only 57, 70 and 65 percent, respectively, of the leveIs implied by the 1985 data.
Note that in countries where the HIV/AIDS epidemic is under control, the model predicts that income will be above its 1985 trend. In the case of the three north African countries in the table above, per capita income will be in a 15
%
higher trend, while schooling more than 34%
higher.Is this the worst-case scenario? Not for all countries. We repeated the above simulations, but instead of the 1999 figures we used the UN 2000-05 life-expectancy projections as the new steady state. In countries where most probably because HIV/AIDS was already wide-spread in 1999, differences existed but were not dramatic. But for those where the epidemic expansion may have started more recently, or AIDS prevalence is well below its peak, the model forecasts are more pessimistic than those in Table 1. This is so because in these cases the projected life expectancy is well below the 1999 figures. Two such countries are Lesotho and Swaziland, where predicted output per capita is 15 and 9 percent, respectively, below those in Table 1.
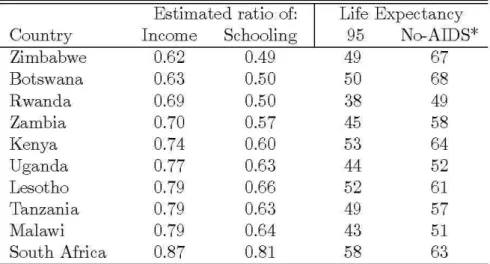
Table 2: Long-Run Variations of Selected Varibles Estimated ratio of: Life Expectancy
Country Income Schooling 95 No-AIDS*
Zimbabwe 0.62 0.49 49 67
Botswana 0.63 0.50 50 68
Rwanda 0.69 0.50 38 49
Zambia 0.70 0.57 45 58
Kenya 0.74 0.60 53 64
Uganda 0.77 0.63 44 52
Lesotho 0.79 0.66 52 61
Tanzania 0.79 0.63 49 57
Malawi 0.79 0.64 43 51
South Africa 0.87 0.81 58 63
*
2000- 2005 estimated averagesIn looks natural to use the "no-AIDS" data to compare long-run leveIs. In this sense we
have a counterfactual exercise in which we would compare a reality with, say 46 years of
life expectation and 25% adult infection rate (as in Swaziland) with one where everything is
the same but life expectancy is 63 years and no one is infected with the HIV virus. This is
exactly what is done in Table 2 below.
In performing this exercise, we used 1995 data, which is the last year for which there
are complete data for enough countries. The "no-AIDS" life expectation corresponds to the
1995-2000 average.lO The results here show a picture similar to that in Table 1, although
there are important differences. The model predicts that the steady-state path of per capita
income in Zimbabwe, for instance, implied by 1995 longevity numbers is only 62% of the
leveI that would prevail in the absence of AIDS, the same decrease as before. In Rwanda,
however, the dropp is much bigger than before, as the predicted fall in Table 1 was of only
12%. The average reduction of the highly infected countries for which we have data (all but
Swaziland) is 27%. The correct interpretation of this result is that because of the AIDS
epidemic these countries will be permanently poorer than they would be without the HIV
epidemic. Although they will grow at the steady state rate and so be richer than today in
the long run, they will be a quarter as poor as they would be without AIDS. Analogous
l ONote that life expectancies in 1995 of affected countries are well above the 2000 numbers, 80 that
interpretations can be applied to most simulations in this paper.
The similarity of results may imply that assuming in the first place 1985 data as a
stationary path was not too far from reality. We performed other variations of the above
simulations (e.g., changing 1999 data in the first exercise for 2000-2005 projections of life
expectation with AIDS) but results are similar. All in all, the model predicts a dramatic
decrease in long-term per capita income due to the decline in the returns to education
investment brought about by shorter life expectation. As human capital falls, investment,
savings and physical capital in equilibrium will also fall, hurting even further per capita
lncome.
4.1
Life-expectation and productivity effect
Part of the evidence on production and productivity reduction due to AIDS comes from
case studies. One of the channels stressed is absenteeism. For instance, Morris, Burdge,
Cheevers (2001) find that, on average, infected workers of a sugar mill in South Africa
incurred on 55 additional days of sick leave in the last 2 years of their life. In Burkina Faso,
net revenues from agriculture production in AIDS-affected household usually decreases by
25 to 50 percent (Guinness and Alban (2000)). This study also has evidence of reduction in
agricultural output in AIDS-affected households in Zimbabwe, going from 61
%
in the case of maize to 29% in the case of cattle.There is also evidence from company leveI studies. HIV-related cost increases are found
to be caused, in most studies, by absenteeism due to illness, time off to attend funeraIs,
or because workers in poor health come to work but are unable to perform at usual leveIs.
One such paper is Aventin and Huard (2000), who studied companies in Ivory Coast and
found that for an HIV prevalence of 10 percent among these firms' workers, costs related to
HIV/AIDS could be as high as 10 percent of the total labor cost. According to Guinness
and Alban (2000), AIDS-related benefits in South Africa could rise from 7% of salaries in
1995 to 19% in 2005.
Haacker (2000) uses these studies to calibrate the productivity reduction due to AIDS.
In this paper, it is assumed that an AIDS incidence rate among the workforce of 1
%
reduces total factor productivity by 0.5%. This is the same as in Arndt and Lewis (2000) andCuddington and Hancock (1994), where productivity of workers with AIDS is reduced by
but productivity losses from zero to two are also considered. In our experiment we will follow closely these authors.l l The
r
function is taken from Cuddington (1993):r
(r)
= 1 - 1;"(,where
I;
is the proportional reduction in productivity of a worker with AIDS and "( is the AIDS incidence rate in the adult population. We assumeI;
= 0.5. The parameter "( corresponds to AIDS cases and therefore should not include people infected by the HIV virus without any symptoms of the disease. Numbers on AIDS prevalence alone are not available, so we have somehow to start from the HIV figures, and yet measurement here is very crude. We use Haacker's numbers, so that 10% of the HIV-positive population actually have AIDS, which seems a bit optimistic, and also 20%,12Apart from this modification, the simulations here are exactly equal to the first one of the previous section, as we substituted 1985 life expectation for that of 1999. So when comparing the current results with previous ones, we will be studying the marginal impact of productivity decrease after demographic effects have been accounted for. The results are presented in Table 3 below.
The introduction of productivity effects did not change the results significantly. When AIDS incidence is 10%, the additional estimated decline in long-run per capita income of Botswana is just 1.5%, and for the 20% case it is 3%. For this case, Lesotho has the largest variation out of ali countries in the sample, 4.2%. The impact on schooling is also small.
Note that we do not mean to say that the above results are irrelevant. They point to the fact that Lesotho will be 4 percent poorer than if it had no AIDS, due only to the decline in productivity caused by the infection. When comparing to Haacker's estimation of this same effect, our corresponding result is twice as large for Lesotho. However, our point is that those losses are very small when compared to the pure demographic effect. Even with an AIDS incidence rate of 50%, which is extremely high, the additional impact of productivity loss is
11 Labor supply in these models and in Qur study is exogenous and inelastic. Hence, the impacts on output
of absenteeism and poor physical performance are observationally equivalent, although the 10ss in output in the first case is due to fewer hours and in the second because of lower productivity.
12The median span between infection and death is estimated to be around 8 to 10 years in South Africa
(Arndl and Lewis(2000)) bul lhe direcl symploms of AIDS are mostly fell during lhe lasl lwo years of life
Table 3: Long-Run Variations of Selected Varibles with Productive Decline AIDS incidence=10% AIDS incidence=20%
Country Income Schooling Income Schooling
Botswana 0.54 0.28 0.53 0.27
Zimbabwe 0.63 0.36 0.62 0.35
Zambia 0.66 0.48 0.65 0.48
Lesotho 0.72 0.52 0.70 0.50
South Africa 0.73 0.56 0.72 0.56
Swaziland 0.77 0.62 0.75 0.60
Kenya 0.78 0.61 0.77 0.56
Malawi 0.81 0.65 0.81 0.64
Namibia 0.86 0.75 0.84 0.74
Uganda 0.85 0.69 0.85 0.70
Tanzania 0.85 0.70 0.85 0.69
Burundi 0.85 0.72 0.84 0.71
still relatively small, 6 percent in Botswana and 8 percent in Lesotho. Again, these are not
small numbers in terms of output loss and welfare, but they are 8 to 4 times smaller then
the losses due only to decrease in the returns to education brought about by life expectation
decline.
Could the order of the exercise influence the results, so that if we first introduce the
productivity effect it will come out bigger? Not much. We simulated a "pure productivity
effect" model, leaving longevity at its 1985 leve!. In this case output per capita in Botswana
would be 97 percent of its "no AIDS" scenario. In the case of Lesotho, the simulated output
loss was less than 3% of the life-expectation effect.
4.2
Life Expectancy and Experience Effect
The labor literature (e.g., Willis (1986)) usually models human capital of an individual not
only as a function of education but also as depending on time in the job market. The idea is
that workers' skills increase with repetition and on the job training, so that as time goes on
they become more efficient. Hence, given the amount of education, an experienced worker
is more productive - i.e., has higher human capital - than one that just entered the labor
market.
in the adult population. These persons are in general at their productivity prime, so that taking into account the experience channel may be important in evaluating the cost of the epidemic. In fact, in Haacker (2002) and Cuddington and Hancock (1994) human capital reduction is due entirely to the 1088 of experience by the labor force, as the death tol! of older
and more skilled workers is in general proportional!y higher than that of other age groups. We modified the basic model to introduce an experience effect. In this case the effective units of labor in the steady-state path, as seen in Section 2 is given by:
where the parameter À gives the percentage increase in labor productivity caused by a unit increase in experience. Hence, a worker with
x
years in the labor market will be exp(Àx)
more productive than one with the same education but that had just entered in the labor market.With this new specification we changed the model correspondingly, as wel! as the equilib-rium conditions and calibration. An important modification is the new first order condition with respect to education, which now takes into account the gain in productivity and so the returns of entering the labor market earlier. Instead of (3) we have:
Wé(Ts )
{((j/(T
s) -
À)
1 -
e-(r-g)Tw -I}
-r;q =O.
r-gThe individual now weighs the extra productivity gain from staying in school,
q,'
(Ts ), against the 100S, À, from not joining the labor market earlier.13We assume that À = 0.015, so that one extra year working would increase individuaIs' productivity by 1.5
%.
This number reproduces the average annual experience gain of a US worker and it is in line with similar specifications in Haacker (2002) and with estimated rates of return in Africa's manufacturing sector in Bigsten (2000). The table below presents the additional falI in per capita income, with respect to the simulations in Table 1, resulting from the introduction of experience in the modep4.1 3 Likewise, the expression for agreggate consumption has to be modified, as experience affects the
present value of the flow of wages. The term corresponding to wages in expression (6) becomes
weq:,(Ts)e-(r-g)Ty (1-e-(r-g-À)Tw ) j(r - g - ,\), but everything else remains the same.
14In other words: in Table 1 it was shown that per capita output in Botswana decreased by 44 percent
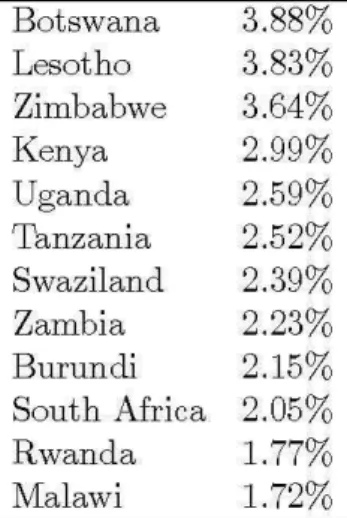
Table 4: Additional Loss of Per Capita Output Due to Experience Botswana 3.88%
Lesotho 3.83% Zimbabwe 3.64%
Kenya 2.99%
Uganda 2.59% Tanzania 2.52% Swaziland 2.39% Zambia 2.23% Burundi 2.15% South Africa 2.05%
Rwanda 1.77%
Malawi 1.72%
The introduction of the experience channel in the simulations caused relatively sizable effects. In some countries, such as Botswana and Lesotho, the model estimates that almost 4% of long-run output will be 1088 due to the reduction in human capital caused by the death
of more trained workers. This is of the same order of magnitude of Haacker's medium-term simulation but almost 8 times higher than his long-run simulation.
Given the strong effect of reduced life expectation on schooling, the introduction of the experience factor does not considerably change the amount of time individuaIs want to stay in school. As life is now shorter, the total number of years workers expend in the labor market (everything else the same) decreases, as does human capital variation due to training, hence the fall in output.15
Note, however, that although not negligible, the additionalloss of output is in most cases a relatively small fraction of that caused by the impact of AIDS on education (i.e., "the pure life-expectation" simulation), around 10 to 15 per cent for most highly affected nations. There are, however, some exceptions: in Uganda and Tanzania, out of the combined impact on human capital of lesser schooling and less experience, the latter is responsible for around 20 percent of the decrease in output per capita.
4.3
Decline on Disposable Income
Some authors (e.g., Arndt and Lewis (2000), among many) argue that there is an additional
impact of HIV on long- run income, due to the reduction of disposable income and,
conse-quently, the reduction of investment and capital stock. If we take as this literature does the
descriptive Solow model with constant marginal propensity to save, this will in fact be the
case: the reduction of income due to the re-allocation of resources to treatment and other
health-related expenditures reduces total saving proportionally and then long-run output.
However, even within the limits of the Solow model this is not a robust result, if we consider
instead that health services are simply another good that families buy. In this case savings
are not affected and there is simply a modification in the bundle consumed.
In the framework put forward here, the capital accumulation decision, whether physical
or human, depends on prospective rentability and consequently will not change if households
add new sources of expenditures to their consumption bundle. In this case the impact of
AIDS/HIV on factor accumulation has already been taken into account by the many other
channels that directly affect factors' returns. This channel may be more important if we
add credit constraints to the model or if we add a third sector, the health sector. In the
first case, investment will depend not only of future return but the availability of resources
in the present. In the second case, the reallocation of factors of production to the health
sector may impact education supply and the production of investment goods. Given that
the relative size of the health sector, even in badly affected countries, is not too big, we do
not believe that the impact on aggregate output in this case will be too relevant.
5
Governrnent Intervention
Up to this point, government behavior is entirely passive, and ali simulations assumed as
given the same set of tariffs that summarize government intervention in these economies.
Hence, while fixing the distortions to human and physical capital accumulation we are
basi-cally studying long-run scenarios where the set of institutions and policies do not change or
react to exogenous changes in, say, life expectation.
It is interesting, however, to examine how, and to what degree, public policies can offset
the decline in income and human capital observed in the above simulations.
or at least some degree of contro!. Remember that in the model TH is interpreted in a broad
sense in which it represents all factors that create a wedge between the public and private costs of acquiring education and not just a tariff on school tuition. Hence, a reduction in this parameter is not simply a tax break, but a decline of distortions to investing in education.
In a first group of experiments we decrease by 10 percent or by 50 percent the value of
TH measured from 1985 data and then repeate the exercise of Table 1.16 We then compare
a steady state with low HIV prevalence (and so high longevity) with one with high infection rates but relatively lower distortions to the accumulation of human capita!.
It is important to note that the decrease in education cost alone by 10%, keeping longevity constant, would increase median schooling in Africa by 17% and income per capita by almost 6%. Even when the life-expectancy effect is introduced in the simulation this policy may be effective, especially in those nations where HIV/AIDS prevalence is less dramatic. For instance, in Cameroon and Congo the output loss is reversed, and in the latter instead of per capita income falling by 5.5 percent it now increases by 2 percent. Overall, instead of 21 countries, only 15 would now experience long-run decrease in per capita income.
However, this is not enough to offset the product loss induced by the reduction of life expectancy in the highly affected countries, particularly those with adult infection rates above 15 percent. In this group, the average decline in per capita income was found to be 23 percent instead of 26.1 percent obtained when education distortion was not reduced. This of course is too small an improvement in the face of the overall fall in output. Even when we simulate the model imposing an extreme decrease of 50 percent in TH, this situation is not
reversed in eight economies (all the highly affected ones but Lesotho). This shows how strong life-cycle effects can be when considering long-run scenarios of the HIV/AIDS epidemic.
Tax on capital returns was introduced in the model in a standard way. Given that there is no capital factor in the education sector by assumption, changes in TK do not affect the
education decision. Hence, one could expect a priori that a policy that tries to neutralize the impact of human capital reduction on per capita income through capital tax breaks would be highly ineffective. In fact, as in the previous case, reductions in TK of 10 percent had
almost no impact on highly affected countries, the only exception being Malawi, where per capita income was 4% higher.
16In this section we set ,\ =0 and we ignore the labor-productivity effect, hence results are comparable to
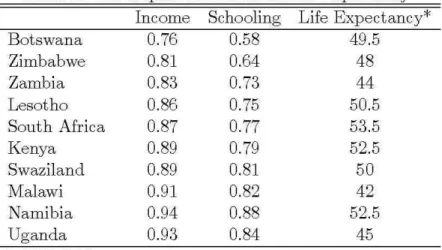
Table 5: The impact of Increased Life Expectancy Income Schooling Life Expectancy*
Botswana 0.76 0.58 49.5
Zimbabwe 0.81 0.64 48
Zambia 0.83 0.73 44
Lesotho 0.86 0.75 50.5
South Africa 0.87 0.77 53.5
Kenya 0.89 0.79 52.5
Swaziland 0.89 0.81 50
Malawi 0.91 0.82 42
Namibia 0.94 0.88 52.5
Uganda 0.93 0.84 45
*
1985-1999 averageNote, however, that the results are not uniformily bad. The median investment rate increased by 11 % in Africa and per capita physical capital by 17%. This means that in some countries the 10 percent tax break was able to offset the effect of the life expectation decline on incomes. For instance, in Mali, an output loss of 5 percent is reversed to a 6 percent gain, so that its long run income with AIDS but lower taxes is now higher than the original one. Similar results were obtained for Cameroon, Burundi and Central African Republic. The explanation has to do more with the original leveI of tariffs than to HIV/AIDS prevalence: with exception of Mali, the 3 other countries have adult infection rates above 11 percent. Their measured capital tax rates are, however, extremely high (above 50% in all cases) so that the 10% reduction is very large in absolute terms and induces a considerable boost in investment.
As one might expect from previous simulations, public policies that are able to increase long-run life expectation above the current numbers will have a large impact on income and schooling. In Botswana, for instance, the model predicts that if expected life span in the future is 10.5 years above current figures, schooling will fall to only 60% of what it would without HIV/AIDS, and this will push income to 76% and not 56% of the no-AIDS scenario. The average long-run per capita income loss of the nine highly affected nations would be now only 13%. Of course, the actual medium-term prospects are discouraging, as predictions (UN (2002)) are that, if anything, life expectation will further fall in the future.
One must be extremely cautious with the results of this section. Government behavior in the model is very stylized and is meant to capture not only actual tax but other institutional barriers (e.g., credit constraint ) that influence individuaIs' decisions to invest in education or physical capital. If one interprets TK and TH merely as taxes, one can conclude that
in face of the epidemic the proposed policy here is reduction of public expenditures, when most probably the opposite will be needed. We, however, would rather interpret these results as indicating that for some countries, because the expansion of HIV is still low or because distortions to factor accumulation are too high, the reduction of these distortions may partially offset the 1088 of output due to life cycle factors. These are macroeconomic
implications of the model, and as the results in Table 5 show, the best policy against the development impacts of AIDS is more on the lines of health and educational measures that reduce infection pace and increases survival chances of HIV-positive individuaIs.
6
Concluding remarks
In this paper we use an overlapping generations model with education decision to study the long-run impact of the HIV/AIDS epidemic. Our results show that the life-expectancy effect is very strong and apparently dominates other channels that the literature has examined. Smaller expected productive life represents a reduction of the return to education investment and so also of the long-run leveI of human capital. This, in turn, decreases the return and consequently the equilibrium leveI of physical capital stock and savings. The final result is a strong decline in output per capita.
the HIV/AIDS epidemic. Once they are taken into account, their estimated impact on per
capita income is way above previous results. The model predicts that, on average, the group
of countries where the epidemic is stronger will be in the long run a quarter as poorer as
they would be without AIDS, only because the life-expectancy effect. The simulations for
Botswana and Zimbabwe are even more dramatic. Of course, adding productivity reduction,
decreases of average experience of the labor force and the transfer of resources to potentially
less productive activities, some of the channels stressed by the literature, output loss in the
long run will be even larger than that, but their isolated impact is less dramatic.
One possible caveat of our simulations is the use of steady-state comparisons. One can
argue that various demographic and macroeconomic phenomena were taking place by 1985
(or by any other date we choose), so that most of the African economies we study were
very distant from a balanced growth path, something that could affect the calibration of the
mode!. However, taking different years as the baseline and also changing the counterfactual
scenario did not significantly modify the results, an indication that this problem does not
noticeably affect the results. One can also criticize the hypothesis of perfect credit markets,
dearly inadequate to Africa. The introduction of liquidity constraints in the model would
make things even worse, as it would add another difficult to the financing of human capital
investment. In this sense, we may well be underestimating the impact of AIDS on education.
Most of the countries where AIDS has spread practically unchecked are already extremely
poor, so their development prospects are even more pessimistic, especially if the current
situation persisto Moreover, HIV/AIDS is expanding rapidly in Eastern Europe and Central
Asia, reaching some of the most populous regions and countries in the world, such as China
and India. In the latter, dose to four million people live with HIV. Hence, if the dramatic
situation in Africa serves as a leading indicator, and even taking the numbers in the present
paper as a worst-case scenario, unless a much stronger prevention effort at the global leveI is
launched, in the near future there will be an economic, social and health tragedy of unheard
dimensions in modern times. Again, and as pessimistic as it may sound, the worst may still
A
Appendix: Simulation of the Model
The main simulations of the model involved evaluations of the sensitivity of income, schooling and other endogenous variables to modifications in the parameter values. In particular we are interested in evaluating the relative impact of changes in life expectancy (and taxation in Section 4.4) keeping fixed all other parameters (in particular, when we change T we hold
T;
constant). In this exercise we assume that the economy is open, so that we consider r = log(1.045) as given. We then solve (12) to get Ts (schooling) and, consecutively: (10) forh,
(10) for k, (11) for q, and the model's value for output(14)
for per capita income. Finally, the difference between internaI output and domestic income is given by the solution of (8), which is not necessarily zero.
However, before performing the simulations of the model we obviously need to calibrate or measure, for each economy, parameters such as sectorial productivity ( AI and A2 ), factor
shares, education and capital taxes, preference parameters, etc. This is done in two steps. First, given that we have abundant information about the American economy, and given the tradition of assuming invariant preferences and technology across countries, we estimated some relevant parameters using data from the US and use them for the African economies. For the US, we consider the following parameters as observable:
l2,
Te, Ts, T
w ,T,g,
Q,r,
8,
(J.The share of labor in the educational sector, l2, was obtained from the NIPA and IS
the average for several years of the ratio of Full-Time Equivalent Employees in Educational Services to the Total Full-Time Equivalent Employees and was found to be 1.6%. The capital share in the goods sector was set equal to one-third, which is the number found in the NIPA. The interest rate was set at 4.5%, depreciation at 6.6%,17 the exogenous growth rate 9 equal to 1.36% a yearl8 and the investment-output ratio to 0.21, the average value for the variable
17 This is a long-run average for the investmentj capital ratio, as given by NIPA, both evaluated at market pnces.
in the Summers and Heston database from 1975-1985. Ts for the US and all economies corresponds to data on years of schooling attained by the working-age population from the Barro and Lee (2000) database. As said in Section 3, The function
q,(T
s ) is taken from Bils and Klenow (2000) and following their calibration, we have 1j; = 0.58 ande
= 0.32.For the calibration of the time spent in the job market, Tw - which, given the assumption of exogenous retirement life, is equivalent to the calibration of TR - we use population and
labor force data from the World Development Report (World Bank 1990) to calibrate TR
such that the model's value for
Nw Tw
N
T
reproduces the data. In other words, in this model the ratio of working time to life span is equal to the ratio of labor force to total population. We use data on Nw /N and T to obtain
Tw and TR This procedure is also employed for the African economies.
For the benchmark economy, the US, there were six parameters left to be found:
which are estimated solving equations (9), (11), (8) and (12), (14) and the investment-output ratio
(8
+
g)ky (15)
considering y and i/V as observable. Both were obtained using updated Penn World Table Mark 6.0 data for the year 1985. The first step of the calibration procedure is done.
In the second step we assume that the economies share with the US the same preference, technology and return to education parameters. Hence, the respective functional forms and the values for the following exogenous parameters:
{e,1j;,p,a,8} ,
are those calibrated for the USo Moreover, g, r and A2 are also equal across economies. In
the last case, Given that the educational sector almost only employs labor, é(Ts ) already controls for TFP differences in this sector.
solve (9), (10), (8), (12), (14), and (15), for
{A
1,1)q,TK,TH,12,k}.In order to identify TK we assume that the the interest rate, free of distortion and risk,
is the same across economies. Consequently, we are assuming capital mobility. Given that
we do not have data for the difference between internaI output and domestic income, we are
implicitly assuming, when employing (8), that the net externaI debt is zero
References
[1] Arndt, C.and Lewis. J .D. 2000. "The Macro Implications of HIV/AIDS in South
Africa: A Preliminary Assessment," Draft, World Bank.
[2] Aventin, L. and Huard, P.2000. "The Costs of AIDS to Three Manufacturing Firms
in Côte d'Ivoire," Journal of African Economics 9(2): 161-188.
[3] Barro, R and J. Lee 2000. "International Data on Educational Attainement Updates
and Implications,". NBER Working Paper n. 7911.
[4] Bloom, D. E. and Mahal, A.S. 1997. "Does the AIDS Epidemic Threaten Economic
Growth?," Journal of Econometrics 77(1): 105-124.
[5] Bigsten, A., et alli 2000. "Rates of Return on Physical and Human Capital in Africa's
Manufacturing Sector," Economic Development and Cultural Change 48(4): 801-27
[6] Bills, M. and P. Klenow 2000. "Does Schooling Cause Growth?," American
Eco-nomic Review 90(5): 1160-1183.
[7] Bonnel, R.2000. "HIV/AIDS: Does it Increase or Decrease Growth m Africa?",
Mimeo, World Bank.
[8] Cuddington, J. T. 1993. "Modeling the Macroeconomic Effects of AIDS, with an
Application to Tanzania" The World Bank Economic Review 7(2): 173-189.
[9] Cuddington, J. T. and Hancock, J. D. 1994. "Assessing the Impact of AIDS on the Growth Path of the Malawian Economy," Journal of Developing Economics 43:
[10] Dixon, S.; McDonald S. and Roberts, J. 2000. "AIDS and Economic Growth: A
Panel Data Analysis," Mimeo, The U niversity of Sheffield.
[11] Dixon, S.; McDonald S. and Roberts, J. 2000. "The Impact of HIV and AIDS
on Africa's Economic Development," BMJ 324: 232-234.
[12] Ferreira, P.C. and Pessôa, S.A 2002. "The Costs of Education, Longevity and the
Poverty of Nations," Mimeo, Fundação Getulio Vargas.
[13] Guinness, L and A. Alban, 2000. "The Economic Impact of AIDS in Africa, A
Review of the Literature," (UNAIDS background Paper for the ADF 2000).
[14] Haacker, M. 2002. "The Economic Consequences of HIV/AIDS in Southern Africa,"
IMF Working Paper.
[15] Mincer, J. 1974. Schooling, Experience , and Earning, National Bureau of Economic Research, distributed by Columbia University Press.
[16] Morris, C, D. Burdge and E. Cheevers 2001. Economic Impact on HIV Infection on a Cohort of Male Sugar Mil! Workers in South Africa from the Perspective of Industry,
Mimeo, Univesity of Brithish Columbia.
[17] Parente, S and E. Prescott, 2001, Barriers to Riches, The MIT Press, Cambridge,
Massachusetts.
[18] UNAIDS 2002. AIDS Epidemic Update.
[19] UNAIDS, 2000. Report on the Global HIV/AIDS Epidemic.
[20] UNAIDS,2002. Report on the Global HIV/AIDS Epidemic.
[21] United Nations Population Division, 2001. "World Population Prospects: The
2000 Revision," New York, NY.