S
PE CTRUM
R
E QUIRE ME NT
E
STIMATION F OR
IMT
S
YSTE MS IN
D
E VE LOPING
C
OUNTRIE S
Md Sohel Rana and Een-Kee Hong
Department of Electronics and Radio Engineering, Kyung Hee University, Republic of Korea
A
BSTRACTIn this paper we analyze the methodology developed by the International Telecommunication Union (ITU) for estimating the spectrum requirement for International Mobile Telecommunications (IMT) systems. The International Telecommunication Union estimates spectrum requirements by following ITU-R-Rec.M1768. Although this methodology is adopted by ITU-R, there are discrepancies for estimating the spectrum requirement for developing countries. ITU estimates the spectrum requirement by considering technical and market parameters that were provided by the most developed countries with high income and high development index. Developed countries have a very rapid expansible telecom market due to the high level of penetration, dominant user density and usage of high-volume multimedia services. In contrast, developing countries use less bandwidth-intensive services such as voice communication, low rate data, low and medium multimedia. However, while the input parameters are adequate for developed countries, they do not reflect the status of developing countries. For this reason the ITU spectrum estimation overestimates the exact requirements of spectrum for IMT systems for developing countries. This paper presents an approach based on the technical and market related parameters, which is thought to be applicable for overcoming the shortcomings of the current ITU methodology in estimating the spectrum requirement for developing countries like Bangladesh.
K
EYWORDSInternational Mobile Telecommunications (IMT), Radio Access Technique Groups (RATGs), Spectrum Estimation, Spectrum Management.
1.
I
NTRODUCTIONservice classes offering packet traffic. The methodology is applicable to both circuit and packet switch-based traffic and can accommodate multiple services. The Report ITU-R M.2072 [4] provides a summary of the market analysis and forecast for the evolution of mobile markets and services for the future development of IMT systems and derives market related parameters for the years of 2010, 2015 and 2020. To calculate the spectrum requirements, the report analyzed data from thirty countries and organizations and provided typical data. Bangladesh was one of the developing countries analyzed. In 2004, the cellular mobile penetration rate in Bangladesh was only 3.7%, compared to 68% in Japan and 86% in Republic of Korea in roughly the same time frame.
It is obvious that spectrum requirements for cellular mobile communications are directly proportional to the size of the telecommunication market. The market size of IMT systems can be estimated from many kinds of parameters. For example, the total population is an important driver of cellular penetration: higher population density lowers the cost of service delivery. Telecommunication growth is also highly correlated with economic indicators such as the GDP, GNP and the overall economic development of a country. Income and literacy rate are the key market parameters for market estimation, since they can be used to approximate the average citizen’s ability to buy mobile telecommunication services. The technology available to users at a certain point of time also influences the market because new technologies lead to new services and create demand.
ITU-R-Rec.M1768 estimates the spectrum requirements based on technical parameters such as the cell area, application data rate, radio parameters, population coverage percentage and market parameters like user density, session arrival rate per user, mean service bit rate, average session duration, market settings and mobility ratio are considered in Reports R.M2072, ITU-R.M2074 and ITU-R.M2078. These parameters are typically based on the data provided in the most developed parts of the world where the saturation level of market development may be reached earlier than the global market and where user expectations are continually increasing for their consuming capability with regard to the variety of multimedia services and applications. Due to differences in market development, the input parameters should be interpreted differently for developing countries at different time intervals. Thus the technical and market parameters have to be changed to estimate the spectrum requirements for developing countries. This paper presents an acceptable approach to overcome the shortcomings of the available ITU spectrum estimation methodology that can be applicable to developing countries in order to avoid overestimating the requirements. It also proposes a scenario for spectrum planning for IMT Systems for a developing country like Bangladesh in terms of increasing wireless communication traffic.
The remainder of this paper is organized as follows. Section 2 gives an overview of the ITU-R spectrum estimation methodology and its technical and market parameters. Section 3 presents an approach for estimating the spectrum requirement for developing countries by using relevant technical and market data for Bangladesh. Section 4 explains the spectrum requirement estimation for Bangladesh and compares the obtained result with the spectrum requirements forecasted by ITU. Finally, the proposed method and its results are summarized in section 5.
2.
L
ITERATUREREVIEWfor IMT 2000 and IMT advanced systems. According to Chung, Lim, Yook and Park (2007) who forecasted spectrum requirement based on the Korean communication environment, they have shown that in the case of spectral efficiency using higher modulation and coding schemes, the spectrum requirement of IMT advanced is approximately 2700 MHz. When applying 2x2 multiple-input multiple output (MIMO) antenna system, it is approximately 1500 MHz. When applying 4x4 multiple-input multiple output (MIMO) antenna system, it is approximately 1050 MHz. In 2013, a new model for spectrum estimation has been commissioned by the GSM Association to estimate future spectrum requirements for different countries and mobile markets by taking a theoretical approach, the starting point of the model is the existing number of base station sites within a given market and scope for future site densification. By this methodology they estimate spectrum requirement for four countries and the preliminary results indicate a total spectrum of 1939 MHz will be required for USA, 2074 MHz for UK, 2080 MHz for Brazil and 1844 MHz for China.
3. SPECTRUM REQUIREMENT CALCULATIO METHODOLOGY
OF ITU-R:
A generic flow chart of the ITU spectrum requirement estimation methodology for IMT systems is shown in Fig.1. This methodology follows a deterministic approach starting from the market expectations and ending in the final spectrum requirements of IMT systems. The terms service category, service environment, radio environment, radio access technique group and related parameters are described in this section.
Fig.1. Flowchart of ITU spectrum estimation methodology
3.1. Technical Parameters
3.1.1 Service categories
A service category (SC) is defined as a combination of service type and traffic class as shown in Table1. The traffic class concept is based on the IMT systems QoS classes as defined by ITU-R Rec. M. 1079-2. Based on this recommendation, the conversational and streaming classes are served with circuit switching while the interactive and background classes are served with packet switching. The combinations of service types and traffic classes lead to the 20 service categories.
1: Definitions: Service Categories, Service Environment, Radio Environment and RATG
2: Analyse the collected market data
4: Distribute traffic among RATGs and within each RATG
3: Compute the traffic demand by service environments and service categories
5. Calculation of required system capacity for circuit switch and packet switch traffic
Table 1. Service categorization
3.1.2. Service environment
A service environment is a combination of the teledensity and a service usage pattern. Teledensities describe the user density in different areas. Three types of teledensities are considered : dense urban, sub-urban and rural. Service usage patterns such as home, office and public areas are categorized according to areas where users get services. Six service enviornments are used in this methodology as listed in Table 2 [4].
Table 2. Identification of service environments
Service usage pattern Teledensity
Dense urban Sub-urban Rural
Home SE1 SE4 SE6
Office SE2 SE5
Public area SE3
3.1.3. Radio environments
Radio environments are characterized by two parameters: cell area and population coverage percentage. The cell area of a radio environment may vary depending on the teledensity [7]. A cell is the area covered by a base station. The cells can be classified according to their size as macro, micro, pico and hotspot cells. The cell area largely depends on the user density, type of service and transmitter output power and has a direct impact on the traffic volume and spectrum requirements. It is also closely related to other radio parameters such as the application data rate and the minimum deployment per operator per radio environment.
3.1.4. Radio access technique groups
●RATG 1: Pre-IMT systems, IMT-2000 and its enhancements. This group covers the digital cellular mobile systems, IMT-2000 systems and their enhancements.
● RATG 2: Systems beyond IMT-2000 (e.g., new mobile access and new nomadic/local area wireless access), but not including systems already described in any other RATGs [4].
3.1.5 Area spectral efficiency
The spectral efficiency is an important parameter for converting the capacity requirements in terms of bit/s/cellto the spectrum requirements in Hz. If the spectral efficiency is increased, the unadjusted and final spectrum requirements decrease and vice versa [7].
Traffic Class/Service type Conversational Streaming Interactive Background
Super-high multimedia SC1 SC6 SC11 SC16
High multimedia SC2 SC7 SC12 SC17
Medium multimedia SC3 SC8 SC13 SC18
Low rate data &low multimedia SC4 SC9 SC14 SC19
3.2. Market data analysis
This step analyzes the market data that have been obtained from Report ITU-R M2072 [5]. The collected market data are categorized and calculated in order to obtain the market attributes.
3.3 Traffic calculation and distribution over RATGs
In this step, five different set of market parameters are used. Offered traffic is the required input for calculating the spectrum requirement. The conversational and streaming classes (SC1-SC10) have a more conventional nature and they serve with circuit switching, while the background and interactive classes (SC11-SC20) are serve with packet switching. For the circuit switched service categories, the average traffic per cell in each teledensity for each service category can be calculated by multiplying the session arrival rate per cell by corresponding mean session duration. This product is equivalent to the offered traffic and measured in Erlangs. The capacity calculation for packet switched service categories requires the offered traffic in bits/s/cell which is calculated by multiplying the corresponding elements of the area traffic volume, distribution ratios and cell area. The offered traffic is the total traffic of all users of the same service category [6].
3.4. Required capacity calculation
The fifth step in the methodology flow chart is calculating the required system capacity. Separate algorithms are applied to calculate the circuit switched and packet switched traffic.
3.4.1 System capacity for circuit switched traffic
The capacity is calculated by using the multi-dimensional Erlang B formula Kleinrock et al., 1975] [11].Input parameters for determining the required number of service channels for circuit-switched sessions are the offered traffic in Erlangs per cell n, service channel data rate rn and the maximum allowable blocking probability n. We assume that a session of Ncs different circuit switched service categories shares a set of v channels with an associated service channel rate of 16 kbit/s and that each session of class n requires vn channels simultaneously (1 n Ncs). If an arriving service request of service category n finds less than vn idle channels then it is blocked and lost. The one-dimensional recursive algorithm by Kaufman [12] and modified algorithm by Takagi [Takagi et al., 2006] [13] are used to compute the blocking probability for each of Ncs service categories when the total number of channels, v, is given. Then the required number of channels per cell is determined by the smallest v that satisfies the conditions Bn(v) < n. The
system capacity is obtained by multiplying the required total number of channels by the bit rate per channel.
3.4.2 System capacity for packet-switched traffic
n p rat n t d p rat n t d s T,,, , ,
, ,
,
. (1) Let C (bit/s) be the capacity of the channel. Then the mean bn (s/packet) and the second moment of of the transmission time for an IP packet of service category n are given by bn =
and = The mean delay of an IP packet of service category n is given by
C s n i i i n i i i N i i i n n ps
s
C
s
C
s
C
D
1 1 1 1 ) 2 (–
–
2
)
(
(2)This equation is derived from Cobham’s formula for the mean waiting time in a single arrival M/G/1 non-pre-emtive priority queue [Cobham et al., 1954] [14], [Kesten and Runneberg et al. 1957] [15], [Inrich and Walke et al., 2004] [16]. If the QoS requirement for IP packets of class n, is given in terms of a required mean delay Dn, the required system capacity Cn is defined as the capacity satisfying the condition D(Cn) = Dn. Given a certain value for Dn, the system capacity Cn required to achieve Dn can be calculated by solving (2) for C. Among the three roots of this equation there is always onethat satisfies the stability condition
n i n i is C 1(3)
This value is chosen as the solution to the problem of dimensioning the system capacity so that IP packets of service class n have the required mean delay Dn. The system capacity that fulfills the mean delay requirements of all classes, denoted by C, is obtained by determining the set {C1, C2…….CN} of system capacity values required to fulfill the QoS requirements of classes n = 1--N, and selecting the maximum value from this set, i.e. C= max (C1, C2…….CN).
3.5 Spectrum results calculation
3.5.1 Determination of spectrum requirement
The resulting capacity requirements for circuit and packet switched service categories are added together to get the total capacity requirement
Cd,t,rat,p = Cd,t,rat,p,cs + Cd,t,rat,p,ps (4)
The capacity requirements are now converted to the spectrum requirements by dividing the area spectral efficiency factors. The spectrum requirement is obtained by
p rat d p rat t d p rat t d C F , , , , , , , , (5)
Then, the total required spectrum for all operators is
Fd,t,ra:= .Fd,t,rat + (No– 1) (6)
4. APPROACH TO ESTIMATE SPECTRUM REQUIREMENT FOR
DEVELIPING COUNTRIES
This section presents a scenario and a set of input parameter values to overcome of the shortcomings of current ITU methodology, which delivers a significantly better founded estimation of the spectrum requirement for developing countries and compared to the spectrum estimation by ITU derive in Rep. ITU-R M.2078 [7].
4.1.Cell area
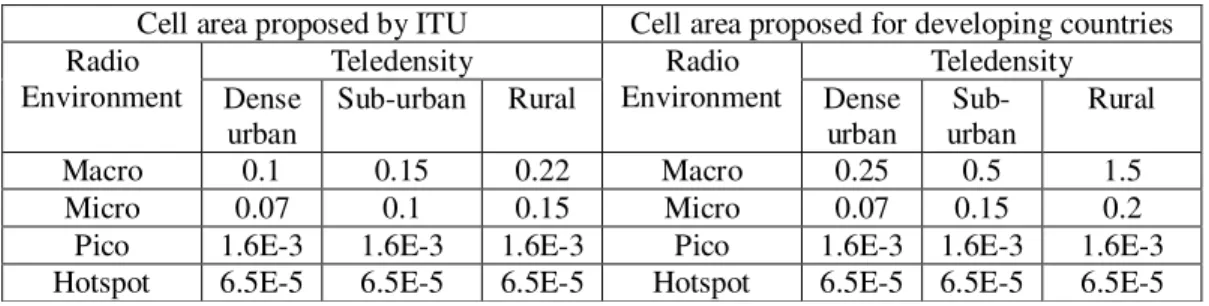
The cell area of a radio environment may vary depending on the teledensity [7]. The cell area that is proposed by ITU for macro and micro cells seems to be too small compared to deployment scenarios in the real world [9]. This cell area is applicable for the most developed countries that have large dense urban/urban cities with high rise buildings, increasing traffic due to the high level of penetration and usage of high-volume multimedia services. Radio propagation is highly dependent on the terrain and other obstacles. Path loss, shadowing and multi-path fading all affect the cell coverage of an area. In urban areas where there is no direct line-of-sight path between the transmitter and the receiver, the presence of high-rise buildings causes severe diffraction loss. In the case of Bangladesh the sub-urban and rural areas are flat terrain; a LoS (Line of sight) path between the base and mobile stations is guaranteed due to the absence of high rise buildings or obstacles. Further a macro base station can cover a wide area due to the small propagation loss and low user densities. The dense urban areas are growing with many high rise buildings and attract large volume of commerce and industries. The base station covers a small area because the LoS paths may be seldom available; moreover a high capacity cellular network is required to carry the larger traffic due to the higher user densities and rich multimedia service demands in the dense urban areas. To increase the network capacity in these dense urban areas, micro cells, pico cells and hotspots can be installed in addition to macro base stations. Currently, the deployment of cellular networks is complex and requires installation of base stations and supporting infrastructure. The installation cost is high and it remains difficult for operators to establish a profitable network in developing countries with low gross national income. If the ITU proposed cell areas of macro and micro cells are applied to developing countries, more base stations would be required for network coverage, which would increase the capital expenditure and operating cost of network expansion. To estimate the present and future traffic, the proposed cell area for macro and micro cells from Table 3 are used in the calculation, with information for developing countries obtained from the Bangladesh network deployment scenarios.
Table 3. Cell area per RE ( ).
Cell area proposed by ITU Cell area proposed for developing countries Radio
Environment
Teledensity Radio
Environment
Teledensity Dense
urban
Sub-urban Rural Dense
urban
Sub-urban
Rural
Macro 0.1 0.15 0.22 Macro 0.25 0.5 1.5
Micro 0.07 0.1 0.15 Micro 0.07 0.15 0.2
Pico 1.6E-3 1.6E-3 1.6E-3 Pico 1.6E-3 1.6E-3 1.6E-3 Hotspot 6.5E-5 6.5E-5 6.5E-5 Hotspot 6.5E-5 6.5E-5 6.5E-5
4.2. Population coverage percentage
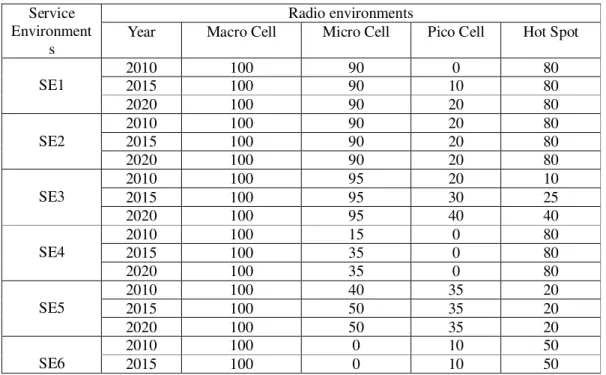
and micro cells and all high mobility to macro cells. The respective radio environment should be available, otherwise the traffic would go to the radio environment with the next higher mobility support. Some radio environments can be supported in all service environments. In practice, the total area of a service environment is covered by a certain radio environment, only up to a certain percentage, which is defined as the population coverage percentage [7]. For the years of 2010, 2015 and 2020, ITU proposed population coverage percentages for different radio environments in different service environments in Table 4 [7]. This is satisfactory for service environments included in the dense urban area but not harmonious for service environments in sub-urban and rural areas of a developing country. They can be covered under a cellular mobile network by using macro or micro cells because of the absence of high rise buildings and other obstacles. In addition to macro and micro cells, pico cell can be installed in office and public area where large capacity is required. According to the ITU methodology, pico cells and hotspots are proposed for rural areas, but this is not appropriate for developing countries. The base station antenna height of pico cells and hotspots may be much lower than the average rooftop height, so pico cells and hotspots are not feasible for rural areas. Network coverage is often lacking in low population density and low income rural areas of the developing world because of the expense of infrastructure. To solve this coverage gap, we propose using only macro cells for rural and remote areas. In some special cases micro cells can be installed in village areas that often feature a single community center where schools, hospitals and markets are located.
Table 4. ITU proposed population coverage percentage. Service
Environment s
Radio environments
Year Macro Cell Micro Cell Pico Cell Hot Spot
SE1
2010 100 90 0 80
2015 100 90 10 80
2020 100 90 20 80
SE2
2010 100 90 20 80
2015 100 90 20 80
2020 100 90 20 80
SE3
2010 100 95 20 10
2015 100 95 30 25
2020 100 95 40 40
SE4
2010 100 15 0 80
2015 100 35 0 80
2020 100 35 0 80
SE5
2010 100 40 35 20
2015 100 50 35 20
2020 100 50 35 20
SE6
2010 100 0 10 50
2015 100 0 10 50
4.3. Radio parameters
environments are included in RATG 1 for indoor coverage in dense urban areas. Network capacity and spectrum requirements largely depend on the application data rate and the mean service bit rate. The application data rate proposed by ITU for RATG 1 is acceptable but it is not typical for RATG 2 in developing countries. ITU estimated the application data rate for spectrum as 50 Mbit/s for macro cell, 100 Mbit/s for micro cell and 1 Gbit/s for pico cell/hotspot for RATG 2 [5]. Data rates of 30 Mbit/s to 100 Mbit/s or 1Gbit/s are required only for super high multimedia services. “However overall multimedia services such as high quality video conferencing, multimedia phone, mobile HDTV, video streaming and downloading, high volume business applications and collaborative working, mobile internet and data transfer etc. are visible into the high multimedia service type that supports a peak bit rate of up to 30 Mbit/s.” Moreover, for the average subscriber in developing countries, the medium multimedia service categories with peak bit rate up to 2 Mbit/s are the most affordable multimedia services.
Table 5. ITU proposed radio parameters of RATG 1and RATG2
To ensure a high bit rate, operators need to install more base stations with radio frequency or optical fiber based high capacity backhaul with supporting infrastructure. Since radio frequency is a very scarce and limited resource, an optical fiber based transmission /backhaul network is prepared to carry the required traffic of super high and high multimedia services. Apart from its very high installation cost, operation and maintenance are also challenging in rural environments. Since developing countries don’t have a very big market, it remains difficult for operators to establish economically viable and profitable network for IMT systems. Thus, for developing countries we propose the application data rates for RATG 2 as given in Table 6 which can ensure the optimum use of the network and reduce the capital expenditure needed.
Table 6. Proposed application data rate of RATG 2
Attribute Value
Macro Cell Micro Cell Pico Cell Hotspot Application
data rate [Mbit/s]
2010 0 0 0 0
2015 30 50 100 100
2020 30 50 100 100
Attribute
RATG1 RATG2
Value Value
Macro Cell
Micro Cell
Pico Cell
Macro Cell
Micro Cell
Pico Cell
Hot spot Application data rate
(Mbit/s)
2010 20 40 40 0 0 0 0
2015 20 40 40 50 100 1000 1000
2020 20 40 40 50 100 1000 1000
Max supported velocity-Km/h 250 50 4 250 50 4 4
Guard band between operators (MHz) - 0
Minimum deployment per operators and RE (MHz) -- 40 120 120 Granularity of deployment per operator per RE (MHz) - 20
4.4.Market data analysis
4.4.1.Market attributes settings for Bangladesh
In this step we analyze market parameters that have been obtained from Report ITU-R M2072, which derives market related parameters and provides forecasts for the mobile market for 2010, 2015, and 2020. ITU has collected market data from the most economically developed countries from the different parts of the world. This market data shows the great weight of the highest developed countries where multimedia traffic is increasing far more rapidly than speech, and will increasingly dominate traffic flows due to the higher mobile phone penetration. They have high data rate wireless network in every environment. Reports ITU-R M.2072 and ITU-R M.2078 present the market size of different countries, with penetration assumption for each service category along with service environment and technical data.
Bangladesh is a developing country in South Asia with an area of 147570 sq. km and a population of about 160 million with a low per capita gross national income of US$ 1000 and a 55.08% functional literacy rate. The Majority of the population are living in rural areas and engaged in farming activities. In terms of occupation 63% of the total population of Bangladesh is engaged in agriculture, 11% is in industry and 26% is in service based employment. Bangladesh is densely populated and also has a flat and easily extendable coverage. The demand for voice communication is very high and the subscriber base is very large but the investment needed is low because of the topographic layout. There are six licensed mobile operators in Bangladesh. The number of mobile connections has increased from 3.8 million in 2004 to over 100 million at the mid of 2013. Penetration rates are reported as 62.5% and network coverage extends to over 99% of the populations. The cellular mobile phone operators provide voice, SMS and low rate data service by using their EDGE (Enhanced Data rates for GSM Evolution), GPRS and CDMA 2001X compatible 2.5G networks. It can be assumed that 2G and beyond cellular mobile penetration rate will reach 75% at the end of 2020. Figure-2 shows that a significant growth has already taken place in voice communication through the 2G cellular mobile networks but the internet and personal computer penetration rate in Bangladesh is still not inspiring. In Bangladesh Broadband Wireless Access (BWA) was launched commercially at the end of 2008 but the penetration rate for the new service is much slower than that of the 2G service. 3G market in Bangladesh commenced commercially at the end of 2013.
Fig.2 Growth of the telecommunications market of Bangladesh
socio-economic conditions between the urban and rural populations. Due to the lack of basic literacy, financial insolvency, computer skills and training in the use of ICT applications, it remains a significant challenge to proliferate telecommunication services included in the IMT systems in the rural areas of Bangladesh. Language barriers and the complexity of personal computer operation are hindering the internet based service diffusion further. Moreover the relatively high price of the 3G/4G/LTE terminal devices and the comparatively higher tariffs of high speed data, multimedia and video telephony services may discourage lower and lower middle income people from migrating from 2G to 3G/4G/LTE. It can be deemed that 40% of the total cellular mobile subscriber will enter the 3G/4G/LTE network within the year of 2020. So there is a genuine need to determine the spectrum requirements for Bangladesh that can accommodate not only the new services of IMT systems but also the new radio transmission technologies being developed.
Table7. Typical market data (user density, session arrival rate mean service bit rate and average session duration) for the year of 2010 (BGD indicates Bangladesh)
SC SE User Density Session Arrival Rate
Bit Rate (Kbps) Average Session Duration
ITU BGD ITU BGD ITU BGD ITU BGD
2 2 45 20 0.299 0.199 20000 10000 53 41
2 5 7 3 0.299 0.1 20000 3000 51 16
3 1 6107.7 3637.5 0.2437 0.2129 496.2 496.2 113.5 105.75 3 4 1387.5 757.5 0.3738 0.158 290.2 290.2 109.2 45.5 5 5 8095.5 2228.5 1.688 0.511 16 16 227.1 128.9
5 6 677 380 1.3484 0.2506 16 16 207.5 95.6
Note that the 2G/2.5G cellular mobile communication market of Bangladesh is in a saturation state. For this reason we consider these service categories (SC4, SC5, SC9, SC10, SC14, SC15, SC19 and SC20) with the higher user density market settings. To calculate the spectrum requirement of Bangladesh we propose the user density parameter as shown in Table 8 based on the cellular mobile, computer and internet penetration rates. Table 8 shows that user density parameter denoted by U is equal to a certain percentage for different service categories. The market setting for session arrival rate per user is denoted by Q, the average session duration by μ and the mean service bit rate by R are equal to 30% for the year of 2010 and 2015, and 40% for the year of 2020 in all service categories. The market setting for the mobility ratios presented in this table assumes the middle mobility scenario for all service categories except for SC11. Because SC11 is a very high data rate service category with more than 100 Mbit/s data rate requirements.
Table 8. Market attributes settings for Bangladesh for the year of 2010, 2015 and 2020
SC U in % Q/R/ μ
in %
Mob -ility ratio
SC U in % Q/R/ μ
in %
Mobi-lity ratio
10 15 20 10/
15
20 10 15 20 10/
15 20
1 5 8 25 30 40 2 11 5 8 25 30 40 2
2 5 10 25 30 40 2 12 5 10 25 30 40 1
3 5 15 40 30 40 2 13 5 15 40 30 40 2
4 25 25 40 30 40 2 14 25 25 40 30 40 2
5 25 25 40 30 40 2 15 25 25 40 30 40 2
6 5 8 25 30 40 2 16 5 8 25 30 40 2
7 5 10 25 30 40 2 17 5 10 25 30 40 2
8 5 15 40 30 40 2 18 5 15 40 30 40 2
9 25 25 40 30 40 2 19 25 25 40 30 40 2
10 25 25 40 30 40 2 20 25 25 40 30 40 2
4.4.2 Mean service bit rate for Bangladesh
requirement at the cell edge.In that case two carriers could be deployed; one providing basically the minimum ubiquitous service of 5 Mbps for all users and the other providing the access to services demanding higher data rates as up to 50 Mbps per service. As an example two carrier bandwidths of 2 x 20 MHz and 2 x 40 MHz are considered. 2x20 MHz operation could provide an aggregate peak throughput between 40 – 60 Mbits, which would be sufficient to deploy basic services in future wireless mobile systems. The 2 x 40 MHz carrier bandwidth could be deployed in environments where users request services demanding higher data rates. The carrier bandwidth of 2 x 40 MHz would allow a minimum of 80 Mbps that could guarantee mobility between cells for the high data rate services [10]. The Asia Pacific Telecommunity (APT) spectrum information database indicates that most of the countries in the Asia Pacific region have assigned 2x15 MHz or 2x20 MHz spectrum to each operator for IMT systems, which can provide a minimum ubiquitous data rate of 5 Mbps for all users in a full mobility radio environment.
5.
SPECTRUM
REQUIREMENT
ESTIMATION
FOR
BANGLADESH AND COMPARISON WITH THE FORECASTED
RESULT OF ITU
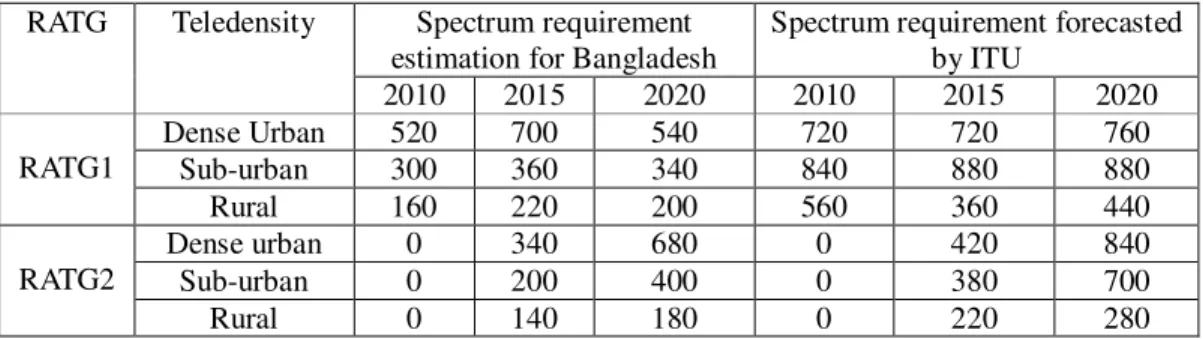
The complete algorithm developed by Hideaki Takagi and Bernhard H.Walke [8] and the calculation tool package “SPECULATOR” [17] are used for traffic and spectrum requirement estimation that has been described briefly in section 3 and 4. Calculations of spectrum requirement estimates for Bangladesh are presented in Table-9 and demonstrated in fig.3 & 4. These calculations were based on Bangladesh’s telecom market trends, cellular mobile and internet penetration rates. ITU presents the results of the calculation of spectrum requirements for IMT systems in the Report ITU-R.M 2078 and the values are listed in Table-9 and illustrated in fig. 5 & 6. In the present telecom scenario, most traffic has been shifting from voice oriented communication to multimedia communication, so the spectrum requirement for RATG2 should be higher than RATG1 for the year of 2020. But in table 10 & Fig.8, the ITU spectrum estimate indicates that the spectrum requirement for RATG 2 is lower than RATG1. Moreover the spectrum demand is dominated by the sub-urban teledensity of RATG1 instead of the dense urban teledensity. These are the major shortcomings of the ITU methodology. In contrast, the results of the spectrum estimate for Bangladesh show in table 8 & fig.7 that the spectrum requirement for dense urban area is almost double than the spectrum requirement for sub-urban areas for every forecasted year and that the spectrum requirement for RATG 2 is higher than RATG1 for the year of 2020.
Table 9.Spectrum requirement estimation Result RATG Teledensity Spectrum requirement
estimation for Bangladesh
Spectrum requirement forecasted by ITU
2010 2015 2020 2010 2015 2020
RATG1
Dense Urban 520 700 540 720 720 760
Sub-urban 300 360 340 840 880 880
Rural 160 220 200 560 360 440
RATG2
Dense urban 0 340 680 0 420 840
Sub-urban 0 200 400 0 380 700
Fig.3 Spectrum requirement for Bangladesh Fig.5 Spectrum requirement forecasted by for RATG 1 for RATG 1
Fig.4 Spectrum requirement for Bangladesh Fig.6 Spectrum requirement forecasted by for RATG 2 for RATG 2
Table 10.Final spectrum requirement estimation Result
Fig.7 Final spectrum requirement for Bangladesh Fig.8 Final Spectrum requirement forecasted by ITU
6.
C
ONCLUSIONSIn this paper, we analyzed the algorithm underlying ITU’s methodology for calculating of spectrum requirements of IMT systems. We proposed an alternate approach for estimating the spectrum requirements for a developing country like Bangladesh to deploy IMT systems in the three forecast years 2010, 2015 and 2020. We have pointed out the unsuitability of the ITU
RATG Spectrum requirement estimation for Bangladesh
Spectrum requirement forecasted by ITU
2010 2015 2020 2010 2015 2020
RATG1 520 700 540 840 880 880
methodology of applying spectrum estimation for developing countries and proposed the market setting, cell area, population coverage percentage, application data rate, market parameters like user density, mean service bit rate, session arrival rate and average session durations based on the Bangladeshi mobile communications environment and market. According to the ITU-R spectrum estimation methodology, the spectrum requirements of IMT systems for lower and higher user density settings are 1160 MHz and 1720 MHz respectively for the year of 2020 [8].The predicted total spectrum bandwidth requirements of Bangladesh for both the RATG 1 and RATG 2 for the year 2020 are calculated as 1220 MHz. It should be noted that this figure (1220 MHz) is little higher than the spectrum requirements of the lower market setting (1160 MHz). These consequences indicate quite difference between the forecasting marks of ITU-R and the outcomes based on the input parameters of Bangladesh telecom network deployment scenarios. Which direct ITU spectrum estimation overestimates the approximate requirement of developing countries.
R
EFERENCES[1] Rec. ITU-R M.1390, Methodology for the Calculation of IMT- 2000 Terrestrial Spectrum Requirement, ITU, 2000.
[2] Rep. ITU-R M.2023, Spectrum Requirements for IMT-2000, ITU, 2000.
[3] Rec. ITU-R M.1645, Framework and Overall Objectives of the Future Development of IMT-2000 and Systems beyond IMT-2000, ITU, 2003.
[4] Rec. ITU-R M.1768, Methodology for Calculation of Spectrum Requirements for the Future Development of IMT-2000 and Systems beyond IMT-2000 from the Year 2010 Onwards, ITU, 2006. [5] Rep. ITU-R M.2072, World Mobile Telecommunication Market Forecast, ITU, 2006.
[6] Rep. ITU-R M.2074, Radio Aspects for the Terrestrial Component of IMT-2000 and Systems beyond IMT 2000, ITU, 2006.
[7] Rep. ITU-R M.2078, Spectrum Requirements for the Future Development of IMT-2000 and Systems beyond IMT-2000, ITU, 2006.
[8] Matinmikko, M. Huschke J. & Ojala, J. 2008. Calculation tool package. In: Tak-agi, H. & Walke, B. H. (ed.) Spectrum requirement planning in wireless communications: Model and methodology for IMT-Advanced. Chichester, UK: John Wiley & Sons.
[9] Document ITU-R WP-5D/283-E, 2013, LM Ericsson, Intel Corporation, Nokia Corporation, Nokia Siemens Networks: Proposed input parameter values for spectrum requirement estimation for IMT systems.
[10] WINNER System concept: Capabilities and Spectrum Usage, WWRF meeting 16, Shanghai, 26-28 April 2006.
[11] Kleinrock L 1975 Queueing Systems, vol. 1: Theory. John Wiley & Sons
[12] J.Kaufmann, “Blocking in a shared resource environment,” Transactions on Communications, vol. COM-29, no. 10, pp. 1474–1481, October 1981.
[13] H.Takagi, H.Yoshino, N.Matoba, and M. Azuma, “Methodology for Calculation of Spectrum Requirements for the Next Generation Mobile Communication Systems,” IEICE Trans. on Communications, vol. J89-B, no. 2, Feb. 2006, pp. 135-142.
[14] A.Cobham,“Priority Assignments in Waiting Line Problems” Operations Research, vol. 2, pp. 70–76, 1954.
[15] H.Kesten and J. Runneberg, “Priority in Waiting Line Problems,” Proc. Koninkl. Nederlandse Akademie van Wetenshappen, vol. 60, pp. 312–324 and 325–336, 1957, series A.
[16] T.Irnich and B. Walke “Spectrum Estimation Methodology for Next Generation Wireless Systems,” PIMRC 2004, 5-8 Sep. 2004, Barcelona, Spain.
[17] SPECULATOR for estimating the spectrum requirements for IMT systems developed by IST-WINNER and IST-WINNER II projects.
[18] Chung, Lim, Yook and Park “Calculation of spectral efficiency for estimating spectrum requirement of IMT –advanced in Korean Communication Environments” ETRI journal, Volume 29, Number 2, April 2007.
Authors
Md Sohel Rana was born in Natore, Bangladesh in 1979. He received the B.Sc degree in Electrical and Electronics Engineering in 2002 from Khulna University of Engineering and Technology, Bangladesh. He has been working as a Senior Assistant Director of Bangladesh Telecommunication Regulatory Commission (BTRC) since 2004 and is responsible for spectrum planning and management. Now he is in deputation at Kyung Hee University, Republic of Korea for master’s study. His research interest include radio spectrum management, spectrum planning and interference analysis between wireless communications systems.
Een-Kee Hong received the BS, MS and PhD degree in Electrical Engineering from Yonsei University, Seoul, Republic of Korea in 1989, 1991 and 1995 respectively. Since 1999 he has been with the Department of Electronics and Radio Engineering of Kyung Hee University. In addition of that he is working as a director of Korea Information and Communication Society (KICS) and Korea Navigation Institute (KONI). His research interest are wireless communications (physical layer), spectrum engineering for cellular mobile systems and cross layer optimization.