Received: 3 June 1996 / Revised: 27 March 1997 / Accepted: 1 April 1997
Abstract. Changes in the three components of geomag-netic ®eld are reported at the chain of ten geomaggeomag-netic observatories in India during an intense solar crochet that occurred at 1311 h 75° EMT on 15 June 1991 and
the subsequent sudden commencement (SSC) of geo-magnetic storm at 1518 h on 17 June 1991. The solar ¯are eects (SFE) registered on the magnetograms appear to be an augmentation of the ionospheric current system existing at the start time of the ¯are. An equatorial enhancement inDH due to SFE is observed to be similar in nature to the latitudinal variation of SQ (H) at low latitude. DY registered the largest eect at 3.6°dip latitude at the fringe region of the electrojet.DZ
had positive amplitudes at the equatorial stations and negative at stations north of Hyderabad. The SSC amplitude in the H component is fairly constant with latitude, whereas theZcomponent again showed larger positive excursions at stations within the electrojet belt. These results are discussed in terms of possible currents of internal and external origin. The changes in the Y
®eld strongly support the idea that meridional current at an equatorial electrojet station ¯ows in the ionospheric dynamo, E.
1 Introduction
As is well known, solar ¯are eects (SFE) in the geomagnetic ®eld at ground level represent changes in the ionospheric currents associated with the arrival of enhanced electromagnetic radiations from the Sun. Sudden commencements (SSC) of geomagnetic storms represent eects due to the ionised plasma cloud from
the Sun following solar ¯ares or from solar coronal holes.
The ®rst observations of the simultaneous occurrence of a solar ¯are and the crochet in magnetic ®eld related to the event of 1 September 1859 were reported by Carrington (1859) and Hodgson (1859). A comprehen-sive study of the SFE was made by McNish (1937), who examined the magnetograms from a large number of observatories to show that the eect of the ¯are on the magnetograms was the augmentation of the ®eld values at the time of the ¯are. Nagata (1952) found an abnormally large eect of the solar ¯ares on the geomagnetic H ®eld at Huancayo compared to two other stations at Kakioka and Watheroo. Forbush and Casaverde (1961) showed that the enhancement of SFE in H at Peruvian stations varied in a manner similar to the enhancement of the SQ range of H at equatorial latitudes. Rastogi et al. (1965) showed that the equato-rial enhancement of SFE in Hwas more pronounced in the American than in Indian longitudes, corresponding to the longitudinal variation of equatorial electrojet current itself. Srivastava (1974) seems to have been the ®rst to describe the eect of solar ¯are on D,H and Z
®elds at Indian observatories. Rastogi et al. (1975) showed that some of the abnormal features of SFE inH
were due to a partial counter electrojet at the start time of the solar ¯are. Rastogi (1996a) described the results of an extensive study of SFE in H and D at the equatorial station Annamalainagar over the period 1967±1976. During the normal electrojet period a solar ¯are produced a positive change inH, a negative change in Y and a negative change in Z. The eect on DY
(negative) increased linearly with increasing value of
DH. This suggested that the SFE on all the three components of the geomagnetic ®eld were plainly the augmentation of the ionospheric current over the station.
The SSC of a magnetic storm is very clearly seen at temperate and low latitudes all over the world simulta-neously to within a few seconds, and signi®es an abrupt increase worldwide in the horizontal geomagnetic ®eld
Correspondence to:D. R. K. Rao *
Hand with associated sudden changes in declination D
and vertical intensity Z. The amplitude of SSC in D
depends on local time and season, whereas SSC (Z) depends on the location of the observing station. Latitudinal and longitudinal characteristics of the SSC (H) have been dealt with by many researchers (e.g. Sugiura, 1953; Forbush and Casaverde, 1961; Rastogi
et al., 1964, etc.).
These two phenomena, having distinctively dierent characteristics, can be studied from registrations in a suitable network of geomagnetic observatories to un-derstand the ionospheric current systems during the events. India has a unique set of geomagnetic observa-tories spanning the latitudes of the magnetic equator and the SQ focus in a region of the world where the geomagnetic and geographic meridian planes are least separated. Taking advantage of this, we aim here to focus on some of the aspects of an SFE and associated SSC and their related changes in the ionospheric conductivities and electric ®elds.
2 Event selection and presentation
2.1 SFE on 15 June 1991
The Holloman observatory reported a type-3E optical solar ¯are on 15 June 1991 with a duration of 29 min
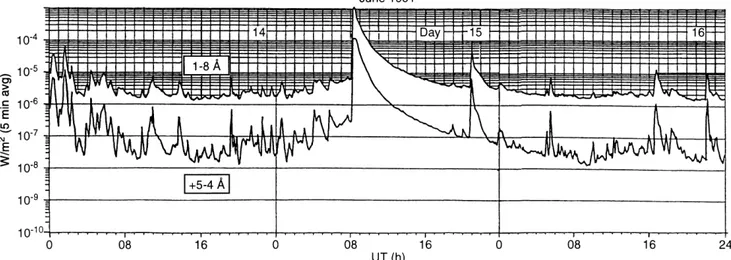
starting at 0813 UT. The Wroclaw observatory reported a Ha surge between 0820±0831 UT. The Ondrejov observatory reported a burst of decimeter and meter radio waves starting at 0813.5 UT and ending at 1032.1 UT. Type-II radio bursts were reported at the Potsdam, San Vito and Wissenau observatories. The GOES satellite recorded beautiful bursts of solar X-ray radia-tions in the 0.5±4 and 1±8 AÊ ranges on 15 June 1991, reproduced in Fig. 1 (Solar Geophysical Data bulletin 578 Pt. II). It is to be noted that the X-ray ¯ux started increasing slowly after about 01 UT, and after 02 UT it changed into a strong burst, increasing the ¯ux after 08 UT by over two orders of magnitude. The ¯ux had returned to its pre-¯are value only by about 16 UT.
An abnormally large geomagnetic crochet (SFE) was registered at the Indian geomagnetic observatories at 1311 h 75° EMT (0811 UT) on 15 June 1991. A large
SSC followed this crochet on 17 June 1991 at 1518 h, almost 50 h later. The geographic and geomagnetic co-ordinates of the Indian geomagnetic observatories, operational during June 1991, are given in Table 1; station codes are also included. The chain of stations whose magnetograms are used for the study all lie in more or less the same longitudinal sectors, barring Shillong, which is about 15°further east of this sector.
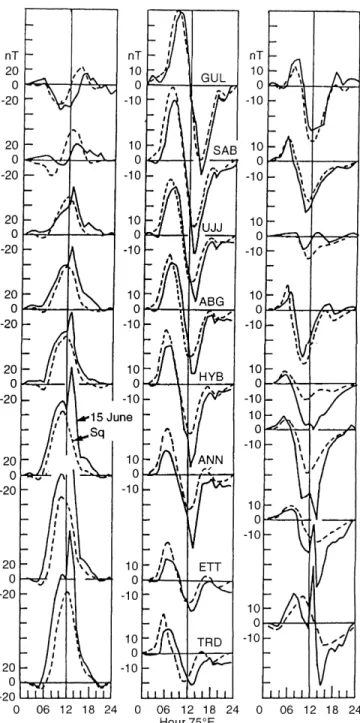
Figure 2 shows the daily variations inH,Y(Yis the Eastward component of the ®eld computed fromHand
D) at dierent stations (1) on the ¯are day 15 June 1991
Fig. 1.Variation in solar X-ray ¯ux within 0.5±4 and 1±8 AÊ ranges during 14±16 June 1991 by instruments aboard the GOES satellite
Table 1.Geographic and geo-magnetic coordinates of Indian geomagnetic observatories op-erating during 1991
station code geographic geomagnetic dip
angle lat. N long. E lat. N long. E
Trivandrum TRD 8.48 76.97 )1.2 146.4 0.6
Ettaiyapuram ETT 9.17 78.00 0.6 147.5 2.2
Kodaikanal KOD 10.23 77.47 0.6 147.1 4.7
Annamalainagar ANN 11.37 79.68 1.4 149.4 7.1
Hyderabad HYB 17.42 78.55 7.6 148.4 21.8
Alibag ABG 18.62 72.87 9.5 143.6 25.4
Ujjain UJJ 23.18 75.78 13.5 147.0 33.9
Shillong SHL 25.57 91.88 14.6 162.4 45.9
and (2) averaged over the ®ve international quiet days of June 1991 (henceforth denoted SQ) corrected for any daily inequalities. These curves are drawn through the hourly mean data points.
The variations in H, Y and Z ®elds at the chain of geomagnetic observatories along the India-Russia sector have been described by Patilet al. (1983) and by Rastogi (1996b). It is to be noted from the Fig. 2 that on quiet days the amplitude ofDHdecreased progressively from Trivandrum (TRD) to Gulmarg (GUL). Absence of a clear diurnal variation pattern at GUL and near equal
increasing earlier in the morning on the ¯are day and that throughout this dayDHwas larger than the average SQ values. The value of D at 1130 h at Ettaiyapuram (ETT) was 110 nT on SQ days and 140 nT on 15 June 1991. Similarly, at Hyderabad (HYB)DHwas 65 nT on SQ days and 70 nT on 15 June 1991. Even the hourly mean value ofDHat 13.5 h shot up to a value of 206 nT from its 12.5-h value of 140 nT. A similarly large increase in hourly mean DH at 13.5 h is seen at all stations up to Ujjain (UJJ). No large increase inDHat
13.5 h is evidenced at Sabha wala, (SAB) and GUL due to its proximity to the SQ focus, where the currents north and south of the station cancel the eect onDH. Regarding the variations in theZ ®eld ignoring the individual value at 13.5 h at TRD and ANN, one would conclude a large increase in electrojet current on 15 June 1991 compared to that on SQ days; these eects are again largest at ANN and HYB. What seems to be an abnormal feature is the sudden large positive increase at 13.5 h at TRD and ETT [Kodaikanal (KOD) data onZ
were not available on 15 June 1991].
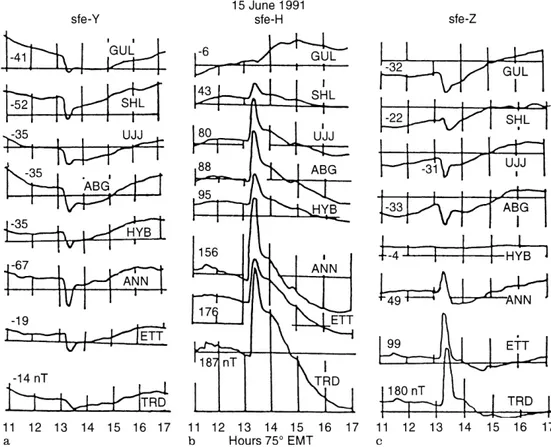
The magnetogram traces at dierent stations were reorganised to study the eect of the solar ¯are on the individual componentsH,YandZat stations extending from the equatorial location of TRD to a station in the vicinity of SQ focus, GUL, and are shown in a, b and c of Fig. 3, respectively. These are the tracings of actual magnetograms, and these have dierent scale values. The numbers indicate the magnitude of SFE on the particular component.
DH at TRD shows a sudden increase inH at 1311 h
EMT due to SFE. The amplitude of 187 nT is unusually large and is one of the largest ¯are eects recorded at TRD. TheHrecordings at ETT went o the scale, but by comparison with the time-pro®le of DH at
neigh-bouring station TRD an amplitude of 176 nT was estimated. The amplitude of SFE in H decreased progressively with increasing latitude of the station and became quite small ()6 nT) at GUL.
The DY trace at all stations showed a negative
excursion due to SFE. Examining the daily variations of
DY, it can be seen that the ¯are occurred immediately after noon (1311 h 75° EMT) when DY reached its diurnal minimum value. An abnormally largeY, equal to)67 nT, was recorded at ANN. The amplitude ofDY
Fig. 2. The variations in the geomagnetic ®eldH (left panel), Y
at ETT ()19 nT) was nearly the same as that at TRD ()14 nT), which is closest to the dip equator.
The magnetograms showing Z at dierent stations present unexpected registrations. The SFE was very large in amplitude, equal to +180 nT at TRD, and this is found to decrease rapidly with increasing latitude, decreasing to)4 nT at HYB. At stations north of HYB, SFE (Z) was signi®cantly negative, being around
)30 nT. This positive SFE (Z) with a strong equatorial
enhancement within the electrojet belt is a phenomenon which requires further examination.
In order to understand the SFE in H, Y and Zthe deviations of these components just before the start of the ¯are with respect to the 0000 h value on the same day were also noted and referred to as the pre-¯are valuesDH0,DY0and DZ0.
Figure 4 shows the latitudinal variations of (1) pre-¯are values,DH0,DY0andDZ0, (2) enhancements due to
¯are on the componentsDHSFE,DYSFE andDZSFEand
(3) the ratios DHSFE/DH0 and DYSFE/DY0for the solar ¯are at 1311 h (75°EMT) on 15 June 1991.
The SFE in H is seen to increase in a fashion very similar to that of pre-¯areDH0. The ratio ofDHSFE/DH0
at all stations except GUL, a station very close to SQ focus, varied from about 1.5 to 2.0.
The eastward ®eld DY0 at the time of ¯are onset
varied between )15 and )40 nT at dierent stations,
with a general increase in the negative amplitude with latitude. The solar ¯are eect, DYSFE varied between
)14 and)70 nT, showing a peak around 10°dip.
The latitudinal variation of DZ0showed a very low
value at the equator and a negative value around
)40 nT at other latitudes. There is a suggestion of a
maximum around ANN, a station near the fringe of the electrojet belt. The DZ due to SFE showed almost similar values at stations north of HYB, but abnormally large positive deviations are noted at the equatorial stations TRD, ETT and ANN.
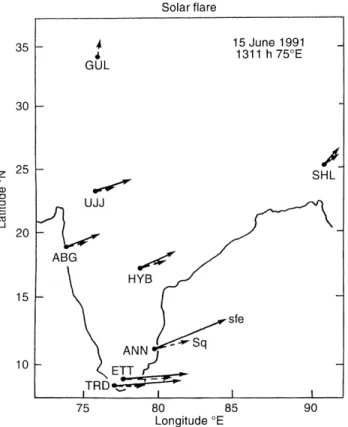
Figure 5 shows the current vectors which are com-puted as the resultant magnitudes of the two orthogonal horizontal ®eld vectors (DH andDYamplitudes of SFE with respect to pre-¯are values) and rotating the same 90°clockwise. It is to be noted that the current vectors
due to both the SQ as well as to the crochet are practically in the same direction at low latitudes of the Indian subcontinent, although the magnitudes of the vectors are dierent, as expected.
2.2 SSC on 17 June 1991
Figure 6 reproduces the magnetograms of the dierent stations in India showing the SSC eects onH,YandZ
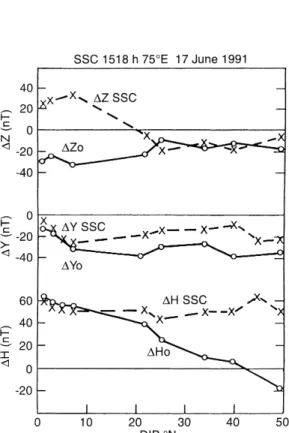
components at 1518 h 75°EMT on 17 June 1991. Again, these are tracings of magnetograms with dierent scale values. The magnitude of SSC in nT is indicated on the tracings. The latitudinal variations in the pre-SSC values of the three components, viz.DH0,DY0andDZ0as well as SSC amplitudes in these components are shown in Fig. 7.
The pre-SSC DH0 showed a monotonous increase
with decreasing latitude. No signi®cant equatorial enhancement of DH0 was evident, as the SSC occurred in the late afternoon hours when the electrojet currents are greatly reduced. The SSC amplitude inHwas 60 nT at TRD and almost of the same amplitude at other
Fig. 3a±c.The magnetogram tracings at Indian Observatories showing the SFEs onaY,bHand
cZcomponents due to the ¯are at 1311 h 75°EMT on 15 June 1991.
stations, indicating again the non-existence of equatorial enhancement which is the characteristic feature of midday SSC events at low latitudes (Rastogi, 1993a). The SSC amplitude inDYshowed a uniform latitudinal variation with an indication of larger deviation at ANN situated at the periphery of the electrojet. The SSC signature of theDZ®eld showed a positive excursion at
the equatorial stations and a negative deviation at stations north of HYB. This feature inDZis nearly the same as that of the SFE.
3 Discussion
Before summarising and discussing the observations of solar ¯are and sudden commencements on the three components of the geomagnetic ®eld, it is essential to
seek the origins of these phenomena. The SFE are associated with the arrival of a sudden increase of electromagnetic radiations from the Sun, which, while traversing the ionosphere, generate additional ionisat-ions mainly in the E, partially in the D and sometimes in the F region. The SSC of a magnetic storm indicates the arrival of a dense plasma cloud consisting of charged particles from the Sun, generally a few tens of hours after the occurrence of the solar ¯are. These clouds are stopped at the magnetopause when the dynamic pres-sure of the charged particles is balanced by the magnetic pressure of the Earth's magnetic ®eld and the magne-tosphere is compressed, causing a sudden increase in H
at stations around the world on the dayside as well as the nightside.
The results of SFE at the Indian stations indicate that the disturbance vectors of the solar ¯are were almost in the same direction as the pre-SFE (SQ) vector just before the start of the event. Volland and Taubenheim (1958), while examining SFE at the European stations between latitudes of 10°and 60° North have shown an
angular dierence of 15°±30° between the SQ and SFE
vectors. Veldkamp and Sabben (1960) also detected dierences between SFE and SQ vectors at European stations during the ¯are on 23 March 1958. Sabben (1968), after re-examining the current systems due to SFE during the period 1959±1961, concluded that the SFE can be considered as a temporary augmentation of the daily variation of the magnetic ®eld based on the comparison of the disturbance vectors of the SFE and
Fig. 4. Latitudinal variations in the amplitudes in the three components of the geomagnetic ®eld during the ¯are (DYSFE,DHSFE
andDZSFE) and pre-¯are SQ (DY0,DH0andDZ0). Also the ratios of the amplitudes inYandHcomponents at SFE and pre-SFE times with latitudes are shown
SQ currents at individual stations and their distribution over the world. The horizontal equivalent current vectors for both SFE and pre-SFE (SQ) disturbances over the Indian stations situated within a narrow longitude sector, shown in Fig. 4, have nearly the same directions, thereby indicating (within the limits of time resolution) the augmentation of the integrated eects on the ground in the north±south and east±west ®elds.
One of the interesting observations of the ¯are event here is the existence of signi®cant eastward magnetic ®eld within the electrojet region on a normal day and its eect on the SFE that is noticed to be proportional to the pre-¯are condition over wide range of latitudes (Fig. 3). The close similarities of the latitudinal pro®les of SFE and SQ amplitudes (although substantial enhancement of the ¯are vector at ANN is noticed over that of SQ) at low-latitude stations in India suggest that the SQ variation in theY®eld at equatorial stations are due to currents in the E region of the ionosphere, as in the case of theH ®eld.
The present result of enhanced amplitudes ofDHSFE
at stations under the in¯uence of equatorial electrojet , and more importantly the large positive excursion ofDZ
at stations TRD, ETT, KOD and ANN is a marked feature. The ionospheric current models of the equato-rial electrojet envisage that the enhanced eastward electric currents are expected to give rise to a minimum of the vertical component of the geomagnetic ®eld at latitudes in the vicinity of the central axis of the
Fig. 6.Magnetogram tracings from Indian Observatories show-ing signatures of storm sudden commencement (SSC) at 1518 h 75°EMT on 17 June 1991. The amplitudes of SSC at each of the stations for the three components of the geomagnetic ®eld in nT are indicated
the idea of mutual induction between the E- and D-layers during solar ¯ares. However, the observations of abnormal signatures of DZ at the chain of equatorial stations in India, probably described for the ®rst time here, elude any clear explanation.
It is even more dicult to explain the latitudinal variation of SSC amplitude inDZ(shown asDZSSC in Fig. 6). The variations of DZ(SSC) closely follow that ofDZ(SFE) in the sense that positive amplitudes at the stations under the in¯uence of the equatorial electrojet near zero amplitude at HYB and negative signatures at stations north of this station.
Obayashi and Jacobs (1957) studied the SSC inX,Y
and Zcomponents at a large number of stations round the world, and showed that the amplitudes of SSC inX
and Y vary in a regular fashion with geomagnetic latitude. The SSC in Zshowed very irregular distribu-tion from place to place. They suggested this irregular behaviour was due to the eect of the induced currents inside the Earth, where the distribution of electrical conductivity may be considerably heterogeneous.
Ivanov (1964) has displayed a map of geomagnetic stations that have registered positive and negative signs ofDZ(SSC) employing International Geophysical Year (IGY) data of northern-hemisphere observatories. The author also reported several stations (from both the hemispheres) where the sign of SSC inDZis sometimes positive, and negative other times. As per the theoretical consideration of Parker (1962), the sign ofDZ (SSC) is negative (positive) in the northern (southern) hemi-sphere. If it were otherwise, it could be considered as anomalous and this behaviour would be the result of peculiarities of the current system induced in the Earth's upper mantle (Ivanov, 1964). If the induced currents are responsible for the sign changes of the DZ (SSC), it is
reasonable to assume that all the short-period variations (SSCs, SIs, SFEs and bays of comparable period) must show the same anomalous behaviour at the Indian observatories consistently. Srivastava and Prasad (1974) have noted that during solar ¯are of 3 May 1973 the eects inHandDat ABG and HYB were comparable, whereas inZthere was negative amplitude at the former and positive at the latter station. They have attributed the negative signature at ABG to the abnormal induction eects associated with Deccan traps and also to the
two currents at the height of peak E-region ionisation (106 km) and at the height of the largest Hall polariza-tion ®eld (100 km). It is suggested here that the abnormal features of DZ at equatorial stations may also possibly be due to the distortions produced in the altitude pro®le of the ionospheric current at low latitudes, depending upon the spectrum of the solar-¯are radiations. Even if the solar-solar-¯are currents produced are uniform in altitude, a dierent latitude gradient of the integrated currents may be generated which would distort the amplitude and sign of the variations in the vertical ®eld. Some of these features can be checked with SFE during counter electrojet conditions and by study-ing SFE at a latitudinal chain of stations north and south of the magnetic equator.
Acknowledgements.The authors are thankful to B. P. Singh, Mita Rajaram and M. Roy of the Indian Institute of Geomagnetism, Colaba, Mumbai, for discussions and suggestions. Sincere thanks are also due to R. J. Stening for valuable advice and suggestions during the course of revision of the original manuscript.
Topical Editor D. Alcayde thanks T. Araki and R. J. Stening for their help in evaluating this paper.
References
Carrington, R. C.,Description of a singular appearance seen in the sun on Sept. 1, 1859,Mon. Not. R. Astron. Soc.,20,13, 1859.
Chapman, S., The equatorial electrojet as detected from the abnormal electric current distribution above Huancaya, Peru and elsewhere, Arch. Meteorol. Geophys. Bioclimatol.,4,368± 390, 1951.
Forbush, S. E., and M. Casaverde, Equatorial electrojet in Peru, CIW Publ.620,Washington DC, 1961.
Green®eld, S. M., and S. V. Venkateswaran,The vertical structure of dynamo winds deduced from geomagnetic variations associated with solar ¯ares, in Proc. Birkeland Symp. Aurora and magnetic storms, Eds. A. Egeland and J. Holtet, C.N.R.S., Paris, pp: 403±411 1967.
Hodgson, R.,On a curious appearance seen in the sun,Mon. Not. R. Astron. Soc.,20,15, 1859.
Ivanov, K. G., Map of the distribution of the sign of the Z component of the SSC ®eld over the Earth's surface,Geomagn. Aeron.,4,629±630, 1964.
McNish, A. G., Terrestrial, magnetic and ionospheric eects associated with bright chromospheric eruptions, Terr. Magn. Atmos. Electr.,42,109±122, 1937.
Nagata, T., Characteristics of the solar ¯are eects (Sqa) on geomagnetic ®eld at Huancayo (Peru) and at Kakioka (Japan),
Nityananda, N., A. K. Agarwal, and B. P. Singh,Induction at short periods in the horizontal ®eld variations in the Indian Penin-sula,Phys. Earth Planet. Inter.,15,5±9, 1977.
Obayashi, T., and J. A. Jacobs, Sudden commencements of magnetic storms and atmospheric dynamo action,J. Geophys. Res.,62,589±616, 1957.
Parker, E. N.,Dynamics of geomagnetic storm,Space Sci. Rev.,1,
62±99, 1962.
Patil, A., B. R. Arora, and R. G. Rastogi,Daily variations of the geomagnetic ®eld near the focus of SQ current system in Indian longitude,Proc. Ind. Acad. Sci.,92,239±245, 1983.
Rastogi, R. G.,Longitudinal variation of sudden commencement of geomagnetic storm at equatorial stations,J. Geophys. Res.,
98,15411±15416, 1993a.
Rastogi, R. G.,Complexities of ionospheric current system at low latitudes,Ann. Geophysicae,11,273±282, 1993b.
Rastogi, R. G.,Solar ¯are eects on zonal and meridional currents at the equatorial electrojet station, Annamalainagar,J. Atmos. Terr. Phys.,58,1413±1420, 1996a.
Rastogi, R. G., Zonal and meridional ionospheric currents in Central Asian sector,Ind. J. Radio Space Phys.,25,291±299, 1996b.
Rastogi, R. G., N. D. Kaushika, and N. B. Trivedi,Some relations between the sudden commencements at the equatorial electrojet,
J. Atmos. Terr. Phys.,26,771±776, 1964.
Rastogi, R. G., N. D. Kaushika, and N. B. Trivedi, Solar ¯are crochet and sudden commencement in H within the equatorial electrojet region.J. Atmos. Terr. Phys.,27,663±668, 1965.
Rastogi, R. G., M. R. Deshpande and N. S. Sastri,Solar ¯are eect in equatorial counter electrojet currents, Nature, 258(5532), 218±219, 1975
Rastogi, R. G., G. K. Rangarajan, and V. V. Somayajulu,
Complexities of counter electrojet currents in Indian zone,
Ind. J. Radio Space Phys.,21,89±96, 1992.
Rikitake, T., and Y. Yukutaka,A theory of s.f.e. current system,J. Atmos. Terr. Phys.,24,93±106, 1962.
Roy, M.,Mutual induction between the E- and the D-layers of the ionosphere during a solar ¯are,J. Atmos. Terr. Phys.,39,221± 227, 1977.
Roy, M.,A two-layer model for the geomagnetic crochet,J. Atmos. Terr. Phys.,41,225±229, 1979.
Sabben, D. van,Solar ¯are eects and simultaneous magnetic daily variation, 1959±1961.J. Atmos. Terr. Phys.,30,1641±1648, 1968.
Srivastava, B. J.,The geomagnetic solar ¯are eect of 3 May 1973 at Indian stations and its dependence on the counter electrojet,
J. Atmos. Terr. Phys.,36,1571±1575, 1974.
Srivastava, B. J., and S. N. Prasad,Role of the Deccan volcanics in the reversal of short period geomagnetic Z-variations at Alibag,
Phys. Earth Planet. Inter.,9,157±160, 1974.
Sugiura, M.,The solar diurnal variation in the amplitude of sudden commencements of magnetic storms at the geomagnetic equa-tor,J. Geophys. Res.,58,558±559, 1953.
Veldkamp, J., and D. van Sabben,On the current system of solar ¯are eects,J. Atmos. Terr. Phys.,18,192±202, 1960.
Volland, H., and J. Taubenheim,On the ionospheric current system of the geomagnetic solar ¯are eect (sfe),J. Atmos. Terr. Phys.,