MECHANISMS FOR EFFICIENT INVESTMENTS AND OPTIMAL
ZONES IN REGIONAL POWER MARKET
by
Ivan ANDROČEC a* and Slavko KRAJCAR b
a
Strategy and Corporate Development Department, Croatian Electricity Utility, Zagreb, Croatia
b
Faculty of Electrical Engineering and Computing, University of Zagreb, Zagreb, Croatia
Original scientific paper DOI: 10.2298/TSCI1403755A
The paper is result of research different cross-border electricity trading mechan-isms impact. Focus is on investments in generation and transmission power sys-tem facilities in regional market. Assumptions include efficient market coupling mechanism (with more bidding zones), use of additional investment indicators (like social welfare and congestion cost) and security of supply issues (capacity mechanisms). There is discussion on cost benefits analysis for particular market participants and there is possibility of risk reduction for regional power system expansion. It is shown current state-of-the-art, problems and trends in solving some aspects of market integration and investment issues. In some cases smaller and well defined bidding areas are absolutely essential in order to ensure system security and economic efficiency. There is no single criterion for power system expansion but it is possible to use combination of incentive schemes and possible through one index for cross-border trade. Risk management for cross-border electricity trading through several areas needs to be upgraded with use of finan-cial transmission rights like weighted average area prices, respectively. Regional power system security is closely associated with timely investments in energy supply in line with economic development and environmental needs. Security of supply indicator is deriving an estimation of security of supply improvement from the market based simulation results when a generation or transmission invest-ment project is impleinvest-mented. All researched makes market integration and in-vestments in Europe more efficient and gives more correct signals to market par-ticipants in regional market.
Key words: investments, regional power market, bidding zones, cross-border electricity trading, congestion cost, social welfare, security of supply, risk
Introduction
A well-functioning energy market should provide price signals which promote effi-cient investments in regional power market and security of supply. Market mechanisms like congestion management mechanism, transits via few areas, investments in generation and transmission power system facilities and risk management are influencing electricity trading and investment solutions. Solutions in European electricity markets are converging to market coupling firstly via regions and after region coupling in single electricity market. Although the situation is better in comparison to start of liberalization process there are still different imbalances which can be solved with more efficient mechanisms. This paper is researching
possibilities of efficient electricity trading mechanisms through improved models and crite-ria’s and via examples on simpler simulations is shown benefits and costs for different market participants (generators, suppliers, system operators) and is better illustrated impacts of com-mercial and physical flows, market mechanism interactions and risk division as well as in-vestment conditions. Implementation of those solutions could be established efficient regional market with impacts on market participants through criterion of social welfare.
On this topic is several literature especially regarding investments or optimal expan-sion of generation and transmisexpan-sion infrastructure and few of them is regarding bidding zone configuration. A short review of several research publications on the topic is shown in the paper and here in introduction are shown few remarks on main and additional papers nected with the topic. Main reference papers are [1-21] and additional papers indirectly con-nected with the topic are [22-36] including journals referred in SCI.
The Electricity Regulatory Forum (Florence Forum) is currently addressing cross-border trade of electricity, in particular the tarification of cross-cross-border electricity exchanges and the management of scarce interconnection capacity. Possible solutions regarding efficient investment in generation and transmission and security of supply are integration of rene-wables into the market (power exchanges), Energy Infrastructure Package, Region-al/European Union (EU) generation adequacy assessment, EU compatibility criteria for Ca-pacity Remuneration Mechanisms according to Eurelectric, and efficient congestion manage-ment mechanisms (with better definition of bidding zones), inclusion of social welfare incen-tive, wide use of financial transmission rights and introduction of security of supply indicator – this topics are explained in the paper.
Basic criterion for market integration is: benefits ≥ costs. Golden rule: the easiest to implement provide the most benefit. It is necessary to have a broad perspective and consider both technical and economic elements and market. There are inter-relationships between me-chanisms for congestion management, transit, trading, investments, and tariffs. How do these models interact? Power exchanges have boost electricity trading as well as continued market integration process. Markets in different stage of development and liquidity on power ex-changes also impact on electricity market development. Investors look on long term signals via physical and financial products – hedging future risks. Presently, power markets receive distorted market signals and in some cases peak prices are lower than base prices as well as the difference between peak prices and base prices are less and less. Final end-user prices are on the rise while wholesale prices are going down (taxes and levies are piling up) – e. g. wholesale price is only 15% of the total end-customer price in Germany [1].
Regulation on Trans-European Energy Infrastructure Guidelines addresses infra-structure challenges to ensure true interconnection in the internal market, integration of ener-gy from variable renewable sources and enhanced security of supply. For projects identified as projects of common interest (PCI), the Regulation introduces measures to accelerate per-mitting procedures, including through a maximum time-limit and streamlining of environ-mental assessment procedures. The Regulation also provides better incentives to investors through enhanced regulatory provisions, and it sets the conditions for EU financial assistance under the proposed Connecting Europe Facility [2].
conges-tion management (2012) is trying to make more efficient congesconges-tion management methods with impact on market participants. Bidding zones should be along structural congestion lines rather than national borders. European countries use zonal pricing with different implementa-tion: price zones fixed and equal to country (e. g. Germany, Belgium, France); price zones fixed, but several zones within a country (e. g. Italy, Norway, Sweden); smaller price zones flexible according to network congestion or full nodal pricing (under investigation).
It is known from literature that bigger bidding zones (like Germany) would be better split to at least two zones and reality is that this zone is even bigger (Germany and Austria is single price zone) and neighboring countries have additional physical flows (loop flow) through their zones which impact on capacities, market and congestion rent. This splitting of Germany could be optimal for Central East European countries, but might not be optimal outcome for Austria, Switzerland, Denmark and Sweden. So, this improvement of market mechanisms for investment in electricity infrastructure has always two sides, but costs, bene-fits and social welfare of both sides together needs to be addressed. It is shown mechanism for optimal zones based on combination of nodal price calculation and zonal price calculation based on location of transmission congestion and area/node price difference – if prices are similar more nodes/areas make one zone (flexible bidding zones).
Paper researches additional criteria for optimal power system expansion especially for investments in cross-border transmission projects and power plants investments. Possible criteria are connected to maximization of social welfare, congestion cost and hours between areas (bidding zones), investment indicator, security of supply, and its impact as short and long term signals for use through appropriate financial mechanisms. There is no single crite-rion for power system expansion but it is possible to use combination of incentive schemes and possible through one index for cross-border trade. It is researched between regulated and merchant investments and there are shown positive and negative examples of cross-border interconnection investments in regional market. There is discussion on cost benefits analysis for particular market participants and there is possibility of risk reduction for power system expansion [3].
Additional criteria for optimal expansion of regional power system
Congestion management is one of the main concerns. It has an impact on the level of electricity prices and it should be a key instrument for determining investments in generation and transmission. Today, each area has its own clearing rules and its own allocation techniques. The challenges are therefore to study and implement new options that would increase overall electricity market efficiency and reduce congestion costs significantly. The successful implementation of flow-based market coupling approach should be extended to address congestion management, balancing markets and capacity reserve markets within a joint unified approach all over Europe leading to a set of coherent interacting tools able to address all these complex issues at once.
Given a congested two node network the marginal increase of capacity will provide the investor with a dividend equal to the shadow price of the transmission constraint if he is rewarded by a financial transmission right (fig. 1). Extension will take place until the costs for new capacity equals the shadow price of congestion. In contracts an incumbent will weigh the investment costs with the reduction of congestion rent from its inframarginal units [4, 5].
Figure 1. Social welfare and congestion cost connected with investment in cross-border interconnection [4, 5] (for color image see journal web site)
Congestion cost is a good measure from a society perspective, but not a fair measure of TSO short term performance. This indicator is affected by merit orders on both sides of the border which are the major drivers for congestion costs. Maximization of cross-border capaci-ties has a clear value to cross-border trade and can to a large extent be influenced by TSO. A small improvement could increase available capacities across all timeframes (which can be a critical market benefit even if realized only for a few hours per day). But maximization of cross border capacities at all costs should not be rewarded.
Usually implicit auctions give a higher rent for the TSO as in explicit auctions the uncertain-ties for traders are higher.
As congestion revenues indicate how much market participants value the possibility for cross-border trade, congestion rent could be a good criterion to determine at which inter-connection capacity should be increased. Congestion rent can be easily compared with the cost of any potential investment to remove congestion. In many countries congestion rents are collected from several borders. An interconnector investment affects the market price and thus also affects congestion rents at all borders, not only at the border at which the new inter-connector is built. Thus it is necessary to take into account the combined effect, not just the increase of congestion rents at one border. It has been discussed whether the whole transmis-sion infrastructure could be financed through congestion rents. A general conclutransmis-sion of this discussion has been that even if a considerable share of the investments can be made using congestion rents, it is usually not possible to cover all transmission costs from them. The con-gestion rent declines when the cross-border capacity is close to the price convergence level. This decrease in congestion revenues could discourage TSO to invest up to the overall welfare optimum level. TSO not interested in undertaking efficient investment projects would have to transfer the congestion rents to a “Regional Interconnection Fund” to finance other intercon-nection projects of regional interest.
By using investment indicator the costs and benefits (= social welfare) of an invest-ment would be weighed against each other. This general principle of comparing costs and benefits of market integration measures taken should theoretically be part of all indicators. However, defining the benefits and costs within this indicator is the key issue with regard to its implementation [6].
Social welfare generated by cross-border flows is a very good measure from a socie-ty perspective. However, this indicator is also dependent on external factors (e. g. change in demand and supply curves). Some definitions of a market benefit include an aspect of facili-tating competition in the generation of electricity. It is difficult to well-define any metric sole-ly relating to facilitation of competition. If transmission reinforcement has minimized conges-tion, that has facilitated competition in generation to the greatest extent possible. The reduc-tion of congesreduc-tions is an indicator of social and economic welfare assuming equitable distri-bution of benefits under the goal of the European Union to develop an integrated market (per-fect market assumption). This indicator has been already explained before.
The social and economic welfare benefit is calculated from the reduction in total generation costs associated with the grid transfer capabilities (GTC) variation that the project allows. By removing network bottlenecks that restrict the access of generation to the full Eu-ropean market, a project can facilitate increased competition between generators, reducing the cost of electricity to end consumers. Similarly, a project can contribute to reduced costs by providing a direct system connection to new, relatively low cost, generation. This cost reduc-tion is calculated from an economic assessment to determine the optimum cost of total gen-eration dispatch, with and without the project.
the opposite result. This analysis only takes into account the effect on the electricity market in the respective countries caused by the new interconnector. A corresponding case is illustrated by fig. 2, which shows the impact of an (additional) exchange between two countries (for example cable between Italy and Croatia). While exports lead to increased production costs in country 2 (Croatia), these are significantly lower than the corresponding reduction of produc-tion costs in country 1 (Italy). In contrast, while imports have only a negligible impact on market prices and thus market payments in country 1, they result in marked increase of the market price and thus market payments in the much smaller country 2. Under these circums-tances, the market may actually see higher costs; in some cases, we have actually observed corresponding effects in our simulations as well. It is therefore important to note that any changes in market payments are not only a function of changes in costs, but that they also signal a redistribution of income between producers and consumers.
Figure 2. Case of increasing market payments under reduced congestion [7] (for color image see journal web site)
The main role of power plants and interconnectors is, in addition to providing sys-tem security back-up to national syssys-tems, to optimize the overall syssys-tem by allowing some higher cost generators to be replaced by lower cost generators in the regional dispatch. This means that a regional approach based on optimizing social welfare when deciding on building an interconnector or power plant is very appropriate. So if the investor goals in investment are the same as increase of social welfare this investment needs to be prioritized on regional level. The long run general equilibrium consequences of any voluntary trade are always beneficial. This is due to the fact that resources in the importing country can be reallocated to be better used in other sectors, and in the exporting country resources will be allocated to the electricity industry from less value creating sectors. It is very difficult to forecast the generation mix for the lifetime of a transmission investment. Also, the supply curve is dynamic in time, for ex-ample the gas, coal and emission allowance price fluctuations modify the supply curve conti-nuously. Further, the merit order of power plants can change over time. It is important to note that, contrary to power plant profitability, interconnector profitability is not dependent on the absolute levels of market prices but on the price difference between two markets. The advan-tage of using real bids instead of synthetic supply curves is that they include the strategic behavior of companies [8].
con-sumer surplus and congestion rent is higher than the investment costs. However, there can be important distributional effects. In the low price zone, part of the consumer surplus will be transferred to the producer surplus as the price increases. Equally, in the high price zone part of the producer surplus will be transferred to the consumer surplus, as the price decreases [9].
Combination of incentive schemes into one index for cross-border trade:
1
Index for market integration n wight indicator
i
i i
=
= ∑ × (1)
For example, different incentives could be weighted 0.5 for social welfare and con-gestion cost respectively – depending on influence of these signals on regional market. So, for different regional markets this could be weighted differently.
A merchant investor might decide to invest in an interconnector if the project yields a positive net present value. The appropriate discount rate will depend on the weighted aver-age cost of capital (WACC) of the investor, possibly adjusted for the project specific level of risk. To determine the cash flows, the (estimated) costs of building and operating the inter-connector are compared to the (estimated) private benefits, i. e. either the difference between prices at either end of the interconnector multiplied by the flow (congestion rent) or a regu-lated usage tariff multiplied by the flow.
In general there are no economic incentives for investing in cross-border transmis-sion capacity. The only situation where incentives exist is to build transmistransmis-sion capacity from a country with lower prices and excess capacity (e. g. Norway) to a country with high prices short of generation capacities (e. g. The Netherlands) – see tab. 1. However, also in this case the uncertainty for any investor is very high because there is no guarantee at all that this price difference will prevail.
A generation company or a big consumer would be a natural candidate for building merchant interconnectors. They could themselves benefit from the interconnector capacity for addi-tional exports or imports. Even more important could be the influence on prices in the price zones which the interconnector is connecting. A generator would build export capacity to increase the price level in its
own zone. Thus the logic of a generation company building a merchant line would be quite similar to the logic of a vertically integrated TSO building the line. The difference is in the treatment of congestion rents which in the case of a TSO are considered to be part of the regu-lated income but in the case of a merchant investor can generate non-reguregu-lated profits, de-pending on the exemption decision.
By splitting up a single bidding zone along structural grid congestions different pric-es will evolve in the splitted areas. Thus, higher electricity pricpric-es in the congpric-ested (generation deficit) bidding zones will give locational signals to generators to invest in this zone. As a consequence new generation capacities near the load will reduce load flows from other areas and reduce congestion [11].
Table 1. Investment example Netherlands-Norway (NorNed cable) – 580 km, 400 kV, 700 MW, €300 million [10]
Yearly effects of investment [€ Million] Amount
Investment cost
Cost of connecting NorNed to Dutch grid Cost already made in preparation
Gross trading margin
Loss of power due to heating of the line Consumer surplus Netherlands
Producer surplus Netherlands Security of supply
Discussion on benefits from interconnector economics (between two areas) is avail-able in [12]. Costs and benefits from exchange between hydropower system and thermal pow-er system for example of NorNed or BritNed evaluation is shown in [13]. Thpow-ere should be consistency between expected benefits and the risk-adjustment of the discount rate in an eco-nomic cost-benefit analysis [14].
While market coupling is an unequivocally good thing for cross-border trading effi-ciencies, it poses an additional challenge for merchant projects since the revenues for inter-connector owners will stem directly from the uncertain and volatile price differentials in the day-ahead auctions typically used to couple markets. Market coupling without accompanying hedging or long-term contracting options has a significant impact on attracting merchant in-vestment and financing, as well as covering costs. Merchant interconnectors with debt finance will need to be financed or operated as infrastructure investments with very conservative lender risk appetite, which is a requirement to be at the fully contracted end of the spectrum of earnings profiles in order to receive an investment-grade credit rating and associated debt terms [15].
Examples of definition on bidding zones and impacts on investment decisions and trading
We assume that 4 TSO are involved on the basis of example from [3] and [16]. The calculations are based on optimal power flow, which means that the nodal prices reflect mar-ginal cost and/or marmar-ginal willingness to pay in every node. That implies optimal dispatch. A MATLAB algorithm is used to find the optimal load flow and the corresponding nodal prices in every node in the network.
In the base case on fig. 3 we can see that the area 1 is the lowest price area, the area 4 is the highest, and 2 and 3 are between. In the area 2, generator 3 is not running because it is the most expensive, as well as the second generator in node 11. Generator 1 and the first generator in node 11 are running on maximum capaci-ty because they are the cheap-est. The congestion occurs between areas 3 and 4. Tran-sit (minimum of import/ /export) is 237 MW in area 1 and 51 MW in area 2. The area 3 is an export region and the area 4 an import region. Total flow between areas is 999 MW, accounting for 12.5% of actual generation. Due to losses (total losses are 89 MW), there will be slightly less power sold at the high price end then bought at the low price end, but that is Figure 3. AC OPF in base case scenario of 11 nodes and
overcompensated for by the price difference. Total costs in the system are 150,539 EUR/h, minimum nodal price is 21.7 and maximum 26.3 EUR/MWh.
If we define zones according to the principle if nodal prices are similar then we need to see what is similar. In first definition we will define it as “if difference between nodal pric-es is lpric-ess than 0.5 €/MWh then nodal pricpric-es combine one zone”.
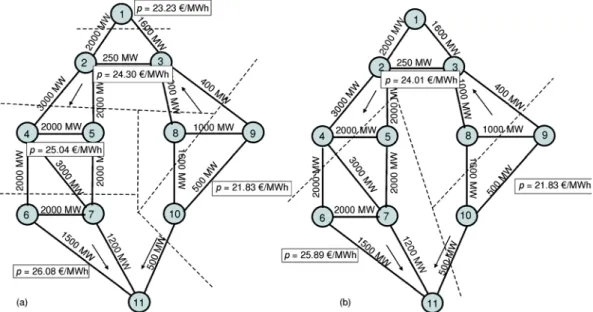
According to this principle results of defining zones are shown on fig. 4(a). We have formed 6 zones whit different prices. Area 1 and area 3 splits into two zones each promoting export generators. Area 4 has been coupled with half of area 2 concerning the interest of im-porting consumers. So in general, social welfare of this region is increased due to higher sur-pluses than in fixed zones. TSO should in this case receive lower congestion rent due to less difference in prices, except between 10 and 11 where economic signal for transmission in-vestment is stronger. Stronger inin-vestment signal is also in zone 6-7-11 for increase of cheaper generator.
Figure 4. Formation of 6 smaller zones according to nodal prices and without definition of area (country) borders (a) and formation of 3 bigger zones according to nodal prices (b)
In second definition we will define the zones as “if difference between nodal prices is less than 1 €/MWh then nodal prices combine one zone”. According to this principle results of defining zones are shown on fig. 4(b). We have formed 3 zones whit different prices. This is probably more appropriate for market participants due to fewer zones, especially for intro-duction of financial transmission rights. It is clear improvement for electricity trading but the economic signals are less strong then in previous case, so the market participants receive little bit less feasible results for going into investments.
6,458 EUR/h, and nodal prices will range from 17.9 to 36.4 EUR/MWh. The highest price is in area 4 because the expensive generator needs to be in operation. In this particular case, we can see that there would be winners and losers in the areas if we don’t have interconnected areas. So, there is a visible advantage of interconnected areas, where the cheapest generators will be used first – that is an advantage of electricity trading. On the other hand, customers in export areas (area 1 and area 3) will have cheaper price if they are not connected to other areas. But, in that case generators will not have the opportunity to increase generator’s surplus and, consequently, social welfare will be reduced. We can also notice that the area 3 will have biggest benefit of connected areas because in the base case they are connected with the area 4 and via this line they can increase the social welfare. Here we have the signal of maximizing social welfare and that is an advantage of regional market.
In the case illustrated on fig. 5 we have split upper zones into more flexible ones and we have received the highest price not in 11 as in previous cases but in 5 which became separate zone and market participants received strong signal for investments. Social welfare has been reduced due to higher congestion costs and TSO receive more revenue than before. In this case regula-tor should decide if it is more appropriate to invest in transmis-sion or in cheaper generator. If this is only temporary conges-tion, it could be seen that welfare reduction is concentrated only on small part (one node) of the re-gional power system, and the rest of region has still benefits of flexible definition of zones. In all this cases zones on the bot-tom of region are fixed, which can show the difference between structural and temporary problems in the power system.
It is clear that different ways of dividing the grid into zones, and also to determine transfer limits between zones, lead to quite different market outcomes and regional signals. For re-gional market is illustrated that in these case market results are more approached to use of the cheapest generators (power plants) which maximize social welfare. Further work is needed to test proposed mechanisms in real system (Regional or/and European model). From regional solution(s) we need to find efficient and market participants „friendly” single European solu-tion.
Security of supply in regional power market
Regional energy market is about investments, economic development, security of energy supply and social stability. Efficient cross-border electricity trade increase regional Figure 5. Formation of 6 bigger zones in case of
market integration. For more benefits from electricity trade we need more investments. Inte-ractions between decentralized decisions of participants and mechanisms have different costs and benefits for participants. The objectives defined in the regional energy strategy are creat-ing competitive integrated energy market, attractcreat-ing investments in energy and providcreat-ing secure and sustainable energy supply. Improving energy security implies, among others, to promote diversity, efficiency and flexibility within the energy sectors of the areas in region, to be prepared to respond to energy related emergencies, and not least to promote regional co-operation with all players in the energy markets. Energy security is closely associated with timely investments in energy supply in line with economic development and environmental needs. That includes connecting new generation and transmission capacities, integrating ener-gy markets, enhancing the security of supply, and improving the reliability and quality of energy services provided [17].
Security of supply is the ability of a power system to provide an adequate and secure supply of electricity in normal conditions, in a specific area. Security of supply indicator is deriving an estimation of security of supply improvement from the market based simulation results when a generation or transmission investment project is implemented. Tighter and stronger coordination between regional market participants should improve all this mechan-isms and regional cooperation should improve investment levels and security of supply.
EU Directive 2005/89/EC establishes measures aimed at safeguarding security of electricity supply so as to ensure the proper functioning of the EU internal market for electric-ity, an adequate level of interconnection between Member States, an adequate level of genera-tion capacity and balance between supply and demand. When adopting policy implementagenera-tion measures, Member States must take certain elements into account, in particular the need to [18] ensure continuity of electricity supplies, study the internal market and the possibilities for cross-border cooperation in relation to security of electricity supply; reduce the long-term effects of growth of electricity demand; introduce a degree of diversity in electricity genera-tion in order to ensure a reasonable balance between different primary fuels; promote energy efficiency and the use of new technologies; continuously renew transmission and distribution networks to maintain performance.
The Electricity Directive 2009/72/EC already envisages Tender Procedures for new generation capacity in the interest of security of supply. So, security of supply consists of five “A” elements [19]:
– availability: availability and physical existence of sufficient energy sources; giving priority to domestic energy resources,
– accessibility: access to cross-border interconnectors, domestic infrastructure, storage fa-cilities and supply routes with sufficient capacity and non-discriminatory access,
– affordability: prices for energy supply and transport services shall be transparent at rea-sonable costs,
– acceptability: exploration and exploitation must be environmentally sound and taking into account sustainability,
– adaptability: ensuring of technical integrity (codes and standards) and quality of energy (physical and chemical composition) among interconnected energy systems.
re-serves, import routes, etc. – devising strategies and policies for the next 10-20 years. Some results of security of supply indicators project are available in [19].
All indicators need to have weighted average which says how much impact it has on security of supply. The best test of these indicators is scenario when we have maximum load with extreme cold weather conditions (winter) or extreme hot weather conditions (summer) or when we have minimum load (during spring). So, combinations of these aggregate indicators with weighted average for each of them could give the best performance for security of supply.
An energy(-only) market should be able to deliver resource adequacy and system flexibili-ty, if:
– the market is allowed to function unhindered, – demand is able to respond and actually
responds to (short-term) price signals,
– prices are allowed to vary freely, according to the interplay of demand and supply, – at times of scarcity, prices could increase up to the level of VoLL, presented in fig. 6.
VoLL is explained with the following equation:
f _ el ub pop
tot
GDP h (1 fs )n w
VoLL
EC
+ −
= (2)
where VoLL [kWh] is the value of lost load, GDP [€] – the gross domestic product, ECtot [kWh] – the total annual electricity consumption, hf_el [hour] – the hours of free time depen-dent on electricity, fsub [€/h] – the factor of substitution for electrical free time, npop is popula-tion, and w – the average wage after taxes.
Investors have confidence in a stable policy and regulatory regime, that policymak-ers and regulators will resist the temptation to intervene when prices reach and remain at very high levels, investors are satisfied that the return to their investment comes from infrequent price spikes. As long as these conditions are not met, there is no guarantee, even once the EU electricity market integration process is completed, that an energy-only market will be able by itself to deliver the required level of resource adequacy and system flexibility. The full com-patibility of any capacity remuneration arrangement with the internal energy market should be
ensured. An enabling investment climate should promote the participation of new tech-nologies and demand response in ancillary services markets [1].
VOLL is presenting price of not supplied kWh. Estimation of VOLL in international studies is from minimal 3 €/kWh till 12 €/kWh (fig. 6). In South East Europe Region we can estimate that VOLL is minimal 4 €/kWh.
Improved Security of Supply (SoS): Ade-quacy measures the ability of a power system to supply demand in full, at the current state of network availability; the power system can be said to be in an N-0 state. Security measures the ability of a power system to meet demand Figure 6. Estimation of VoLL (value of
in full and to continue to do so under all credible contingencies of single transmis-sion faults; such a system is said to be N-1 secure. Security of Supply is the ability of a power system to provide an adequate and secure supply of electricity in normal conditions, in a specific area. The assessment shall be focused on a delimited geographical area. The boun-dary of the area may consist of the nodes of a quasiradial sub-system or semi-isolated area (e. g. with a single 400 kV
injection). The system is at risk if the given contingency criteria are not fulfilled during 10 years following its commissioning. As an example, a simple indicator is shown in fig. 7 – deriving an estimation of security of supply improvement from the market based simulation results (a duration curve of power flow in a cross-section under study) when a project is im-plemented. Grid transfer capabilities with (GTC) the project have to be known.
Inclusion of risk management
With higher risk profiles, investors are looking for earnings based on both the value of interconnector capacity driven by underlying price differentials (intrinsic) and volatility (extrinsic) to justify higher returns. In addition, at the more conservative end of the lending spectrum, investors will want to be exposed to very few market risks but, at the same time, there is inevitably higher risk in the extent to which extrinsic value will be realized. While market coupling is an unequivocally good thing for cross-border trading efficiencies, it poses an additional challenge for investment projects since the revenues for interconnector owners will stem directly from the uncertain and volatile price differentials in the day-ahead auctions typically used to couple markets. Market coupling without accompanying hedging or long-term contracting options has a significant impact on attracting investment and financing, as well as covering costs [15].
An FTR (financial transmission right) relates to a zone-to-zone transaction, without having to specify by what route the electricity travels from one zone to the other. This benefits both the TSO in being able better to calculate ATC, and the user, as not having to worry about the specific route either. A market in financial derivatives organized by third parties can offer cross-border hedging possibilities for market participants like CfD (Contract for Differences). A con-tract for differences (CfD) means that two counterparties voluntarily agree an equalization pay-ment between themselves that converts future exposure to a variable price into a fixed price. CfD can be purchased to hedge spatial price differences between price areas. It is also possible to hedge the price area risk by trading a set of CfD for the difference between the system price and the different area prices.
Financial transmission rights (FTR) obligation is right to collect payment from (or an obligation to pay) the price difference associated with transmission congestion between destina-tion and origin for a specified contract quantity. Financial transmission rights (FTR) opdestina-tion is right to collect payment from the price difference associated with transmission congestion be-tween destination and origin for a specified contract quantity. If the price difference is negative the payoff is zero. CfD cannot replace transmission rights because there is not a natural balance between supply and demand in all bidding zones and therefore no balance between natural
ers/sellers of CfD. TSOs are natural sellers of transmission capacity and shall sell transmission rights between all bidding zones. A system of financial transmission rights (FTR) is created to enable generators to hedge uncertainty in congestion costs. These rights would be defined as point-to-point or point-to-region rights that would pay the difference between one location’s price and the price at the second location or a weighted average of prices for several locations, respec-tively.
A measure to solve this issue would be a Financial Transmission Right compensating the price differential between one locational area price and a system price for the coupled market area (usually a volume weighted average of the locational prices in the area). However such a solution would require a strong cooperation as receivers of individual congestion rents and payers to FTR holders would fall apart. A joint collection and compensation mechanism of all TSO involved in the flow based market coupling would be needed. A potential structure for a compen-sation funds is depicted in fig. 8.
Figure 8. Financial transmission rights and contracts for differences [21] (for color image see journal web site)
Conclusions
European solution for electricity market integration is converting to one possible so-lution with its positive and negative implications on cross border electricity trading develop-ment. Costs and benefits are illustrated with impacts on different market participants (genera-tors, suppliers, TSO) in different examples. Different ways of dividing the grid into zones, and also to determine transfer limits between zones, lead to quite different market outcomes. The correct definition of bidding areas is a crucial element of market design to ensure eco-nomically efficient and secure operation of the interconnected power system, as well as cor-rect pricing of capacities. It is shown more efficient method for optimal zones in a way of splitting on more flexible areas with its prices based on location of congestions and nodal prices.
Additional criteria for power system expansion are defined with best performance of their combination and especially taking into account social welfare and socio-economic con-gestion costs. Choice of additional criteria for optimal power system expansion depends on several indicators like number of congested hours, congestion costs, maximization of social welfare, complex and simple investment indicator, optimization of the distribution of trans-mission capacities among the different timeframes, improved security of supply and others. It is possible to use combination of incentive schemes into one index for cross-border trade. Combination of aggregate indicators with weighted average for each of them could give the best performance for security of supply in regional electricity market.
Inclusion of risk management for few trading areas includes use of financial trans-mission rights like weighted average of prices for several areas, respectively. Further work is needed to test proposed mechanisms in real system (Regional or/and European model). From regional solution(s) we need to find efficient & market participants „friendly” single Euro-pean solution.
References
[1] ***, The Electricity Regulatory Forum (Florence Forum), 2013
http://ec.europa.eu/energy/gas_electricity/electricity/forum_electricity_florence_en.htm
[2] ***, Green Paper: A 2030 Framework for Climate and Energy Policies, Brussels, 27.3.2013,
COM(2013) 169 final, European Commission
[3] Androcec, I., Impact of Cross Border Electricity Trading on Regional Market Participants, Ph. D. thesis, Faculty of Electrical Engineering and Computing, University of Zagreb, Zagreb, 2012
[4] Saguan, M., Investment in Electricity Infrastructure, Focus on EU Cross-Border Interconnections, http://www.microeconomix.fr/sites/default/files/import2/110520%20Saguan%20-%20Investment%20in %20electricity%20infrastructure.pdf
[5] Weigt, H., Modeling Competition and Investment in Liberalized Electricity Markets, Ph. D. thesis, Technical University Dresden, Dresden, Germany, 2009
[6] ***, ERGEG, Incentive Schemes to Promote Cross-Border Trade in Electricity, Bruxelles, 2009 [7] ***, KEMA, Analysis of the Network Capacities and Possible Congestion of the Electricity
Transmis-sion Networks within the AccesTransmis-sion Countries, Bonn, Germany, 2005
[8] Rious, V., The Efficiency of Short Run and Long Run Locational Signals to Coordinate Generation Location with Lumpy Transmission Investments, http://www.iern.net/portal/page/portal/ ICER_HOME/ IERN_ARCHIV/Publications/Access%20Investment%20Tariffs/57B63A251F481CA7E040A8C03C2F 55BD
[9] ***, EU Involvement in Electricity and Natural Gas Grid Tarification, THINK Report, 2012
[10] Jong, H., Towards a Single European Electricity Market, a Structured Approach to Regulatory Mode Decision-Making, Ph. D. thesis, Delft University of Technology, The Netherlands, 2009
[12] Turvey, R., Interconnector Economics, Energy Policy, 34 (2006), 13, pp. 1457-1472 [13] ***, ECON Report 2004-10, Discount Rates for Transmission Investments, 2004
[14] Onofri, L., Contracts, Investment Incentives and Efficiency in the Restructured Electricity Market, European Journal of Law and Economics, 16 (2003), 1, pp. 23-28
[15] Patel, I., Building Stronger Links, Report, Redpoint Energy, London, 2011
[16] Wangensteen, I., Power System Economics – the Nordic Electricity Market, Tapir Academic Press, Trondheim, Norway, 2007
[17] ***, Energy Community, Energy Strategy of the Energy Community, 2012
[18] ***, Directive 2005/89/EC of the European Parliament and of the Council of 18 January 2006 Concern-ing Measures to Safeguard Security of Electricity Supply and Infrastructure Investment
[19] ***, MODVESS, Monitoring Dependence and Vulnerability of Energy Supply System with the Scope on Security of Supply, IPA2008 twinning project, http://modvess.mingo.hr/default.aspx?id=14
[20] Praktiknjo, A., The Price of Supply Security of Electrical Energy Against Terrorism, 10th IAEE Euro-pean Conference, http://www.aaee.at/2009-IAEE/uploads/presentations_iaee09//Pr_22_Praktiknjo mm
_Aaron.pdf
[21] Kristiansen, T., Risk Management in Electricity Markets, Ph. D. thesis, Norwegian University of Science and Technology, Trondheim, Norway, 2004
[22] Reinhard, H., et.al., The Relevance of Crossborder Transmission Capacities for Competition in the Continental European Electricity Market, Global Energy Issues, 29 (2008), 1/2, pp. 28-54
[23] Bjorndal, M., Jornsten, K., Benefits from Coordinating Congestion Management – the Nordic Power Market, Energy Policy,35 (2007), 3, pp. 1978-1991
[24] Richard, G., Electricity Liberalisation in Europe – How Competitive Will It Be?, Energy Policy, 34 (2006), 16, pp. 2532-2541
[25] Daxhelet, O., Smeers, Y., The EU Regulation on Cross-Border Trade of Electricity: a Two-Stage Equi-librium Model, European Journal of Operational Research, 181 (2007), 3, pp. 1396-1412
[26] Pe´rez-Arriaga, I. J., Olmos, L., A Plausible Congestion Management Scheme for the Internal Electrici-ty Market of the European Union, Utilities Policy, 13 (2005), 2, pp. 117-134
[27] Creti, A., et.al., Integration of Electricity Markets in Europe: Relevant Issues for Italy, Energy Policy, 38 (2010), 11, pp. 6966-6976
[28] Foley, A. M., et.al., A Strategic Review of Electricity Systems Models, Energy, 35 (2010), 12, pp. 4522-4530
[29] Oggionia, G., Smeers, Y., Market Failures of Market Coupling and Counter-Trading in Europe: an Illustrative Model Based Discussion, Energy Economics, 35 (2013), Jan., pp. 74-87
[30] Wang, H., On Computational Issues of Market-Based Optimal Power Flow, IEEE Transactions on
Power Systems, 22 (2007), 3, pp. 1185-1193
[31] ***, Position of CEPS, PSE Operator and SEPS Regarding the Issue of Bidding Zones Definition, MAVIR
[32] ***, Improving Incentives for Investment in Electricity Transmission Infrastructure, Report, Frontier Economics, Consentec, Budapest, 2008
[33] Zachmann, G., How Integrated Are European Electricity Markets?, http://www.scribd.com/doc/
32886770/1006-Electricity-Single-Market-PB
[34] ***, Relevance of Established National Bidding Areas for European Power Market Integration – an Approach to Welfare Oriented Evaluation, Report, Consentec: Frontier Economics, 2011
[35] Newbery, D., Strbac, G., Physical and Financial Capacity Rights For Cross-Border Trade, Report, Booz & Company, London, 2011
[36] Glachant J. M., Khalfallah, H., Identifying Benefits and Allocating Costs for European Cross-Border Infrastructure Projects, Review of Economics and Institutions, 3 (2012), 1, pp. 1-27
![Figure 1. Social welfare and congestion cost connected with investment in cross-border interconnection [4, 5] (for color image see journal web site)](https://thumb-eu.123doks.com/thumbv2/123dok_br/17309850.249134/4.892.153.747.542.793/figure-social-welfare-congestion-connected-investment-interconnection-journal.webp)
![Figure 2. Case of increasing market payments under reduced congestion [7]](https://thumb-eu.123doks.com/thumbv2/123dok_br/17309850.249134/6.892.152.749.481.666/figure-case-increasing-market-payments-reduced-congestion.webp)
![Figure 7. Security of supply indicator [6]](https://thumb-eu.123doks.com/thumbv2/123dok_br/17309850.249134/13.892.430.748.224.424/figure-security-of-supply-indicator.webp)
![Figure 8. Financial transmission rights and contracts for differences [21]](https://thumb-eu.123doks.com/thumbv2/123dok_br/17309850.249134/14.892.174.722.500.828/figure-financial-transmission-rights-contracts-differences.webp)
