Working
Paper
339
Assessing competition in the
banking industry: A multi-product
approach
Klenio Barbosa
Bruno Rocha
Fernando Salazar
CMICRO - Nº24
Working Paper Series
– • •
Os artigos dos Textos para Discussão da Escola de Economia de São Paulo da Fundação Getulio Vargas são de inteira responsabilidade dos autores e não refletem necessariamente a opinião da
FGV-EESP. É permitida a reprodução total ou parcial dos artigos, desde que creditada a fonte.
Escola de Economia de São Paulo da Fundação Getulio Vargas FGV-EESP
Assessing Competition in the Banking Industry:
A Multi-Product Approach
∗
Klenio Barbosa
†Bruno Rocha
‡Fernando Salazar
§September 2013
Abstract
This paper investigates the competitive aspects of multi-product banking operations.
Extending Panzar and Rosse (1987)’s model to the case of a multi-product banking
firm, we show that the higher the economies of scope in multi-product banking are,
the lower Panzar-Rosse’s measure of competition in the banking sector is. To test this
empirical implication and determine the impact of multi-production/conglomeration on
market power, we use a new dataset on Brazilian banking conglomerates. Consistent
with our theoretical prediction, we find that banks offering classic banking products (i.e.,
loans and credit cards) and other banking products (i.e., brokerage services, insurance
and capitalization bonds) have substantially higher market power than banks that offer
only classic products. These results suggest a positive bias in the traditional estimates
of competition in which multi-output actions are not considered.
Keywords: Bank Competition; Panzar and Rosse; Multi-product Bank.
JEL classification: L11; G21.
∗We would like to thank Claudio Lucinda for his insightful suggestions. We are also grateful to the seminar
participants at Insper Business School (Sao Paulo) for their helpful comments. The usual disclaimer applies.
1
Introduction
The global banking sector has experienced enormous changes during the last few decades. Marked growth in technological and financial innovation and strong deregulation in the sector have led to increased banking concentration and the creation of large financial conglomerates (Bikker and Haaf, 2002).
Curiously, the theoretical and applied literature has paid little attention to the competitive effects of banking conglomerates. These institutions can be defined as entities that offer finan-cial, banking and insurance services using the same corporative structure (Freixas, Lóránth and Morrison, 2007). Possession of a multi-product structure allows these companies to ben-efit from economies of scale and scope, in addition to providing greater opportunities for risk diversification when supplying this range of services as a package.1 Indeed, conglomerations and multi-product operations have become a characteristic feature of the banking sector in recent years and even received special attention in the new banking regulations drafted in the aftermath of the recent international financial crisis (see, for example, Levine, 2011).
Some studies in the literature have analyzed the cost efficiency of financial conglomerates and universal banks vis-à-vis commercial banks. Allen and Rai (1996), for instance, estimate economies of scale and scope in financial conglomerates by investigating countries with and without universal banks. Vander Vennet (2002) empirically analyzes the cost and profit effi-ciency of European financial conglomerates and universal banks. However, the only research that has addressed the effects of multi-product operations on banking competition is that of Berger and Kim (1994). Berger and Kim analyze the behavior of banks operating simulta-neously in the retail and corporate banking loan segments. The results revealed asymmetries in the degree of competition, which may be related to the characteristics of the consumers in each of these segments. Although important, Berger and Kim’s article is essentially descrip-tive and does not investigate the possible relationship between multi-production operations in banking conglomerates and competition.
This article aims, both theoretically and empirically, to fill the gap in the literature on the relationship between multi-production operations in banking conglomerates and competi-tion by studying the effects of a multi-product structure on the patterns of competicompeti-tion in the banking sector. The operating costs of multi-product banks should be lower than those of spe-cialized banks if integration allows for the realization of operational synergy. In addition, bank
1A more detailed discussion of the economic justification for the development of conglomerates may be
conglomerates may exhibit superior performance if informational or other advantages, such as multi-output production, produce positive spillover to the traditional and non-traditional banking activities that these conglomerates undertake. Because bank conglomeration can significantly change a bank’s cost structure, it may also have a significant effect on banking competition.
In this paper, we look at the behavior and the conduct of multi-product banks that supply classic bank products (i.e., loans and credit cards) and other bank products (i.e., brokerage services, insurance and capitalization bonds) as compared to those of banks that offer only classic bank products. Bank conglomerates that jointly offer classic and other bank products may benefit from economies of scope and, therefore, may be more efficient than two separate entities that specialize in offering either classic or other banking products. The sharing of inputs such as labor, technology and information across multiple outputs constitutes the major source of such potential cost savings. As documented by Vander Vennet (2002), multi-product banks are more revenue efficient than their specialized competitors, and the degree of both cost and profit efficiency is higher at universal banks than it is at non-universal banks. As Vander Vennet shows, economies of scope in bank conglomerates are one of the main forces driving improvements in measures of cost efficiency.
that lie between 0 and 1 would be typical of monopolistic competition.2
We begin by extending the original Panzar and Rosse (1987) model to the case of a multi-product bank with economies of scope and computing the multi-product Panzar-Rosse Statistic. Second, we show how economies of scope at multi-product banks affect the H-Statistic. In particular, we find that the greater the economies of scope at multi-product banks are, the lower the Panzar-Rosse H-Statistic is. This relationship exists because a multi-product bank that supplies classic and other banking products benefits from economies of scope. Economies of scope reduce a bank’s marginal costs for every product and, therefore, increase its price-cost margin (i.e., mark-up) in the banking and non-banking markets. Consequently, a multi-product bank will have a higher mark-up than the banks that supply only classic bank products. Finally, we develop an econometric strategy that allows us to test this theoretical prediction.
To test for such empirical implications, we must consider the multi-product dimension intended in our empirical analysis. Thus, the dataset must be adjusted to include the ac-counting information of banking conglomerates instead of single institutions. This strategy is data heavy because we must identify the final products and the individual institutions that compose a given banking conglomerate. In our empirical analysis, we used information on Brazilian banking conglomerates. Brazil is a perfect testing ground for the effects of banking multi-production/conglomeration using Panzar and Rosse’s (1987) measure of competition for several reasons.
First, the Brazilian regulatory authorities release accounting statements that include the information for every banking conglomerate and the individual institutions that compose each banking conglomerate in Brazil. As far as we know, Brazil is the only country whose reg-ulatory authorities provide such information. This fact is important in the present context because attempting to build accounting statements by simply aggregating individual records would produce misleading results. For example, intra-group credit operations, which could be miscalculated in an aggregation procedure, are already accounted for in the consolidated statements. Additionally, regulatory authorities also provide information on the final prod-ucts offered by each individual institution. This information allows us to identify which bank products are supplied by which banking conglomerates and which accounting statements come
2Shaffer (1982, 1983) explores the relationship between the H statistic, the conduct parameter proposed
from which banking conglomerates, which, in turn, is crucial to testing the empirical implica-tions described above. This information enables us to generate a new and complete dataset using account data for Brazilian banking conglomerates from between 2001Q1 and 2012Q4.
Based on the extension of Panzar and Rosse’s (1987) empirical test to the case of a multi-product banking firm, we infer the impact of multi-multi-production operations in banking conglom-erates on market power. We find that banks that offer classic products (i.e., loans and credit cards) and other products (i.e., brokerage services, insurance and capitalization bonds) have substantially greater market power than banks that offer classic products only. Therefore, Panzar and Rosse’s (1987) test reveals that market power is underestimated when multi-product information is not considered.
To identify which of these other banks acquire increases in market power through multi-product banking, we estimate the market power of banks that offer the following multi-products: (i) classic and other financial banking products (such as brokerage and currency exchange services), (ii) classic and other nonfinancial banking products (such as insurance, life insurance, capitalization bonds and reinsurance), and (iii) classic, financial and nonfinancial products with the banks that offer classic products only. Our estimates show that banks that offer any of these three product profiles enjoy greater market power than banks that offer only classic products. These results indicate that either financial or nonfinancial banking products may increase a bank’s market power. Our theoretical and empirical results suggest that empirical models that do not take into account the multi-product nature of banking conglomerates underestimate the market power of these conglomerates in the banking markets.
2
Panzar and Rosse’s Test and Economies of Scope in
a Multi-product Bank: Theoretical Framework
In this section, we derive a theoretical model that explicitly analyzes the behavior and conduct of a representative multi-product bank that enjoys economies of scope in supplying classic and other banking products. We begin by extending Panzar and Rosse’s (1987) original model to the case of a multi-product bank with economies of scope, computing the multi-product Panzar-Rosse H-Statistic. Next, we show how economies of scope in multi-product banks affect H-Statistics in the market for classical banking products. More specifically, we demonstrate that the greater the economies of scope for a multi-product bank, the lower the Panzar-Rosse H-Statistic. This empirical implication will be tested in the remaining sections of the paper.
2.1
The Model
Consider a representative multi-product bank that confronts a downward-sloping demand curve for classic bank products (i.e., loans and credit cards), qc(pc), and other bank
prod-ucts (i.e., brokerage services, insurance and capitalization bonds), qo(po). For the sake of
convenience, these demand curves will be represented, respectively, by the following demand functions: pc(qc) and po(qo), which relate prices pi to output qi, for i = c, o. We note that
bank elasticity of demand in the market for classic bank products and other bank products is given by ec =−∂p∂qccpqcc and eo =−∂q∂poopqoo, respectively.
Banking technology is represented by a cost function C(qc, qo;w1, w2), interpreted as the
function of managing a volumeqc of classic banking products and a volumeqo of other banking
products. For the sake of simplicity, we assume that the bank uses only two inputs (e.g., capital and labor) to produce outputs, such that w1 and w2 are input prices. We also assume that
C(.) is an increasing, convex and twice continuously differentiable function in (qc, qo). This
means that (i) ∂C∂q(.)
i ≥0,∀i, (ii) ∂2C(.)
∂q2
c
∂2C(.) ∂q2
o −
h∂2C(.) ∂qcqo
i2
≥0, and (iii) ∂2∂qC2(.)
i ≥0,∀i.
We assume that banking technology exhibits economies of scope between classic and non-classic banking products. Thus, we suppose that ∂∂q2Ccq(o.) ≤ 0. This condition means that an increase in qc decreases the marginal cost of qo. This is a particular case of economies
For the sake of simplicity, we suppose that banking technology has constant economies of scope. Formally, we assume that ∂∂q2Ccq(o.) = −γ, γ ≥ 0, where the parameter γ measures the economies of scope in banking technology. This assumption allows us to evaluate the effect of the change in economies of scope γ on Panzar and Rosse’s measure of competition, which will be computed in the next subsection.
Under the aforementioned assumptions, a bank’s profit can be expressed using the following equation:
Π = Π(qc, qo;w1, w2) =pc(qc)qc+po(qo)qo−C(qc, qo;w1, w2) (1)
where the first two terms correspond, respectively, to the revenue from classic banking prod-ucts and other banking prodprod-ucts, and where the third term corresponds to management costs. The bank’s decision variables are qc (the amount of classic bank products) and qo (the
amount of other bank products), and the bank chooses qc and qo such that it maximizes the
profit function in equation (1).
The first-order conditions, which equate marginal revenue and marginal cost in each prod-uct market, are as follows:
∂Π
∂qc
=pc
e
c−1
ec
− ∂C(.)
∂qc
= 0; (2)
∂Π
∂qo
=po
e
o−1
eo
− ∂C(.)
∂qo
= 0. (3)
The second-order conditions associated with the bank’s profit maximization problem are
∂2Π
∂q2c = pc
qc
1−e
c
e2c
+ pc
e2c ∂ec
∂qc
− ∂
2C(.)
∂q2c ≤0;
− pc
qc
e
c−1
e2c
+ pc
e2c ∂ec
∂qc
− ∂
2C(.)
∂q2c
− po
qo
e
o−1
e2o
+ po
e2o ∂eo
∂qo
− ∂
2C(.)
∂q2o
−γ2 ≥0.
As in Shaffer (1982), we assume that the elasticity of demand in both markets is locally constant (∂ei
∂qi = 0,∀i) and that the bank’s cost function is locally linear in every output
(∂2∂qC2(.)
i = 0
,∀i). Therefore, the second-order conditions can be written as follows:
∂2Π
∂q2c = pc
qc
1−e
c
e2c
D≡ pcpo
qcqo
e
c−1
e2c
e
o−1
e2o
−γ2 ≥0. (5)
Equations (4) and (5) imply that ec ≥ 1 and eo ≥ 1. This means that a multi-product
bank that faces a downward-sloping demand curve for its products, qc and qo, will always
choose to operate in the elastic region of the demand curve.
The first order described by equations (2) and (3) implicitly defines the optimal bank’s supply of classical and other banking products, (q∗
c, q ∗
o). Note that the banking products are
a function of the exogenous variable input prices, w1 and w2, and the economies of scope
parameter γ. The next proposition describes how the optimal bank’s supply of classical banking and other banking products varies when those exogenous variables change.
Proposition 1 Let q∗
c = qc(w1, w2, γ) and q∗o = qo(w1, w2, γ) be, respectively, the optimal bank’s supply of classical and other banking products, defined implicitly by equations (2) and
(3). If the banking technology has constant economies of scope, ∂∂q2Ccq(o.) = −γ, the elasticity of demand in both markets is locally constant (∂ei
∂qi = 0,∀i), and that the bank’s cost function is
locally linear in every output (∂2∂qC2(.)
i = 0
,∀i), then the optimal bank’s supply of classical banking and other banking products changes when the input prices, w1 and w2, and the economies of
scope parameter γ change according to the following expressions:
∂qi
∂w1 =
1
D
p
j
qj
1−e
j
e2j
∂2C(.)
∂qi∂w1
−γ∂
2C(.)
∂qj∂w1
, i, j =c, o; (6)
∂qi
∂w2 =
1
D
p
j
qj
1−e
j
e2j
∂2C(.)
∂qi∂w2 −γ
∂2C(.)
∂qj∂w2
, i, j =c, o; (7)
∂qi ∂γ = 1 D p j qj
1−e
j
e2j
∂2C(.)
∂qi∂γ
−γ∂
2C(.)
∂qj∂γ
, i, j =c, o. (8)
Equations (6)-(8) in Proposition 1 are key to computing a multi-product bank’s measure of competition (the H-Statistic) in the market for classical banking products using Panzar and Rosse’s method. These equations are also important to evaluating the effect of economies of scope on that H-Statistic.
Note that if we assume that the economies of scope parameter γ reduces marginal costs such that ∂∂q2C(.)
i∂γ ≤ 0,∀i, then the optimal supply of classical and other banking products
increases as the economies of scope increase (∂qi
2.2
Economies of Scope and Panzar-Rosse’s H-Statistic in the
Mar-ket for Banking Products
Panzar and Rosse (1987) developed an empirical test that allows one to discriminate between perfect competition, monopolistic competition and monopoly using industry or bank-level data. For this test, Panzar and Rosse derived an H-Statistic defined as the sum of revenue elasticities with respect to input prices. Based on H-Statistics, it is possible to investigate the extent to which changes in factor input prices are reflected in equilibrium or bank-specific revenues and then to infer market competition.
In the context of the model presented in the previous subsection, the H-Statistic of a multiproduct bank is defined as follows:
H= w1
R(w1, w2)
∂R(w1, w2)
∂w1 +
w2
R(w1, w2)
∂R(w1, w2)
∂w2 , (9)
where R(w1, w2, γ) = pcqc +poqo is the multi-product bank’s total revenue and where qc =
qc(w1, w2, γ) and qo = qo(w1, w2, γ) are, respectively, the optimal bank’s supply of classical
and other banking products. They are defined implicitly in equations (2) and (3). Note also that
∂R(w1, w2)
∂wi
= ∂R(.)
∂qc
∂qc(.)
∂wi
+∂R(.)
∂qo
∂qo(.)
∂wi
. (10)
In manipulating (9) and (10), we find that the H-Statistic of a multi-product bank is equal to
H =θHc + (1−θ)Ho, (11)
where θ = pcqc
pcqc+poqo, which is the fraction of the bank’s revenue that is derived from classic
banking products, and where Hi is the bank’s H-Statistic in the market for the bank product
i, with i =c, o. The expression (11) means that the multi-product bank’s H-Statistic is the sum of the bank’s H-Statistics for every product, weighted by the share of each product in the bank’s total revenue.
Because this paper assesses competition in the banking industry when banks exhibit economies of scope in a multi-product technology, we focus on the Hc, which is the bank’s
H-Statistic in the market for classical banking products. Hc is formally defined as:
Hc =
w
1
Rc
∂qc(.)
∂w1 +
w2
Rc
∂qc(.)
∂w2
∂R
c(.)
∂qc
whereRc =pcqc. Note that the H-Statistic of a single-product bank that supplies only classical
banking products is exactly the same as Hc when it is evaluated withγ equal to 0.
Replacing ∂qc ∂w1 and
∂qc
∂w2, defined in Proposition 1, into equation (12), we obtain the
follow-ing:
Hc =
1
DRc
∂Rc(.)
∂qc
p
o
qo
1−e
o
e2o
w1∂ 2C(.)
∂qc∂w1
+w2∂ 2C(.)
∂qc∂w2
−γ
w1∂ 2C(.)
∂qo∂w1
+w2 ∂ 2C(.)
∂qo∂w2
. (13)
To move forward, we need an intermediary result in Lemma 1.
Lemma 1 Assume that the multi-product bank is price-taker in the market for inputs (x1,x2),
and that the cost function C(qc, qo;w1, w2) is defined as
C(qc, qo;w1, w2)≡minx
1,x2w1x1+w2x2 s.t. (qc, qo;x1, x2)∈Y, (14) where Y is a production set. Then,
w1∂ 2C(.)
∂qi∂w1 +w2
∂2C(.)
∂qi∂w2
= ∂Ri(.)
∂qi
,∀i. (15)
Replacing equation (15) into equation (13), we have
Hc =
1
DRc
∂Rc(.)
∂qc
p
o
qo
1−e
o
e2o
∂R
c(.)
∂qc
−γ∂Ro(.) ∂qo
. (16)
From the equations (2) and (3) in the first-order conditions, we know that ∂Ri(.) ∂qi =
pi
h
ei−1 ei
i
,∀i. Replacing this result into the expression above, we find that
Hc =−
1
D
p
cpo
qcqo
(ec −1)2
e2c
(eo−1)
e2o
+γpo qc
(ec−1)
ec
(eo−1)
eo
, (17)
where D is as defined in equation (5).
Because we want to show how economies of scope in a multi-product bank affect the H-Statistic in the market for classical banking products, all we need to know is how Hc varies
with the parameterγ. Despite the closed formulae solution forHc in equation (17), the process
of computing the derivative of Hc with respect to γ is not straightforward. The fact thatHc
complex.3 Fortunately, we can show that Hc decreases with γ, as stated in Proposition 2. Proposition 2 Assume that the elasticity of demand in the market for classical and other
bank products is locally constant (∂ei
∂qi = 0,∀i), and that the bank’s cost function is locally linear
in every output (∂2∂qC2(.)
i = 0
,∀i). Then,
(i) we have that
dHc(γ)
dγ
γ=0 =−
qc
pc
eceo <0. (18)
In particular,
(ii) if the economies of scope parameter γ reduces marginal costs (∂∂q2C(.)
i∂γ ≤0,∀i), then
dHc(γ)
dγ ≤0,∀γ. (19)
Proposition 2 (i) indicates that if we compare the Panzar-Rosse’s H-Statistic in the market for classical banking products offered by a single-product bank with the corresponding value for a multi-product bank that supplies classical and other banking products, the latter should be lower than the former. Proposition 2 (ii) shows that the greater the economies of scope at multi-product banks are, the lower the Hc-Statistic is. These results should occur because
a multi-product bank that supplies classic and other banking products should benefit from economies of scope. Economies of scope reduce a bank’s marginal costs for every product and, therefore, increase the bank’s price-cost margin (i.e., mark-up) in the banking and non-banking market. Consequently, a multi-product bank will have higher mark-up than banks that supply only classic banking products.
The next subsection presents an econometric strategy that can be used to test for the empirical implications of Proposition 2. These empirical implications will be tested in the remainder of the paper.
2.3
The Multi-Product-Adjusted Panzar-Rosse’s Statistic: An
Em-pirical Strategy
This subsection describes the econometric model that we use to estimate the change Hc
-Statistic in the market for classical banking products due to economies of scope that emerge for
3q
multi-product banks. Following the banking literature summarized by Degryse et al. (2009), we estimate the change in market power resulting from multi-product banking operations using the empirical approach suggested by Panzar and Rosse (1987). We first estimate the financial intermediation revenue equation as a function of bank financial intermediation input prices and compute the Standard Panzar-RosseHc-Statistic and the change in theHc-Statistic
due to the economies of scope that emerge from multi-product banking technologies: namely, ∆Hc. To conclude, we obtain the Adjusted Panzar and Rosse H-Statistic for conglomerate,
multi-product banks.
The revenue equation is described by the following equation:
ln(RTit) = α+ ln(wit)′β+ ln(wit).dumM ultiP roducti′γ+Zitθ+µi+δt+εit, (20)
where ln(RTuit) is the total financial revenue of a bankiat timet. The vectorwitcorresponds
to the bank input prices. The variable dumM ultiP roducti is a dummy variable that is equal
to 1 if the bank i supplies other banking products and is equal to 0 otherwise. The vectorZit
and the variables µi, δt and εit are, respectively, the control variables, the bank fixed effects,
the time fixed effects and an erratic term that is assumed to be uncorrelated to the other independent variables in equation (20).
The usual Panzar-RosseHc-Statistic is estimated using the following equation:
Standard-H =
m
X
k=1
b
βm,it, (21)
such that each market competition yields a different Hc-Statistic. The relationship between
Hc-Statistic and market competition is described in Table 1. A monopoly situation yields a
value for Hc-Statistic that can be negative or 0. A monopolist yields values of Hc-Statistic
between 0 and 1, and perfect competition implies an Hc-Statistic equal to 1 (Degryse, Kim
and Ongema, 2009).
The change in a traditional Panzar-Rosse Hc-Statistic due to the multi-product nature of
the bank, ∆Hc, is estimated by ∆Hc =
Pm
k=1γbm,it. Therefore, the Adjusted Panzar-Rosse
H-Statistic accounting for the multi-product nature of a bank is estimated as follows:
Adjusted-H =
m
X
k=1
b
βm,it+ m
X
k=1
b
γm,it. (22)
multi-product nature (revenues and costs that stem from other banking products rather than classical banking products) is taken into account. This hypothesis is tested in the econometric model described above using the following hypothesis test:
H0: ∆Hc ≥0 and Ha: ∆Hc <0.
If we reject H0, then the market power of the bank increases when the multi-product
nature of the bank is taken into account.
For ease of notation, we suppress subscripts in the H-Statistics, such thatH and ∆H refer to the H-Statistics in the market for classical banking products for the rest of the paper.
3
Institutional Background
In this section we present the Brazilian banking system and discuss the multi-product nature of the country’s banks.
3.1
The Banking System in Brazil
The Brazilian banking system has experienced important changes in the last few decades.4 Since the implementation of the Real Plan, the sector has been characterized by strong fi-nancial deepening and changes in the sector’s structure that have led to the entry of foreign banks and market consolidation.
The first significant change in the operation of Brazilian banks was caused by the qualita-tive improvement in the macroeconomic environment. Until the early nineties, high inflation rates had guided the actions of economic agents. With the Real Plan, launched in July 1994, the Brazilian inflation rate decreased from the annual average of 715% p.a. between 1980 and 1993 to 22% p.a in December 1995.
Macroeconomic stability has increased economic agents’ predictability, increasing supply and demand for banking products, particularly credit. During the hyperinflationary period, Brazilian banking operations concentrated on gains from "floating" on basic banking services.5 With greater monetary stability and more favorable macroeconomic conditions, particularly in
4For a historical overview of the evolution of Brazilian banks, see Baer and Nazmi (2000) and Ness Jr.
(2000).
5Floating revenues can be defined as financial gains that originate from raising non-indexed and low-cost
the last decade, banking system actions have become targeted toward the traditional functions of raising funds and providing credit.
The improvement in the macroeconomic environment was not the only determinant of the recent growth in the provision of banking services. The Brazilian government has also promoted important reforms of the financial system’s institutional environment, which has contributed to the expansion of the credit markets in Brazil. Costa and De Mello (2006) argue that these governmental measures were implemented to reduce information asymmetries in the credit market, increase the quality of collateral instruments, increase the enforcement of contracts improve the regulatory system for addressing insolvency and create alternative mechanisms for credit.6
As a result of these improvements in Brazil’s macroeconomic conditions and in the institu-tional environment, the country’s economy underwent a robust process of financial deepening. The proportion of total credit to GDP increased from an average of 27% between 1998 and 2003 to 53% in 2012.
In addition to the process of financial deepening, the Brazilian banking system has also been characterized by important structural changes. The end of easy gains from floating operations induced painful adjustments in the sector. Along with the international crises of the nineties, this change created great difficulties for domestic banks, resulting in a credit crunch and increasing losses.
The problems in Brazil’s banking system in the nineties led the Brazilian government to promote a series of packages that were intended to restructure the industry. The Pro-gram of Incentives for the Restructuring and Strengthening of the National Financial
Sys-tem (PROER), Program of Incentives for the Reduction of the State-Level Public Sector in Bank Activity (PROES) andProgram for the Strengthening of the Federal Financial Institutes
(PROEF) represented the beginning of important changes in the market structure of Brazil-ian banking.7 One of these programs generated an increase in market concentration, with a reduction in the number of commercial banks. In 1996, there were 230 commercial banks authorized to operate in Brazil. By 2012, the number of commercial banks had fallen to 159. In this period, foreign banks represented the only segment of the economy that experienced
6Examples of such measures include the approval of the New Bankruptcy Law (Law 11,105/2005) and the
Law on Positive Registers (Law 12,414/2011) and the stricter rules for risk credit operation classification and provision (Resolution 2,682/1999). For further discussion of these institutional changes, see Costa and De Mello (2006).
7For a more detailed discussion, see Baer and Nazmi (2000), Ness Jr (2000) and Nakane and Weintraub
market gains. Foreign institutions such as HSBC, ABN Amro and Santander took advantage of the consolidation of commercial banks to enter the Brazilian market. As a result, the number of banks in Brazil under foreign control increased from 41 in 1996 to 59 in 2012.
Finally, it is important to stress the remarkable position of state-owned banks in Brazil. Despite the reduction in the public banking sector promoted by PROES, state-owned banks are still widespread in Brazil. Three state-owned banks, Banco do Brasil (BB), Caixa Econômica Federal (CEF) and BNDES, were the largest banks in the country in terms of total assets as of December 2012. Furthermore, state-owned banks accounted for 44% of assets, 49% of credit and 49% of total deposits in the banking sector in December 2012. The leading position of state-owned banks gives the Brazilian government an important role in credit market dynamics. For example, the Brazilian government used its state-owned institutions to provide liquidity to the markets after the global financial crisis broke in 2008.
3.2
Conglomerates in the Brazilian Banking System
An important characteristic of the Brazilian banking industry is the leading participation of banks in conglomerates. Banks in other countries are exhibiting a similar tendency, using a common corporate structure to offer a wider range of financial products.
In fact, conglomerates play a major role in the Brazilian banking market. According to BCB, in 2012 only 20% of total loans were provided by independent banking institutions. Other market indicators show an identical pattern. Additionally, banks associated with con-glomerates hold the greatest amount of total deposits (78 %), banking branches (85 %) and total assets (84 %) in Brazil.
The financial system in Brazil is composed of a large variety of individual institutions that can be roughly classified into three groups: credit, financial and insurance companies.8 The first group includes all institutions that focus on the provision of loans as their core activ-ity, including commercial banks, investments banks, housing finance and consumer finance companies. Brokers and dealers that specialize in the administration and negotiation of for-eign exchange, government bonds, corporate securities, stocks and futures contracts are the institutions in the second category. The credit and financial segments are under the super-vision of the Brazilian Central Bank (BCB) and the Securities and Exchange Commission (CVM). Finally, the insurance sector includes a variety of insurance and reinsurance
compa-8More details on the organization and the structure of the Brazilian financial system can be found in
nies, capitalization funds and entities operating private pension funds. The Private Insurance Superintendence (Susep) is responsible for supervising this insurance market.
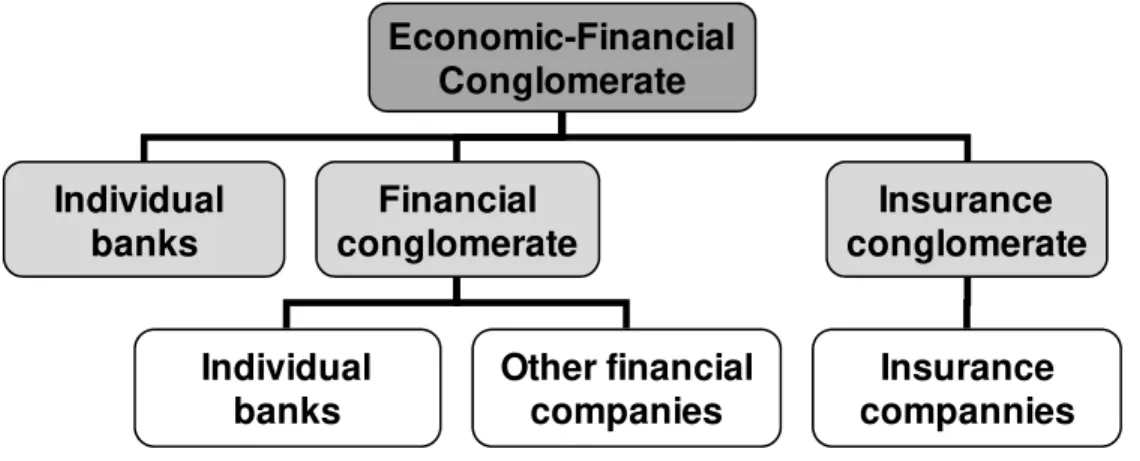
Figure 1 uses this classification to illustrate the types of conglomerates with which Brazilian banks are typically associated. At the first level, banks may form financial conglomerates in partnership with other credit institutions or financial companies. The formation of a financial conglomerate in association with other financial companies allows a bank to expand its production set beyond traditional credit lines.
A higher level of conglomeration is produced by the junction of individual banks or financial conglomerates with insurance institutions or insurance conglomerates under Susep’s supervi-sion. This type of arrangement gives rise to economic-financial conglomerates. Economic-financial conglomerates make it possible for individual banks and Economic-financial conglomerates to operate in the insurance market. These various possibilities stemming from the formation and service provision of conglomerates are the basis of the multi-product classification that will be proposed in the next section.
4
Estimation and Results
4.1
Data
As stated in the last section, Brazilian banking institutions, whether individually or as part of a conglomerate, can offer credit, financial and insurance services. To build a dataset that is consistent with this production set, we listed 526 individual institutions, including banks and financial entities supervised by the BCB and insurance companies under Susep’s supervision. Then, for each single institution, we classified the various segments according to the services that each company had been authorized to offer. The Brazilian Central Bank’s website has a complete list of services that banks and financial entities are authorized to charge for and offer.9 Insurance companies supervised by Susep were automatically assigned to the insurance segment.
The second step in the procedure is the agglomeration of individual institutions into finan-cial and insurance conglomerates. This process was based on the supervision entities’ records regarding the governance structure of conglomerates. The BCB and Susep maintain lists that make it possible to link each individual entity to its corresponding conglomerate. Finally,
using the website’s information on insurance institutions and insurance conglomerates, we matched these companies with individual banks and financial conglomerates.
Based on the procedure above and the classification proposed in Figure 1, banks may oper-ate in the Brazilian financial system by offering classic (credit), financial and insurance prod-ucts within the following categories: (i) as individual banks offering classic banking prodprod-ucts; (ii) as individual banks offering classic banking and financial products; (iii) within conglomer-ates offering classic banking products; (iv) within conglomerconglomer-ates offering classic banking and financial products; (v) within conglomerates offering classic banking and insurance products, and (vi) within conglomerates offering classic banking, financial and insurance products. Ap-pendix C provides a detailed description of the procedure used to identify different banking products (classic, financial and nonfinancial) offered by the banking conglomerates in our data set.
Brazilian banks present their statements to local regulators at three levels of consolidated accounts: economic-financial10, financial11and single units.12 The economic-financial accounts refer to groups of companies of any nature that integrate their economic groups, including financial and non-financial companies. The financial records are the accounting statements for the group of banks that have integrated their economic groups. The single units are the set of legal units with the National Registers of Legal Entities (CNPJ) whose financial statements are published monthly by their regulators: in this case, the BCB for banks and SUSEP for insurance companies.
To analyze the multi-product operation of banks as proposed in this article, we used economic-financial statements for each bank in cases (v) and (vi) because these statements cover a range of companies, including financial and insurance institutions. In cases in which the banks did not belong to any banking economic-financial conglomerate, we used information from financial records (cases (iii) and (iv)) and single units records (cases (i) and (ii)) to obtain the financial statements of the institutions operating in Brazil.
To our knowledge, Brazil is the only country for which this consolidated information on the global operations of conglomerates is available. This fact is important in the present context because the attempt to build accounting statements by simply aggregating individual records could yield misleading results. For example, intra-group credit operations, which could be miscalculated in an aggregation procedure, are accounted for in the consolidated statements.
10Economic-financial conglomerate (CONEF) records: document 4050 from the BCB. 11Financial conglomerate records: document 4040 from the BCB.
The data used in this paper were obtained from the BCB database. The data were ob-tained from the BCB ’s online reports, more specifically its Informações Financeiras Trimes-trais (IFT). These reports provide information from the financial statements of all financial institutions authorized to operate in Brazil at all three levels described above on a quarterly basis. The reports can be downloaded directly from the BCB website free of charge.13
Our final sample is an unbalanced panel composed of 74 banking conglomerates with a total of 2,219 observations, as shown in tables 3, 4, 5, 6 and 7 in the appendix. All figures are expressed in real values from 2001Q1 according to the official Brazilian consumer price index (IPCA).
Table 3 presents the number of banks and their distribution by ownership and capital origin. Most of the banking conglomerates in the sample are private and national. Only 12.1% (9) of the conglomerates are foreign, and four (5.4%) are state-owned. Table 3 shows the distribution of banks in the proposed three-product division. The majority of the banking conglomerates operate only in the classical banking segment, which indicates the prevalence of single-output operations in the banking industry. However, 30% of the conglomerates operate jointly and offer other types of products, particularly financial banking products. Finally, only 10 conglomerates are active in all three segments.
Market structure varies across the segments, with signals of higher levels of market con-centration in the multi-output definitions of supply. As we can see in the second column in Table 5, banks that supply only classic products typically have a lower average market share in terms of total assets. The average market share of classic banks is 2.8%, whereas the cor-responding figure is 15.7% for conglomerates supplying classic and other financial products and 13.7% for conglomerates supplying classic and non-financial products. The same pattern arises regardless of whether market share is calculated in terms of total revenue or whether the Herfindhal-Hirschman Index (HHI) is used to capture the level of concentration within the segments.
Finally, the banks offering each set of products are different. Tables 6 and 7 show that in general, more diversified banking conglomerates are larger and enjoy a higher market share and higher input prices. Table 6 presents figures for conglomerates that supply only classic banking products (in the third column) and conglomerates that operate simultaneously in classic and financial or non-financial products (second column). The fourth and fifth columns present the test for mean equality, with strong evidence of heterogeneity for these two types
of banks. The null hypothesis of equality cannot be rejected for the variable of fixed capital cost. On the other hand, in Table 7, we compare the characteristics of banks that supply all three products and the average characteristics of all other conglomerates. The nature of the results remains the same. On average, multi-product operations are associated with bigger banks operating in an environment with greater concentration and higher input prices.
4.2
Econometric Model
To estimate the values of Standard-H and Adjusted-H, as in (21) and (22), we run the re-gression (20) using the natural logarithm of the total revenues of financial intermediation (ln(Revenue)) as the dependent variable. The vector wit containing the input prices of
bank-ing activity is given by
• Funding expenses (ln(cost of capital)): the natural logarithm of the ratio of total expenses associated with raising funds (capital) to total assets.
• Personnel expenses (ln(wage)): the natural logarithm of the ratio of total payroll to total assets.
• Fixed capital expenses (ln(cost of fixed capital)): the natural logarithm of the ratio of total fixed capital (own and leased) to total assets.
The variable dumM ultiP roducti is a dummy variable that is equal to 1 if the banking
conglomerate i supplies financial products (e.g., interbank credit, market trades) or nonfi-nancial banking products (e.g., insurance, capitalization bonds) in addition to classic banking products and zero otherwise. We also estimate equation (20), examining the profiles of various products: (i) classic and other financial banking products (such as brokerage and currency exchange services); (ii) classic and other nonfinancial banking products (such as insurance, life insurance, capitalization bonds and reinsurance), and (iii) classic and financial and non-financial products. We compare banks that offer such products with banks that offer only classic products.
The estimated models include a set of control variables,Zit, to capture the effects of other
relevant factors on revenue:
• Profitability: the return on equity by the ratio of total profits to shareholder equity. • Market share: the banking conglomerate’s market share in terms of total assets. • HHI: the Herfindhal-Hirschman Index in the relevant market in terms of total assets.
The estimation and econometric results are presented in the following subsection.
4.3
Econometric Results
Table 8 presents several estimates of equation (20), in which the dependent variable is the natural logarithm of a bank’s financial revenue. The independent variables of interest are the input prices (ln(cost of capital), ln(wage), and ln(cost of fixed) and the interaction of input prices with the dummy variable dummy banks with classic and other banking products. The dummy variable assumes a value of 1 if the bank offers classic and some other banking products (financial or nonfinancial products) and a value of 0 otherwise. The coefficients associated with these independent variables are used to estimate the Standard-H, ∆H and Adjusted-H in order to account for the multi-product nature of the banks. These estimates are included at the bottom of the table.
Each column in Table 8 corresponds to a different estimated specification of equation (20). In all specifications, we take into account the panel structure of the dataset by including fixed effects for each bank, quarter and year. The aim is to control for unobservable bank characteristics and some trend dependence in the banks’ revenues.
In column (1) in Table 8, we estimate equation (20) using generalized least squares (GLS), in which we include only the input prices and their interaction with the dummy banks with classic and other bank products as the independent variables. In columns (2)-(4), we estimate the coefficients of interest, including the characteristics of observable banks and market struc-tures. In particular, we include the provision rate and profitability as independent variables in column (2), bank market share in column (3) and industry HHI in column (4).
(i.e., brokerage services, insurance and capitalization bonds) have greater market power than banks that offer classic products only. As a result, the estimated Adjusted-H is negative. The negative Adjusted-H suggests that banks supplying classic and other banking products operate in an environment with little competition.
To examine whether ∆H is statically negative, we test the following hypothesis: H0:
∆H ≥0 andHa: ∆H <0. The results of these one-sided tests rejectH0 at 4.7 percent at the
specification in column (1) and at 3.7 percent at the specification in columns (2) to (4). These results indicate that the estimated market power of banks offering classic banking products (i.e., loans and credit cards) and other banking products (i.e., brokerage services, insurance and capitalization bonds) is greater than the market power estimated for banks that offer only classic products. Note that the results are robust for different specifications and that the punctual estimated ∆H is approximately the same for all specifications.
To identify which of the other banking products (financial or nonfinancial products) pro-duce increases in multi-product banking market power, we estimate the ∆H for the banks that offer each subset of products. In particular, Table 9 estimates the market power of the banks offering classic and other financial banking products (such as brokerage and currency exchange services) relative to that of banks that only offer classic products. In Table 10, we estimate the ∆H for banks that offer classic and other nonfinancial banking products (such as insurance, life insurance, capitalization bonds and reinsurance). Finally, Table 11 estimates the ∆H for those banks that offer classic, financial and nonfinancial products relative to those that offer only classic products.
Banks that supply classic and other financial banking products versus classic
banks. Table 9 presents several estimates of equation (20), in which the dependent variable is the natural logarithm of a bank’s financial revenue. The independent variables of interest are the input prices (ln(cost of capital), ln(wage), and ln(cost of fixed), and the interaction of input prices with the dummy variable dummy banks with classic and financial banking products. The dummy variable is equal to 1 if the bank offers classic and financial products (such as brokerage and currency exchange services) and 0 otherwise. The banks supplying classic or nonfinancial products only are excluded from the regressions in the table. As in Table 8, the coefficients associated with the independent variables are used to estimate the Standard-H, ∆H and Adjusted-H. Those estimates are included at the bottom of the table.
of equation (20). In all of the specifications, we include fixed effects for each bank, quarter and year. In column (1) in Table 9, we estimate equation (20) using generalized least squares (GLS), in which we include only the input prices and their interaction with the dummy banks with classic and other financial products as the independent variables. In columns (2) to (4), we estimate the coefficients of interest, including the provision rate and profitability, bank market share and industry HHI, as independent variables.
We find that in all of the regressions, the estimated ∆H is negative, which indicates that banks that offer classic and other financial products have more market power than banks that offer only classic products. The hypothesis test with H0: ∆H ≥0 and Ha: ∆H <0 rejects
H0 at 4.6 percent for the specification in column (1) and at 3.6 percent for the specification in
columns (2) to (4). These results show that the estimated market power of banks that offer classic and other financial products is greater than the estimated market power for banks that offer only classic products. Note that the results are robust to different specifications and that the punctual estimated H is similar in all specifications.
Banks that supply classic and other nonfinancial bank products versus classic
banks. Table 10 presents several estimates of equation (20), in which the dependent variable is the natural logarithm of a bank’s financial revenue. The independent variables of interest are the input prices (ln(cost of capital),ln(wage), andln(cost of fixed), and the interaction of input prices and the dummy variabledummy banks with classic and nonfinancial bank products. The dummy variable is equal to 1 if the bank offers classic and nonfinancial products (such as life and nonlife insurance, and capitalization bonds) and 0 otherwise. The banks that supply classic or financial products only are excluded from the regressions in the table.
Table 10 reports several estimates of equation (20). In all of the specifications, we include fixed effects for each bank, quarter and year. In column (1) in Table 10, we estimate equation (1) using generalized least squares (GLS), in which we include only the input prices and their interaction with the dummy banks with classic and other nonfinancial products as the independent variables. In columns (2) to (4), we estimate the coefficients of interest, including the observable characteristics of the banks and market structure.
According to all of the estimations in Table 10, the estimated H is negative, indicating that the market power of banks that offer classic and other nonfinancial products is greater than that of banks that offer classic products only. The hypothesis test with H0: ∆H ≥ 0
for the specification in column (2), and at 6.9 percent for the specifications in columns (3) and (4). These results indicate that the banks offering classic and other nonfinancial products have greater market power than banks offering classic products only. Note that the results are robust to different specifications.
Banks that supply classic and other financial and nonfinancial banking products
versus classic banks. Table 11 presents several estimates of equation (20), in which the dependent variable is the natural logarithm of a bank’s financial revenue. The independent variables of interest are also the input prices (ln(cost of capital), ln(wage), and ln(cost of fixed) and the interaction of input prices with the dummy variable dummy banks with classic, financial and nonfinancial bank products. The dummy variable is equal to 1 if the bank offers classic, financial and nonfinancial products and 0 otherwise. The banks that supply classic or financial or nonfinancial products only are excluded from the regressions in the table.
Table 11 details several estimates of equation (20). In all of the specifications, we include fixed effects for each bank, quarter and year. As in Table 10, in column (1) in Table 11, we estimate equation (20) using generalized least squares (GLS), in which we include only the input prices and their interaction with the dummy banks with classic, financial and nonfinan-cial products as independent variables. In columns (2) to (4), we estimate the coefficients of interest, including the observable characteristics of the banks and market structure.
All estimations in Table 11 show that the estimated H is negative, which indicates that the market power of banks offering classic, financial and other nonfinancial products is greater than the market power of banks offering classic products only. The hypothesis test using H0:
∆H ≥0 and Ha: ∆H <0 rejects H0 at 6.0 percent for all estimations. These results indicate
that the banks that offer classic and other nonfinancial products have greater market power than the banks that offer classic products only. Note that the results are robust for different specifications.
5
Conclusion
In this paper, we investigated the competitive aspects of multi-product banking operations. Extending Panzar and Rosse’s (1987) test to the case of multi-product banking firms, we used a new dataset for Brazilian banking conglomerates to determine the impact of conglomeration on market power. We found that banks offering classic and other banking products have substantially greater market power than banks offering classic products only. Various tests developed by Panzar and Rosse (1987) reveal that market power is underestimated when multi-product information is not considered.
In addition, our estimates show that banks with any of the product profiles studied have greater market power than banks that offer only classic products. These results indicate that both financial and nonfinancial banking products can increase a bank’s market power.
Future research could extend this project by investigating the causal effects of the positive relationship between market power and a bank’s decision to supply classic and other banking products.
References
Allen, L. and Rai, A. (1996). Operational efficiency in banking: An international comparison. Journal of Banking and Finance. 20(4): 655-672.
Araujo, L.A. D’A.; Jorge Neto, P.M. and Ponce, D.A.S. (2005). Competição e concentração entre bancos brasileiros. Economia. 7: 561-586.
Baer, W. and Nazmi, N. (2000). Privatization and restructuring of banks in Brazil. Quarterly Review of Economics and Finance. 40: p. 3-24.
Belaish, A. (2003). Do Brazilian banks compete? International Monetary Fund. WP 03/113. Berg, S. and Kim, M. (1998). Bank as multioutput oligopolies: An empirical evaluation of the retail and corporate banking markets. Journal of Money, Credit and Banking. 30(2): 135-156.
Bikker, J.A. and Haaf, K. (2002). Competition, concentration and their relationship: An empirical analysis of the banking industry. Journal of Banking and Finance. 26: 2191-2214.
Bikker, J.; Shaffer, S. and Spierdijk, L. (2012). Assessing competition with the Panzar-Rosse Model: The role of scale, costs, and equilibrium. Review of Economics and Statistics. 94(4). pp. 1025-1044.
Bresnahan, T. F. (1982). The oligopoly solution concept is identified. Economics Letters. 10: 87-92.
Bresnahan, T.F. and Reiss, P.C. (1991). Entry and competition in concentrated markets. Journal of Political Economy. 99: 977-1009.
Cetorelli, N. (1999). Competitive analysis in banking: Appraisal of the methodologies. Economic Perspectives. Federal Reserve Bank of Chicago, First Quarter. 2-15
Claessens, S. and Laeven, L. (2004). What drives bank competition? Some international evidence. Journal of Money, Credit and Banking. 36: 563-583.
Coccorese, Paolo (2009). Market power in local banking monopolies, Journal of Banking and Finance, 33(7): 1196-1210.
Costa, Ana C.; De Mello, João Manuel P. (2006). Judicial risk and credit market perfor-mance: Micro evidence from Brazilian payroll loans. NBER Working Paper Nž 12,252. Degryse, H.; Kim, M. and Ongena, S. (2009). Microeconometrics of banking. Oxford
Uni-versity Press.
Dick, A. (2002). Demand estimation and consumer welfare in the banking industry. Finance and Economics Discussion Series Paper. Board of Governors of the Federal Reserve System.
Dierick, F. (2004). The supervision of mixed financial services groups in Europe. Occasional paper 20. European Central Bank, Frankfurt.
Freixas, X.; Lóránth, G. and Morrison, A. (2007). Regulating financial conglomerates. Jour-nal of Financial Intermediation. 16: 479-514.
Lau, L.J. (1982). On identifying the degree of competitiveness from industry price and output data. Economics Letters, 10: 93-99.
Lucinda, C. (2010). Competition in the Brazilian loan market: An empirical analysis. Estu-dos Econômicos. 40: 831-858.
Milbourn, T.; Boot, A and Thakor, A. (1999). Megamergers and expanded scope: Theories of bank size and activity diversity. Journal of Banking and Finance. 23: 195-214. Murray, J. and White, R. (1983). Economies of Scale and economies of scope in
multi-product financial institutions: A study of British Columbia Credit Unions. Journal of Finance. 38: 887-901.
Nakane, M.; Weintraub, D. B. (2005). Bank privatization and productivity: Evidence for Brazil. Journal of Banking and Finance. 29: 2259-2289.
Ness Jr.; Walter L. (2000). Reducing government bank presence in the Brazilian financial system - Why and how. Quarterly Review of Economics and Finance. 40: 71-84. Panzar, J. and Rosse, J. (1987). Testing for "Monopoly" equilibrium. The Journal of
Indus-trial Economics. XXXV(4): 443-456.
Shaffer, S. (1982). Competition, conduct and demand elasticity. Economics Letters. 10. pp. 167-171.
Shaffer, S. (1983). Non-structural measures of competition. Economics Letters. 12. pp. 349-353.
A
Appendix 1: Proofs
Proof of Proposition 1: The first-order conditions described by equations (2) and (3) define the q∗
c = qc(w1, w2, γ) and qo∗ = qo(w1, w2, γ) as implicitly functions of w1 , w2, and γ. For
convenience, we will prove Proposition 1 by showing a general expression for ∂qc ∂k and
∂qo ∂k
for any exogenous variable k = w1, w2, γ. We then conclude the proof by showing that the
expressions (6) to (8) hold.
Differentiating the first-order conditions, equations (2) and (3), with respect to k, we obtain the following expressions:
pc
qc
1−e
c
e2c
∂q
c
∂k −
∂2C(.)
∂q2c ∂qc
∂k −
∂2C(.)
∂qc∂qo
∂qo
∂k −
∂2C(.)
∂qc∂k
= 0
po
qo
1−e
o
e2o
∂q
o
∂k −
∂2C(.)
∂qc∂qo
∂qc
∂k −
∂2C(.)
∂q2o
∂qo
∂k −
∂2C(.)
∂qo∂k
= 0
As we have assumed that the banking technology has constant economies of scope, ∂∂q2Ccq(o.) =
−γ, the elasticity of demand in both markets are locally constant (∂ei
∂qi = 0,∀i), and bank’s
cost function is locally linear in every output (∂2∂qC2(.)
i = 0
,∀i), the equations above can be written as follows:
pc
qc
1−e
c
e2c
∂q
c
∂k +γ ∂qo
∂k −
∂2C(.)
∂qc∂k
= 0 (23)
po
qo
1−e
o
e2o
∂q
o
∂k +γ ∂qc
∂k −
∂2C(.)
∂qo∂k
= 0 (24)
Equations (23) and (24) define the following system of equation:
pc qc
1−ec e2
c
γ
γ po qo
1−eo e2 o ∂qc ∂k ∂qo ∂k =
∂2C(.) ∂qc∂k ∂2C(.) ∂qo∂k
.
Let
D= pcpo
qcqo
e
c −1
e2c
e
o−1
e2o
−γ2 ≥0
be the determinant of the coefficient matrix on the left. Note that it is the same expression in equation (5). Then,
D ∂qc ∂k ∂qo ∂k = po qo
1−eo e2
o
−γ
−γ pc qc
1−ec e2 c
∂2C(.) ∂qc∂k ∂2C(.) ∂qo∂k
So, we have that
∂qc
∂k =
1
D
p
o
qo
1−e
o
e2o
∂2C(.)
∂qc∂k
−γ∂
2C(.)
∂qo∂k
,
∂qo
∂k =
1
D
p
c
qc
1−e
c
e2c
∂2C(.)
∂qo∂k
−γ∂
2C(.)
∂qc∂k
.
Replacing k by w1, w2 orγ, we obtain the equations (6)-(8) in Proposition 1.
Proof of Lemma 1: We prove Lemma 1 in 3 steps. First, we to show that C(qc, qo;w1, w2),
defined in equation (14), is homogenous of degree 1 in input prices (w1, w2). That is in Lemma
2.
Lemma 2 Let C(qc, qo;w1, w2) be the cost function defined in equation (14). Then, C(.) is
homogenous of degree 1 in input prices (w1, w2), such that:
C(qc, qo;λw1, λw2) = λC(qc, qo;w1, w2), λ >0. (25)
Proof of Lemma 2:
Part-I: In this part we will show that
(x′1, x′2) = arg min
x1,x2w1x1+w2x2 s.t. (qc, qo;x1, x2)∈Y,
if, and only if,
(x′
1, x′2) = arg minx1,x2λw1x1+λw2x2 s.t. (qc, qo;x1, x2)∈Y.
Proof of Part-I: By contraction. Suppose not:
(x′1, x′2) = arg min
x1,x2w1x1+w2x2 s.t. (qc, qo;x1, x2)∈Y, (26)
but
(x′′1, x′′2) = arg min
x1,x2λw1x1+λw2x2 s.t. (qc, qo;x1, x2)∈Y, (27)
such that (x′