An analysis of the region of the Phocaea dynamical family
V. Carruba
1,2⋆
1IPD, UNIVAP, S˜ao Jos´e dos Campos, SP, 12244-000, Brazil 2Department of Mathematics, UNESP, Guaratinguet´a, SP, Brazil
Accepted 2009 June 9. Received 2009 June 9; in original form 2009 March 10
A B S T R A C T
In this work, I conduct a preliminary analysis of the Phocaea family region. I obtain families and clumps in the space of proper elements and proper frequencies, study the taxonomy of the asteroids for which this information is available, analyse the albedo and absolute magnitude distribution of objects in the area, obtain a preliminary estimate of the possible family age, study the cumulative size distribution and collision probabilities of asteroids in the region, the rotation rate distribution and obtain dynamical map of averaged elements and Lyapunov times for grids of objects in the area.
Among my results, I identified the first clump visible only in the frequency domain, the (6246) Komurotoru clump, obtained a higher limit for the possible age of the Phocaea family of 2.2 Byr, identified a class of Phocaea members on Mars-crossing orbits characterized by high Lyapunov times and showed that an apparently stable region on time-scales of 20 Myr near
theν6secular resonance is chaotic, possibly because of the overlapping of secular resonances
in the region. The Phocaea dynamical group seems to be a real S-type collisional family, formed up to 2.2 Byr ago, whose members with a large semimajor axis have been dynamically eroded by the interaction with the local web of mean-motion and secular resonances. Studying the long-term stability of orbits in the chaotic regions and the stability of family and clumps identified in this work remain challenges for future works.
Key words: celestial mechanics – minor planets, asteroids.
1 I N T R O D U C T I O N
Among highly inclined asteroids [asteroids with sin(i)>0.3, for
which the analytical theory used to obtain proper elements is not very accurate (Milani & Kneˇzevi´c (1994)], the asteroids in the region of the Phocaea family are characterized by a very interest-ing dynamics. The region of the Phocaea family is delimited by
the 7J:-2A mean-motion resonance at lowa, by the 3J:-1A
reso-nance at highaand by theν6 =g− g6 (wheregis the secular
frequency of precession of the pericentre, and the suffix 6 refers
to Saturn) secular resonance at lowi(Kneˇzevi´c & Milani 2003).
A region of shallow close encounters with Mars appears ate >
0.3, but deep close encounters with Mars are made impossible by the Kozai-class protection mechanism (Milani et al. 1989). The Phocaea family itself is characterized by its interaction with the
ν6 −ν16 secular resonance [(g−g6)−(s −s6), wheresis the
secular precession frequency of the asteroid node], and harmonics of this resonance are also present in the region. To better
under-stand the interaction of the Phocaea family with the (ν6 − ν16)
secular resonance, the family was recently obtained in the (n,g,
g−s) frequency domain by Carruba & Michtchenko (2009). Other
⋆E-mail: [email protected]
families and clumps in the region were recently identified by Foglia & Masi (2004) and Gil-Hutton (2006).
One of the open questions about the Phocaea family is if the dynamical family is real or an artefact created by the stable island region between secular and mean-motion resonances, and the zone of close encounters with Mars (Kneˇzevi´c & Milani 2003). For the purpose of answering this and other questions in this work, I first re-obtained dynamical families in the space of proper element and frequencies (Carruba & Michtchenko 2007, 2009), I studied the spectroscopical and Sloan Digital Sky Survey Moving Objects Cat-alogue, fourth release (SDSS-MOC4) data for the region, reviewed the current knowledge on geometric albedos and absolute mag-nitudes, obtained the Yarkovsky isolines, studied the cumulative distribution and collision probabilities of family members and the information on asteroid rotation rates, and the role that mean-motion and secular resonances have had in shaping the family.
I found that, with the exception of the family around (19536) (1999 JM4), formerly associated with the clump around (2860) Pasacentennium, the families and clumps found by Gil-Hutton (2006) are now substructures of the Phocaea family. I identified new clumps in a proper element and frequency space, and in particular I found the first ‘frequency-only’ clump around (6246) Komurotoru. A preliminary analysis of Yarkovsky isolines shows that the fam-ily can be up to 2.2 Byr old. Dynamical maps of the region showed
at Fundação Coordenação de Aperfeiçoamento de Pessoal de NÃ-vel Superior on July 15, 2013
http://mnras.oxfordjournals.org/
50 100 150 200 250 300 350 400 0
20 40 60 80 100 120 140
vcutoff [m/s]
Nmin
A
N
0
N
min
max(Ni)
0.2 0.4 0.6 0.8 1 0
10 20 30 40 50 60 70 80
fcutoff ["/yr]
Nmin
B
N
0
N
min
max(Ni)
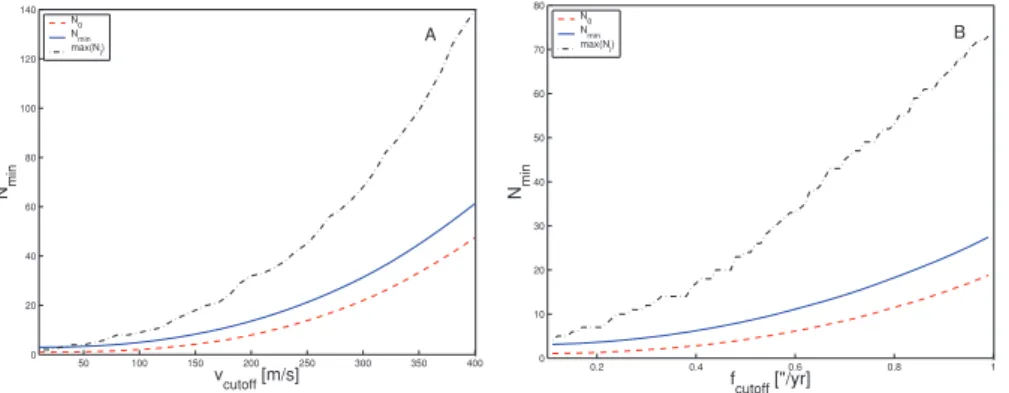
Figure 1. The average numberN0,Nminand the maximum number max (Ni) of asteroids as a function of the velocity cut-off (panel A), and of the frequency
cut-off (panel B), for the asteroids in the region of the Phocaea family.
us that there exist regions that are dynamically stable on the time-scales of the integration, but yet deprived of asteroids. Such regions, all characterized by very low values of Lyapunov times, are either associated with Mars-crossing orbits, or are near the border of the
ν6secular resonance separatrix. Understanding the long-term
sta-bility of orbits in the chaotic regions and the stasta-bility of family and clumps identified in this work will be the subject of a next paper on this subject.
2 DY N A M I C A L FA M I L I E S A N D C L U M P S I N T H E R E G I O N
I start my analysis of the Phocaea family region by re-deriving clas-sical and frequency families and clumps in the area. I identify the members of the dynamical families in the region using the classical hierarchical clustering method [CHCM; see Bendjoya & Zappal`a 2002 and references therein], and the frequency hierarchical
clus-tering method (FHCM; Carruba & Michtchenko 2007, 2009).1
In identifying asteroid families in the space of proper elements two parameters are fundamental: the cut-off distance at which the
family members are defined (d0) and the minimum number of
ob-jectsNminfor a cluster to be considered significant. Beaug´e & Roig
(2001) define a nominal distance cut-off as the average minimum distance between all the neighbouring asteroids in the same region
of the asteroid belt. The value ofNminis defined by Zappal`a et al.
(1995) as
Nmin=N0+2
N0, (1)
whereN0is the average number of orbits within a sphere of radius
d0 at every point of the proper element space. A cluster with a
number of objects larger than this critical value is called a clump, while a family is a cluster with a number of members larger than
2.5×Nmin. As we shall see in more detail in Section 8, the region
of the Phocaea family is delimited by the 7J:-2A and 3J:-1A
mean-motion resonances in properaand by theν6secular resonance at
low inclination. Currently, 1736 objects are found in the AstDyS site in this region. The nominal distance velocity cut-off as defined
in Beaug´e & Roig (2001) is of 146.9 m s−1, while Fig. 1 displays
the average numberN0,Nminand the maximum number max (Ni)
of asteroids as a function of the velocity cut-off, for asteroids in
the region. The value ofNmincorresponding atd0=146.9 m s−1
1I used synthetic proper elements and frequencies obtained numerically and
is publically available at the AstDyS site http://hamilton.dm.unipi.it/cgi-bin/astdys/astibo, accessed on 2008 December 1.
is 8. As can be seen in Fig. 1, the fact that max (Ni) is not much
larger thanNminmay be a hint that the families dominate the local
background of objects (see Section 6).
For what concerns the domain of proper frequencies, since the
Phocaea group is characterized by its interaction with the (g−s−
g6+s6) resonance, or (ν6 −ν16) (Kneˇzevi´c & Milani 2003, see
also Section 8), following the approach of Carruba & Michtchenko (2009), I determined the family with a metric of the form
f =
h1
n
h0
2
+h2(g)2+h3((g−s))2, (2)
(where h1 = h2 = h3 = 1) rather than with the ‘standard
fre-quency metric’ in the (n, g, g + s) domain of Carruba &
Michtchenko (2007). I determined the nominal frequency cut-off defined as the average minimum distance between all
neighbour-ing asteroids in the (n,g,g−s) domain, and I found a value of
f0=0.525 arcsec yr−1. Fig. 1 (panel B) displays the average
num-berN0,Nmin and the maximum number max (Ni) of asteroids as
a function of the frequency cut-off defined by equation (2). The
value ofNmincorresponding atf0 =0.525 arcsecyr−1is 26. As
observed for the values ofNminand max (Ni) obtained in the proper
element domain in the domain of frequencies, I still do not observe
a much larger value of maxNiwith respect toNmin. Again, this may
suggest that the local background of the Phocaea family is indeed dominated by the Phocaea family itself (see Section 6).
Since the Phocaea family is by far the most prominent family in the region, I started by using the CHCM for this family. Fig. 2 (panel A) displays the number of family members (left ordinate)
and the differential number dn/dv(right ordinate) as a function
of the velocity cut-off. The red vertical line displays the nominal cut-off according to Beaug´e & Roig (2001). The numbers on the top of the peaks of differential asteroid numbers are related to the
cluster of objects englobed by the Phocaea family. Fordcut−off =
110 m s−1the Phocaea family conglomerates with the (587)
Hyp-sipyle cluster, atdcut−off ≃130 the Phocaea families annexed the
former Gil-Hutton families associated with (1660) Wood and (5247)
Krylov, atdcut−off=177 m s−1the family englobes the newly found
family associated with (2860) Pasacentennium [a former clump in
Gil-Hutton (2006)] and, finally, atdcut−off=198 m s−1the Phocaea
family conglomerates with the last independent clump associated with (17628) 1996 FB5. For higher values of the cut-off, the family simply slowly expands annexing peripheral objects. This may sug-gest that the local background of the Phocaea family is dominated by the Phocaea family itself. I will come back to this subject in the following sections.
at Fundação Coordenação de Aperfeiçoamento de Pessoal de NÃ-vel Superior on July 15, 2013
http://mnras.oxfordjournals.org/
50 100 150 200 250 0 200 400 600 800 1000 1200 1400 d0 587 5247 1660 2860 176828
Velocity cutoff [m/s]
Number of family members
d0 587 5247 1660 2860 176828 A ntot dn/dv
50 100 150 200 2500
50 100 150 200 250 300 350
50 100 150 200 2500
50 100 150 200 250 300 350
0 200 400 600 800 1000 1200
120 130 140 150 160 170 180 190 200 17628 26142 19536 d0 N vcutoff [m/s] 17628 26142 19536 d0 B
0.4 0.625 0.85
0 500 1000 1500 f0 6246 19536 326 290 1192
Frequency cutoff ["/yr]
Number of family members
C
n
tot
dn/dv
0.4 0.625 0.850
200 400 600
0 200 400 600 800 1000 1200
0.5 0.55 0.6 0.65 0.7 0.75 19536 6246 f0 N fcutoff ["/s] D
Figure 2. Panel A: the number and differential number of members of the classical Phocaea family as a function of the cut-off. The numbers on the peaks of the differential number of family members are related to the clusters that were englobed by the Phocaea family at higher velocity cut-offs. Panel B: a stalactite diagram of the Phocaea family region. Panels C and D: the same as panels A and B, but for the frequency groups.
To re-identify asteroid families, I also constructed a stalactite diagram in the traditional way defined by Zappal`a et al. (1990) and Broˇz & Vokrouhlick´y (2008): I start with (25) Phocaea as the first central body and identify all the bodies associated with it at
dcut−off=200 m s−1, a value for which no other independent cluster
of asteroids was found in the Phocaea region. I then decrease the cut-off and identified the families and clumps among the asteroids not associated with (25) Phocaea. Fig. 2 (panel B) displays my results
in the interval of cut-offs between 120 and 200 m s−1. Full black
squares are associated with families in the region, and empty black squares are associated with clumps, according to the limits displayed in Fig. 1. Table 1 reports the families and clumps that I identified in this work. The first column reports if it is a family or a clump (the suffix c stands for groups identified in the proper element domain, while f stands for the groups found in the frequency space), the second column reports the lowest numbered asteroid in the group, the third reports the number of objects associated with the group, the fourth reports the number of object with spectral classification and the fifth reports the number of objects with SDSS-MOC4 data (see Section 3).
Table 1. Families and clumps in the region of the Phocaea group.
Id Name N Nspec NSDSS−MOC4
Family(c) (25) Phocaea 988 26 98
Family(f) (25) Phocaea 1137 29 102
Family(c) (19536) (1999 JM4) 27 0 3
Clump(f) (19536) (1999 JM4) 14 0 2
Clump(c) (17628) (1996 FB5) 10 0 0
Clump(c) (26142) (1994 PL1) 10 0 1
Clump(f) (6246) Komurotoru 9 0 1
To find the groups I used the following criterion. The clusters
should be observable for a cut-off equal to d0 and the ‘length
of the stalactite’ associated with the family should be at least of
20 per cent ofd0, i.e.≃30 m s−1. The last requirement was set
so as to avoid to identify as families sub-clusters of the Phocaea family that are eventually not connected to the family because of a conservative choice of the velocity cut-off. Based on the analysis
of Fig. 2 (panel A), I choose to work with a cut-off of 160 m s−1,
a value a bit larger thand0 so as to include in the Phocaea
fam-ily two small clusters [associated with (1963) Bezovec and (6487) Tonyspear]. With this choice of cut-off most of the Gil-Hutton fam-ilies [such as the two famfam-ilies of (1660) Wood and (5247) Krylov] and clumps are now substructures of the Phocaea family. A new family associated with (19536) (1999 JM4) and two clumps associ-ated with (17628) (1996 FB5) and (26142) (1994 PL1) were found in this work. The (19536) family picks the lower numbered aster-oid (2860) Pasacentennium (former clump in Gil-Hutton 2006) at
vcut−off=164 m s−1.
I then used the FHCM in the (n,g,g−s) domain to identify
mem-bers of the Phocaea dynamical family. Fig. 2 (panel C) displays the number of family members (left ordinate) and differential number
dn/df(right ordinate) as a function of the frequency cut-off. The red
vertical line displays the nominal frequency cut-off. The frequency family has only 92 members at the nominal frequency cut-off, and this fact may play against the possibility of using the nominal fre-quency cut-off for family determination in the frefre-quency domain. The numbers on the top of the peaks of differential asteroid numbers are related to the cluster of objects englobed by the
Pho-caea family at higher cut-offs. Forfcut−off =0.530 arcsec yr−1the
Phocaea family conglomerates with the (1192) Prisma cluster, at
fcut−off=0.560 arcsec yr−1it merges with the (290) Bruna family,
atfcut−off =0.595 arcsec yr−1it coalesces with the (326) Tamara
family, atfcut−off=0.625 arcsec yr−1the family englobes the clump
at Fundação Coordenação de Aperfeiçoamento de Pessoal de NÃ-vel Superior on July 15, 2013
http://mnras.oxfordjournals.org/
associated with (19536) (1999 JM4), which is a family found in the
proper element domain and, finally, atfcut−off=0.750 arcsec yr−1
the family coalesces with the last clump, associated with (6246) Ko-murotoru, which is a clump only observed in the frequency domain. As observed for the classical family, there is no sudden fusion with the local background for higher values of the cut-off.
As done for the families in the proper element domain, I also constructed a stalactite diagram in the frequency domain. I follow a procedure similar to that described for the proper element groups,
starting with a frequency cut-off offcut−off=0.750 arcsec yr−1, for
which no independent clump or family other than the Phocaea one could be identified in the region. Table 1 reports the families and clumps that were identified in the frequency domain. As observed in Fig. 2 (panel C), the value of the frequency cut-off needs to
be at least larger than 0.595 arcsec yr−1, or else the Phocaea
fam-ily would be divided in two different groups. This value seems in agreement with that found in Carruba & Michtchenko (2009) for a smaller proper frequencies set. Information given by the stalac-tite diagram (Fig. 2, panel D) shows that the (19536) group, which was also identified in the proper element domain, is also
distin-guishable forfcut−offlarger than 0.525 arcsec yr−1and smaller than
0.625 arcsec yr−1. To obtain the larger possible sample of body in
the Phocaea frequency family, I decided to work with a cut-off of
0.625 arcsec yr−1.
An interesting feature observed at larger cut-offs is the clump around (6246) Komurotoru. This clump, which only coalesces with
the Phocaea family forfcut−off =0.750 arcsec yr−1, is associated
with the (2ν6−ν16) resonance and is the first, to my knowledge,
clump of object only detected in the frequency domain.2The clumps
around (17628) and (26142), observed in the proper element do-main, were not found in the proper frequency space.
To understand how the Phocaea family interacts with other fam-ilies and clumps in the region, I also determined the local density of asteroids, following the approach of Carruba & Michtchenko (2009). Density maps will display regions characterized by strong mean-motion or secular resonances by a relatively low number of asteroids per unit bin. To quantitatively determine the local
density of asteroids, I choose a region in the range of thea, e
and sin(i) values of the local background for the Phocaea
fam-ily as determined by Carruba & Michtchenko (2009). I computed
the log10 of the number of asteroids per unit square in a 30 by
34 grid ina(starting at a = 2.20 au, with a step of 0.008 au)
ande(starting at 0.08, with a step of 0.008). Results are shown
in panel A of Fig. 3. Using similar procedures, I computed a
den-sity map of the Padua family region in the (a− sin(i)) (Fig. 3,
panel C), and (g, g − s) (Fig. 3, panel E) planes. I choose to
work with the (g − s) plane because of the influence that the
(ν6 −ν16) resonance exerts on the asteroids in the region
(Car-ruba & Michtchenko 2009). Superimposed to the density maps I show projections of the Phocaea and (19536) families (as plus signs) and of the (17628) and (26142) clumps (as triangles, see also Table 1 for information on the families and clumps) obtained in the proper element domain. Since the number density of objects in this area is relatively low, I did not use the median filter described in Carruba et al. (2004) to smooth out the effects of three-dimensional projections in 2D planes, binning, etc.
2At a cut-off of 0.625 arcsec yr−1 the clump has nine members, which
is slightly below the criterion used to identify clumps for this cut-off (11 members). Since the clump is robust at higher cut-offs, I decided to accept it at 0.625 arcsec yr−1as well.
As already discussed in Carruba & Michtchenko (2009), note how the Phocaea family is surrounded by a region with a very low density of asteroids. The Phocaea family seems essentially to fill all the available space in the ‘stable island’ region between secular and mean-motion resonances. This might either suggest that the family is an artefact of the dynamics in the region, rather than be an actual collisional family, or that it is an actual family leaking members to the local web of powerful mean-motion and secular resonances. I will come back to the subject in Section 8. Also note how in the
(g,g−s) space several members of the family are aligned inside
the (ν6−ν16) resonance atg−s=54.588 arcsec yr−1. Since the
family strongly interacts with a resonance of argument (g − s),
Carruba & Michtchenko (2009) suggested to look for families in
the region in the (n,g,g−s) domain.
For what concerns the frequency groups, in Fig. 3, I show (a,e)
(panel B), (a, sin(i)) (panel D) and (g,g−s) (panel F) projections
of the frequency family and clumps, superimposed with the density map obtained for the classical case. Note how the frequency Phocaea
family is much more extended along the (ν6−ν16) resonance than
the corresponding Phocaea classical family [see Fig. 3 (panel F), Fig. 3 (panel E) and the discussion in Carruba & Michtchenko (2009) for a quantitative estimate of the efficiency of the metric in
the (n,g,g−s) domain in obtaining members of families interacting
with such resonances].
Also, note how the Komurotoru clump is essentially aligned with
a strip at≃63 arcsec yr−1 in the (g
− s) variable. In Section 8,
I will show how this region is associated with the (2ν6 − ν16)
secular resonance. In the following sections, I will further analyse the families obtained in the proper element and frequency domain in terms of compositional analysis.
3 T H E C O M P O S I T I O N A L A N A LY S I S
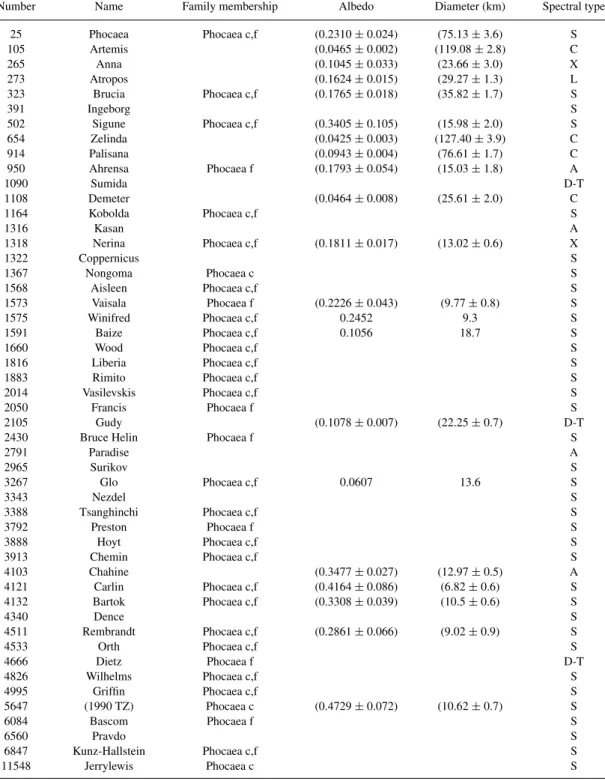
As a preliminary step in the analysis of the Phocaea family, I re-viewed the current knowledge about the taxonomical classification of members of the frequency Padua family. Using the data present in the three major photometric/spectroscopic surveys Eight-Colour Asteroid Analysis (ECAA; Zellner, Tholen & Tedesco 1985; Tholen 1989), Small Main Belt Spectroscopic Survey (SMASS; Xu et al. 1995; Bus & Binzel 2002a,b) and Small Solar System Objects Spec-troscopic Survey (S3OS2; Lazzaro et al. 2004), I identified in the Phocaea family background (defined as in Carruba & Michtchenko 2009) four A-type, one L-type, 36 S-type, two X-type, four C-type and three D-T-C-type objects. Of these, 26 were members of the Phocaea classical family and seven were members of the Phocaea frequency family (but not of the classical one; vice versa there were four objects that were members of the classical family but not of the frequency one). Table 2 reports the asteroid identification, fam-ily status (c stands for the classical famfam-ily, and f for the frequency one), geometric albedo, diameter and spectral class for the aster-oids for which at least some of this information is available. Data on the albedo and asteroid diameters for which an error estimate was available was taken from Tedesco et al. (2002) (see also Section 3). Data on the albedo for which an error estimate is not available were from the Horizon web site (http://ssd.jpl.nasa.gov).
Carvano et al. (2001) analysed 31 objects in the Phocaea re-gion (as well as 29 asteroids in the Hungaria group) and con-cluded that, despite the presence of a large C-type object in the family, (105) Artemis, the fact that the majority of asteroids was tightly concentrated in the region of the Phocaea family suggested that the family could be a real product of a collisional outbreak.
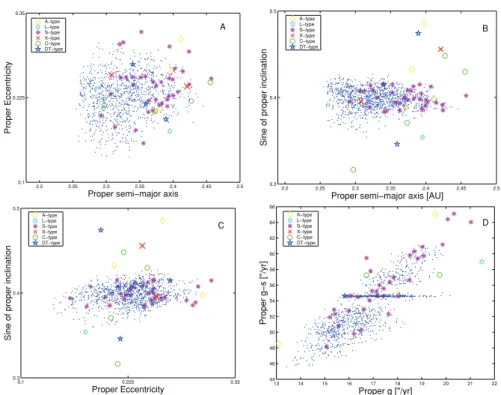
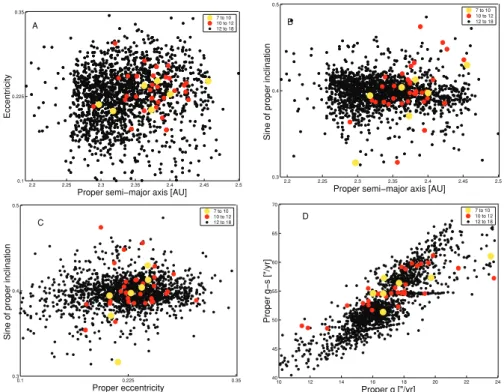
Fig. 4 displays an (a,e) (panel A), (a, sin(i)), (panel B), (e, sin(i))
at Fundação Coordenação de Aperfeiçoamento de Pessoal de NÃ-vel Superior on July 15, 2013
http://mnras.oxfordjournals.org/
Figure 3. An (a−e) (panel A), (a−sin(i)) (panel C) and (g,g−s) (panel E) projections of the families and clumps (see Table 1) in the region of the Phocaea family, obtained in the proper element domain. Panels B, D and F display the same, but for the groups obtained in the (n,g,g−s) frequency domain.
(panel C) and (g,g−s) (panel D) projections of the asteroids with
a known spectroscopical classification, along with the members of the Phocaea frequency family (blue dots).
As can be seen in Fig. 4, and from the data of Table 2, all C-type asteroids in the region are not members of the Phocaea families, including (105) Artemis. Most of the S-type objects in the region were members of the Phocaea families, with six exception. There were only three members of the family with types other than S: (950) Ahrens (A-type, not incompatible with the mineralogy of an S-type family), (1318) Nerina (X-type) and (4666) Dietz (D-T type). The ratio of 9.1 per cent of objects with a spectral type different than the dominant one seems to be compatible with the expected ratio of interlopers for a family of the size of Phocaea (Migliorini et al. 1995, but the sample of objects with a known spectral type is still too small to reach a definitive conclusion).
For the purpose of extending the sample for which information on taxonomy is available, I turn my attention to the SDSS-MOC4 data. The SDSS MOC4 lists astrometric and photometric data for aster-oids observed by the 2.5-m Sloan telescope located at Apache Point Observatory, in Sunspot, New Mexico. To date (fourth release), the survey has determined positions, brightness, and five-colour CCD photometry of 471 569 moving objects (Parker et al. 2008).
The flux reflected by the detected objects was measured almost si-multaneously in five bands (measurements in two successive bands were separated in time by 72 s) with effective wavelengths 3557 Å
(uband), 4825 Å (gband), 6261 Å (rband), 7672 Å (iband) and
9097 Å (zband), and with 0.1–0.3µm band-widths (Fukugita et al.
1996). Here I follow the approach of Roig & Gil-Hutton (2006) to
obtain principal components in the space of albedosFu,Fg,Fi,Fz.
Using the criteria introduced by Roig & Gil-Hutton (2006) to re-ject data with large errors, I obtain a data set of 18 178 obre-jects with principal components data, 17 258 of which are related to numbered objects.
Once the two first principal components are found, the data can be used to classify asteroids according to their taxonomic types and to determine asteroid families in the space of proper elements and colours simultaneously. Bus & Binzel (2002a,b) and Nesvorn´y et al. (2005) introduced the following extended metrics in this space:
d3=
d2
+CPC[(δPC1)2+(δPC2)2], (3)
wheredis the distance given by the standard metric of Zappal`a
et al. (1995), and PC1and PC2are the two first principal
compo-nents. Carruba & Michtchenko (2007, equation 3) also introduced
metrics of colours and frequencies in the (n,g,g+s, PC1, PC2)
at Fundação Coordenação de Aperfeiçoamento de Pessoal de NÃ-vel Superior on July 15, 2013
http://mnras.oxfordjournals.org/
Table 2. Asteroids in the Phocaea region with known spectral classification.
Number Name Family membership Albedo Diameter (km) Spectral type
25 Phocaea Phocaea c,f (0.2310±0.024) (75.13±3.6) S
105 Artemis (0.0465±0.002) (119.08±2.8) C
265 Anna (0.1045±0.033) (23.66±3.0) X
273 Atropos (0.1624±0.015) (29.27±1.3) L
323 Brucia Phocaea c,f (0.1765±0.018) (35.82±1.7) S
391 Ingeborg S
502 Sigune Phocaea c,f (0.3405±0.105) (15.98±2.0) S
654 Zelinda (0.0425±0.003) (127.40±3.9) C
914 Palisana (0.0943±0.004) (76.61±1.7) C
950 Ahrensa Phocaea f (0.1793±0.054) (15.03±1.8) A
1090 Sumida D-T
1108 Demeter (0.0464±0.008) (25.61±2.0) C
1164 Kobolda Phocaea c,f S
1316 Kasan A
1318 Nerina Phocaea c,f (0.1811±0.017) (13.02±0.6) X
1322 Coppernicus S
1367 Nongoma Phocaea c S
1568 Aisleen Phocaea c,f S
1573 Vaisala Phocaea f (0.2226±0.043) (9.77±0.8) S
1575 Winifred Phocaea c,f 0.2452 9.3 S
1591 Baize Phocaea c,f 0.1056 18.7 S
1660 Wood Phocaea c,f S
1816 Liberia Phocaea c,f S
1883 Rimito Phocaea c,f S
2014 Vasilevskis Phocaea c,f S
2050 Francis Phocaea f S
2105 Gudy (0.1078±0.007) (22.25±0.7) D-T
2430 Bruce Helin Phocaea f S
2791 Paradise A
2965 Surikov S
3267 Glo Phocaea c,f 0.0607 13.6 S
3343 Nezdel S
3388 Tsanghinchi Phocaea c,f S
3792 Preston Phocaea f S
3888 Hoyt Phocaea c,f S
3913 Chemin Phocaea c,f S
4103 Chahine (0.3477±0.027) (12.97±0.5) A
4121 Carlin Phocaea c,f (0.4164±0.086) (6.82±0.6) S
4132 Bartok Phocaea c,f (0.3308±0.039) (10.5±0.6) S
4340 Dence S
4511 Rembrandt Phocaea c,f (0.2861±0.066) (9.02±0.9) S
4533 Orth Phocaea c,f S
4666 Dietz Phocaea f D-T
4826 Wilhelms Phocaea c,f S
4995 Griffin Phocaea c,f S
5647 (1990 TZ) Phocaea c (0.4729±0.072) (10.62±0.7) S
6084 Bascom Phocaea f S
6560 Pravdo S
6847 Kunz-Hallstein Phocaea c,f S
11548 Jerrylewis Phocaea c S
domain. Since in this work, I am interested in studying the
interac-tion of asteroids with a resonance of argument (g−s), it is more
appropriate to use a metric in the (n,g,g−s, PC1, PC2) domain of
the form
d4=
f2+D
PC[(PC1)2+(PC2)2], (4)
wheref is the distance metric in the frequency domain given by
equation (2), andDPCis a numerical factor, empirically set equal to
200 to give comparable results for the typical differences in proper frequencies and those in principal components.
Following the approach of Carruba & Michtchenko (2007), I se-lected an S-type asteroid in the Phocaea classical and frequency families also present in the 17 258 data base of numbered asteroids
for which data on PC1and PC2are available: (4132) Bartok. A
sim-ilar procedure was carried out for the families and clumps obtained in the proper element domain for which at least one member had
principal component data. I found that for a cut-off of 380 m s−1
the (19 536) family coalesces with the Phocaea family, and
there-fore I decided to work with a cut-off of 375 m s−1. At this cut-off I
found that the Phocaea family has 112 members, the (19 536) fam-ily has 11 members and the (26 142) clump has one member [no
at Fundação Coordenação de Aperfeiçoamento de Pessoal de NÃ-vel Superior on July 15, 2013
http://mnras.oxfordjournals.org/
2.2 2.25 2.3 2.35 2.4 2.45 2.5 0.1
0.225 0.35
Proper semi−major axis
Proper Eccentricity
A
A−type L−type S−type X−type C−type DT−type
2.2 2.25 2.3 2.35 2.4 2.45 2.5
0.3 0.4 0.5
Proper semi−major axis [AU]
Sine of proper inclination
B
A−type L−type S−type X−type C−type DT−type
0.1 0.225 0.35
0.3 0.4 0.5
Proper Eccentricity
Sine of proper inclination
C
A−type L−type S−type X−type C−type DT−type
13 14 15 16 17 18 19 20 21 22
44 46 48 50 52 54 56 58 60 62 64 66
Proper g ["/yr]
Proper g−s ["/yr]
D
A−type L−type S−type X−type C−type DT−type
Figure 4.Taxonomic distribution of asteroids in the region of the Phocaea family.
2.25 2.3 2.35 2.4 2.45 2.5
0.34 0.36 0.38 0.4 0.42 0.44 0.46
Proper semi−major axis [AU]
Sine of proper inclination
A
Phocaea 19536
26142 17628
2.25 2.3 2.35 2.4 2.45 2.5
0.34 0.36 0.38 0.4 0.42 0.44 0.46
Proper semi−major axis [AU]
Sine of proper inclination
B
Phocaea 19536
6246
Figure 5. Panel A: an (a, sin(i)) projection of the members of the Phocaea, (blue crosses), (19 536) (magenta circles) and (26 142) (green triangle) dynamical groups found in the space of proper element and principal components. Black dots display the location of asteroids in the SDSS-MOC4 data base in the region. Panel B: the same for members of the Phocaea (blue crosses), (19 536) (magenta circles) and (6246) (green triangles) found in the space of proper frequencies (n,g,g−s) and principal components.
member with principal component data was found for the (17 628) clump].
Fig. 5 (panel A) displays a projection of the members of the Phocaea, (blue crosses), (19 536) (magenta circles) and (26 142) (green triangle) dynamical groups found in the space of proper element and principal components. Black dots display the location of asteroids in the SDSS-MOC4 data base in the region. As can be seen in the figure, the orbital distribution of the Phocaea family members found in the domain of proper elements and principal components follows quite closely the distribution of the family members in the space of proper elements (see Fig. 3, panel C).
I then obtained families and clumps in the domain of proper frequencies and principal components using equation (4). For a
cut-off of 2.3 arcsec yr−1 the (6246) Kunamoto cluster merges
with the Phocaea family, so I decided to work with a cut-off of
2.2 arcsec yr−1. At this cut-off, the Phocaea family has 115
mem-bers, the (19 536) clumps have seven members and the (6246) clump has 12 members.
Fig. 5 (panel B) displays a projection of the members of the Phocaea, (blue crosses), (19 536) (magenta circles) and (6246) (green triangle) dynamical groups found in the space of proper frequencies and principal components. As can be seen in the fig-ure, the orbital distribution of the Phocaea family members follows closely that of the family found in the space of proper frequencies (see Fig. 3, panel D). The 19 536 clump found in the domain of proper frequencies and principal components is, however, extended
at higher sin(i) values with respect to the clump obtained in the
space of proper frequencies only. The (6246) Kunamoto clump is extended at smaller values of the semimajor axis with respect to the one found in the space of proper frequencies only, and merges with the Phocaea family for slightly larger values of the frequency cut-off. In the next section, I will investigate the values of albedo and
at Fundação Coordenação de Aperfeiçoamento de Pessoal de NÃ-vel Superior on July 15, 2013
http://mnras.oxfordjournals.org/
absolute magnitudes for asteroids in the region that are available in the literature.
4 G E O M E T R I C A L B E D O S A N D A B S O L U T E M AG N I T U D E S
The cumulative size distribution of asteroid family members can be used to obtain important information about the collisional and or-bital evolution of asteroid families (Vokrouhlick´y et al. 2006a,b,c). Estimates of the asteroid diameters can be obtained via the relation-ship
D= √D0 pV ×
10−0.2H
, (5)
whereD0 = 1329 km,H is the asteroid absolute magnitude and
pV is the geometric albedo. To obtain reliable estimates of the
di-ameters of asteroids, it is therefore important to first obtain good values of the asteroids geometric albedos and absolute magnitudes. For what concerns the asteroids albedos, I turn my attention to the work of Tedesco et al. (2002), which reported the values of geo-metric albedo (with their uncertainties) for 2226 bodies. Of these, I found 33 objects in the region of the local background of the Phocaea frequency family (Carruba & Michtchenko 2009), for which synthetic proper elements were also available. 11 of these objects belong to either the Phocaea classical or frequency families and have a reported spectral classification.
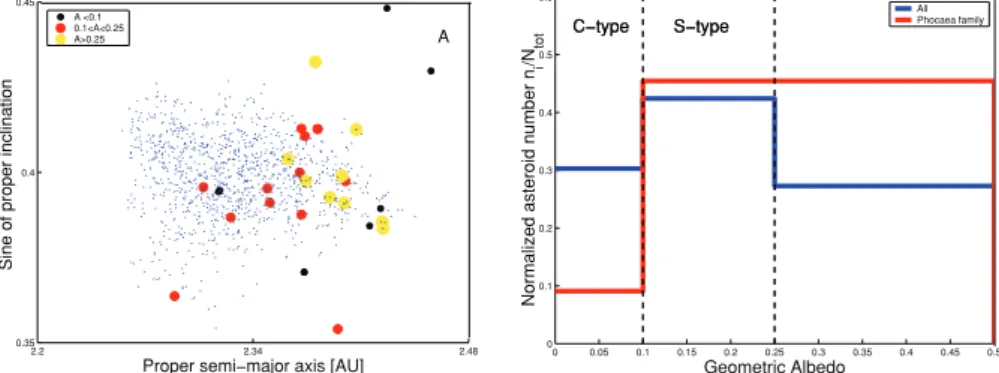
Fig. 6 (panel A) displays an (a, sin(i)) projection of the Phocaea
frequency family (small blue dots) and of the 33 objects with albe-dos in the region. Asteroids with albealbe-dos lower than 0.10 (usually associated with C-type bodies) are displayed with small black dots, those with albedos between 0.10 and 0.25 (associated with S-type objects, Bus & Binzel 2002a,b) are shown with larger red dots, and asteroids with albedos larger than 0.25 are displayed with large full yellow dots. As can be seen in the figure, most of the objects with low albedos are found outside the family, and there is a concentra-tion of the objects with an S-type compatible albedo in the region of the Phocaea family, so confirming the possible interpretation of the family as being the product of the disruption of a large S-type parent body. I however also observe some high-albedo objects that are associated with the family. This is more evident in Fig. 6 (panel B) where I show a histogram of the normalized number of objects in the albedo intervals 0.00–0.10 (C-type), 0.10–0.25 (S-type) and larger than 0.25, for all asteroids in the region (blue line) and just for the Phocaea families members (red line). While only a member of the Phocaea family has low albedo, there were five
objects, all with diameters of 10 km or less, with albedo larger than the value usually associated with S-type bodies.
Taking the median value of the Phocaea member albedo, and using the standard deviation as a measure of its error, I found that
the albedo values of the Phocaea members lie in the intervalpV=
(0.24±0.12). For what concerns the asteroids absolute magnitudes,
Fig. 7 displays (a− e) (panel A), (a − sin(i)) (panel B), (e−
sin(i)) (panel C) and (g,g−s) projections of the asteroids in the
region of the Phocaea family. Small black dots display the locations
of asteroids withH >12, red full dots are associated with asteroids
with 10< H <12 and large yellow dots display the position of all
objects with magnitude smaller than 10.
As can be seen in the figure, the distribution of bodies is not symmetrical about the semimajor axis, with respect to the centre of the family. There is an excess of objects at the lower semimajor
axis with respect to the distribution at highera. Three large C-type
objects, (105) Artemis, (654) Zelinda and (914) Palisana are present in the region but are not connected to the Phocaea dynamical family, as discussed in the previous sections. The family of (25) Phocaea
itself sits on the separatrix of the (ν6 − ν16) secular resonance.
Medium-sized bodies are generally associated with the family. More information on the size distribution of the Phocaea family will be discussed in Section 6.
5 YA R K OV S K Y I S O L I N E S A N D C- TA R G E T F U N C T I O N
Now that I have already revised the information on the literature on geometric albedos and absolute magnitude, I am equipped to start setting constraint on an age estimate for the Phocaea family. In
Vokrouhlick´y et al. (2006a,b) the authors used the (a,H) distribution
of asteroid families to determine their ages. In particular, the authors
introduced a target functionCdefined as
0.2H =log10(a/C), (6)
wherea=a−ac, andacis the ‘central’ value of the semimajor
axis of the family members. The most appropriate definition of family centre relates to the concept of barycentre. I took
ac=
nast
i=1
a×Mi
Mtot
, (7)
wherenastis the number of family members andMi is the mass
of each asteroid, estimated by assuming that all asteroids can be
approximated as spheres, using a density of 2500 kg m−3, typical
of S-type objects, and a diameter obtained using equation (5). For
2.2 2.34 2.48
0.35 0.4 0.45
Proper semi−major axis [AU]
Sine of proper inclination
A
A <0.1 0.1<A<0.25 A>0.25
0 0.05 0.1 0.15 0.2 0.25 0.3 0.35 0.4 0.45 0.5
0 0.1 0.2 0.3 0.4 0.5 0.6
C−type S−type
Geometric Albedo
Normalized asteroid number n
i
/Ntot
C−type S−type
All Phocaea family
Figure 6.Panel A: an (a, sin(i)) projection of the orbital location of asteroids for which a value of the geometric albedo is available in the region of the Phocaea family. Panel B: histogram of the normalized number of objects per unit bins in the albedo intervals 0.00-0.10 (C-type), 0.10–0.25 (S-type) and larger than 0.25, for all asteroids in the region (blue line) and just for the Phocaea families members (red line).
at Fundação Coordenação de Aperfeiçoamento de Pessoal de NÃ-vel Superior on July 15, 2013
http://mnras.oxfordjournals.org/
2.2 2.25 2.3 2.35 2.4 2.45 2.5 0.1
0.225 0.35
Proper semi−major axis [AU]
Eccentricity
A
7 to 10 10 to 12 12 to 18
2.2 2.25 2.3 2.35 2.4 2.45 2.5
0.3 0.4 0.5
Proper semi−major axis [AU]
Sine of proper inclination
B B
7 to 10 10 to 12 12 to 18
0.1 0.225 0.35
0.3 0.4 0.5
Proper eccentricity
Sine of proper inclination
C
7 to 10 10 to 12 12 to 18
10 12 14 16 18 20 22 24
40 45 50 55 60 65 70
Proper g ["/yr]
Proper g−s ["/yr]
D 7 to 1010 to 12
12 to 18
Figure 7. An (a−e) (panel A), (a−sin(i)) (panel B), (e−sin(i)) (panel C), and (g,g−s) projections of the asteroids in the region of the Phocaea family. Small black dots display the locations of asteroids withH>12, red full dots are associated with asteroids with 10< H <12 and large yellow dots display the position of all objects with magnitude smaller than 10.
asteroids for which the geometric albedo is not available, I used
the average value of albedo for the Phocaea family,pV = 0.24.
Equations similar to equation (7) hold forecandic. With these
ap-proximations, I found that the total massMtotof the classical family
is of the order of 2.35×10¹⁸ Kg, 34.7 per cent of which is
con-tained in (25) Phocaea. The total mass of the frequency family is
of the order of 2.88×10¹⁸Kg, 28.3 per cent of which is contained
in (25) Phocaea. The barycentre of the classical family is located
atac=2.3851 au,ec= 0.2373 andic = 23◦.8433, while that of
the frequency family is located at ac = 2.3497 au,ec = 0.2151
and ic = 23◦.3117.3 For what concerns theacvalue obtained for
the frequency family, I notice that the frequency family is seriously
depleted beyond higher values ofa with respect to the M1:-2A
resonance with Mars. As a consequence, the value of the family
barycentre is displaced at lowerawith respect to that of the
clas-sical family. For this reason, I choose to work essentially with the barycentre of the classical family.
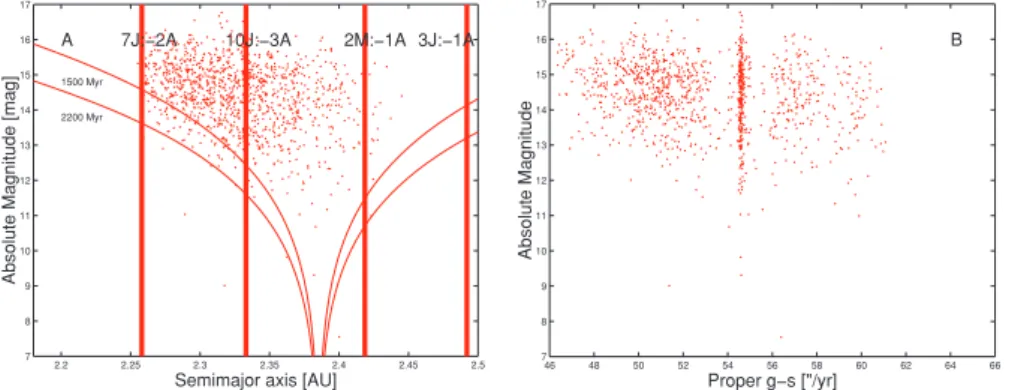
As part of my preliminary analysis of the Phocaea family I show
(a,H) and (g−s,H) projections of the members of the frequency
Phocaea family. Results are similar for the classical family. For what
concerns the (a,H) projections, I also show the distance covered
by the asteroids to diffuse from the centre of the family via the Yarkovsky effect, computed using the Vokrouhlick´y (1998) model of the diurnal version of the Yarkovsky effect, for spherical bod-ies and in the linear approximation for the heat conduction in a spherical, solid and rotating body illuminated by solar radiation. I used the following parameters to describe the Yarkovsky force: a
value of thermal conductivityK=0.0001 W m−1K−1, a specific
3The mean values of the family semimajor axis, eccentricity and inclination
areac=2.3348 au,ec=0.2328 andic=23◦.5143 for the classical family,
andac=2.3284 au,ec=0.2280 andic=23.◦4883, for the frequency one.
heat capacity ofCp =680 J kg−1K−1, a density of 2500 g cm−3,
a surface density of 1500 g cm−3, a bond albedo of 0.11 and a
geometric albedo of 0.24 (see Section 4 for a discussion on the geometric albedo data). With these parameters, using the
barycen-tric value of the familyadistributionac, and assuming a rotation
period inversely proportional to the radius (Farinella, Vokrouhlick´y & Hartmann 1998), I obtained lines of maximal Yarkovsky drift for the Phocaea frequency (Fig. 8, panels A) members, for ages of 1500 and 2200 Myr. Since I am not considering the effect of the primordial ejection velocity field, this sets upper limits on the pos-sible age of the family. My preliminary analysis seems to confirm the possibility that the Phocaea family is indeed a very old one. Also notice how both classical and frequency families (and more so for the frequency family) are depleted in members for values of the semimajor axis larger than the family barycentre. This is most likely caused by the local dynamics, and in particular by the direct and
indirect effect of the strongν6secular resonance. More information
on the local dynamics can be found in Section 8.
Another interesting piece of information can be obtained by
ob-serving the (g−s,H) projection of the frequency family (Fig. 8).
Note that the central strip of the family members is locked in the
(ν6 −ν16) secular resonance. Contrary to the case of the Padua
family (Carruba 2009), however, only 112 members of the classi-cal family (11.33 per cent of the total members) and 120 of the frequency family (10.55 per cent of the family total) are locked in this resonance (more than 75 per cent of the Padua family members
were locked in thez1 resonance). The fact that the majority of the
members of the family are not in the resonant configuration is re-flected by the fact that the family is characteristically dispersed in
‘triangle diagrams’. The role of the (ν6−ν16) secular resonance is
therefore more limited for the case of the Phocaea family than the
one played by thez1resonance for the Padua family. Finally, the lack
of objects in the frequency family with values of (g−s) higher than
at Fundação Coordenação de Aperfeiçoamento de Pessoal de NÃ-vel Superior on July 15, 2013
http://mnras.oxfordjournals.org/
2.2 2.25 2.3 2.35 2.4 2.45 2.5 7
8 9 10 11 12 13 14 15 16 17
A 1 − : J 3 A
2 − : J
7 10J:−3A 2M:−1A
Semimajor axis [AU]
Absolute Magnitude [mag]
A
1500 Myr
2200 Myr
46 48 50 52 54 56 58 60 62 64 66 7
8 9 10 11 12 13 14 15 16 17
Proper g−s ["/yr]
Absolute Magnitude
B
Figure 8. An (a,H) (panel A) and (g+s,H) (panel B) projection of the members of the frequency Phocaea family.
61.5 arcsec yr−1 is caused by the barrier in the frequency domain
presented by the M1:-2A resonance with Mars (see Section 8). The asymmetry between the population of objects at lower and
higherais also observed if we compute the C-target function.4
Positive values ofCare significantly depleted and I do not observe
a peak atC >0. I believe this asymmetry can be explained in terms
of the local dynamics, as discussed above. More information on secular and mean-motion resonances in the region will be given in Section 8.
6 C U M U L AT I V E D I S T R I B U T I O N A N D C O L L I S I O N P R O B A B I L I T I E S
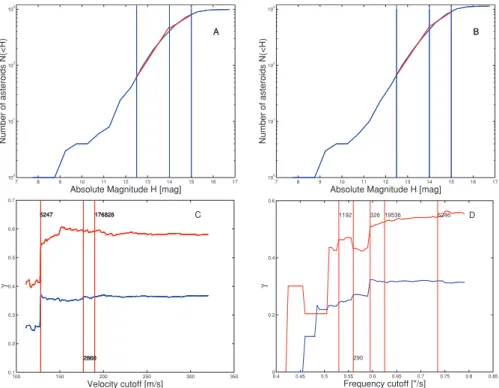
The size distribution of asteroids is one of the most significant observational constraints on their history, and it is also one of the hardest quantities to determine because of strong selection effects (Parker et al. 2008). As a next step of my preliminary analysis
of the Phocaea family, I compute the cumulative Hdistribution
N(<H) for the two Phocaea families, the classical (Fig. 9, panel A) and the frequency one (Fig. 9, panel B). As it is the case for several other families studied by Parker et al. (2008), the Phocaea family cumulative distribution seems to be best approximated by
a ‘broken’ power law, for the two intervals inHbetween 12 and
14 and between 14 and 15. I found that for the classical family,
theγ exponents that best fit the two intervals are 0.60 and 0.35,
respectively, while for the frequency family I obtained values ofγ
of 0.53 and 0.32. Theγ exponents found for the first interval are
compatible with the 0.61γvalue for background population found
by Parker et al. (2008) for the inner main belt, but the values found for the second intervals seem quite low and may indicate that there was a significant depletion in the population of smaller objects in the area.
In Fig. 9 (panels C and D), I show the dependence of the
expo-nent of the cumulativeHdistributionN(<H) as a function of the
velocity and of the frequency cut-offs, found in the range of the
ab-solute magnitude ofH(12.5, 14.0) (red lines) and (14.0, 15.0) (blue
lines). Vertical lines display the values of the cut-offs for which the Phocaea family englobes other families and clumps in the region (see Fig. 2, panels A and C). As can be seen in the figure, the cumulative exponents fluctuate when the Phocaea cluster englobes some of the minor group in the region and then practically reach a constant value for larger cut-offs. The fact that the exponents do
4I computed the observed dataN
obs(C) for the classical and frequency
families, obtained by (C,C+C) binning withC=4.0×10⁻⁶and
ac=2.3851 au (the barycentre of the classical family).
not drop at very large cut-off, i.e. when the whole background zone becomes associated with the family (Vokrouhlick´y et al. 2006b), is caused by the fact that I obtained the Phocaea (and the other groups in the region) using a sample with only the asteroids in the Phocaea family local background (Carruba & Michtchenko 2009). Apparently the local background of the Phocaea family is actually dominated by Phocaea family members (plus the odd large C- and X-type asteroids; see Section 3). As soon as the Phocaea family reaches the dynamical limits of the stable island, it essentially stops to grow significantly, and so the cumulative exponents essentially stop varying.
One question that may arise at this point regards the possibility that the Phocaea family was created by a collision and it is there-fore an actual family, rather than a dynamical group limited by the ‘stable island’ region. To start investigating the possible role that asteroids in different regions may have had in the collisional evolution of the Phocaea family, I used the approach of Greenberg (1982) for obtaining intrinsic collision probabilities of members of the Phocaea classical family with (25) Phocaea itself, an asteroid in the inner main belt, (8) Flora and an asteroid in the middle belt, (15) Eunomia.
Values of collision probabilities are actually in general higher for the interaction of asteroids with (8) Flora than with (25) Phocaea
itself. The average value ofPfor collisions with (8) Flora was of
8.2×10⁻¹⁸km−2yr−1, while that with (25) Phocaea was of 10.9
×
10−18km−2yr−1. For comparison, the average value ofPwith (15)
Eunomia was of 4.8×10⁻¹⁸km−2yr−1, while the average
probabil-ity of two main belt asteroid to collide is of 2.8×10⁻¹⁸km−2yr−1.
This simple test may indicate that collision with inner main belt, low-inclination objects may have certainly played a role in the col-lisional history of the Phocaea family, but a further, more in-depth, study is needed to clarify this point.
As an order of magnitude estimate for the age of the Phocaea family, let us assume a value of the collision probability of the
impact of a ≃ 10 km size projectile of Pi ≃ 10−17km−2yr−1.
The disruption of a parent body of 120–150 km would have a characteristic time-scale of
τ≃ 1
(Pi(Rt+Rp)2)Np)
, (8)
whereNp is the number of projectiles in the main belt (between
5000 and 10 000 according to Bottke et al. 2005),Rtis the target
radius (of the order of 60 km) andRpis the projectile radius (of
the order of 5 km). Assuming an optimistic value for the number of projectiles in the main belt, this supports a 2.4 Byr estimate for the collisional age of the Phocaea family, in agreement with the estimates obtained in Section 5.
at Fundação Coordenação de Aperfeiçoamento de Pessoal de NÃ-vel Superior on July 15, 2013
http://mnras.oxfordjournals.org/
7 8 9 10 11 12 13 14 15 16 17 100
101
102
103
Absolute Magnitude H [mag]
Number of asteroids N(<H)
A A
7 8 9 10 11 12 13 14 15 16 17 100
101
102
103
Absolute Magnitude H [mag]
Number of asteroids N(<H)
B B
100 150 200 250 300 350 0.1
0.2 0.3 0.4 0.5 0.6 0.7
Velocity cutoff [m/s]
γ
5247
2860 176828 5247
2860
176828 C
5247
2860 176828
0.4 0.45 0.5 0.55 0.6 0.65 0.7 0.75 0.8 0.85 0
0.2 0.4 0.6
Frequency cutoff ["/s]
γ
D
6246 19536 326
290 1192
Figure 9. Panels A and B display the cumulative distributionN(>H) of the classical and frequency members of the Phocaea family. Panels C and D display the dependence of the exponent of the cumulativeHdistributionN(<H) as a function of the velocity and of the frequency cut-offs, found in the range of absolute magnitudeH(12.5, 14.0) (red lines) and (14.0, 15.0) (blue lines).
7 L I G H T C U RV E A N D R OTAT I O N R AT E A N A LY S I S
It has been recently proposed that binary asteroids can be formed because of the increase in the rotation rate of the parent body caused by the Yarkovsky-O’Keefe-Radzievskii-Paddack (YORP) effect (Pravec et al. 2008). Obtaining information on the asteroid periods is therefore of significant importance in understanding their dynamical evolution. Here I revised the current information avail-able for members of the Phocaea classical and frequency families in the Asteroid Light-Curve Data Base (LCDB; Warner, Harris & Pravec 2008) as of 2009 March. There are a total of 1213 asteroids between the Phocaea classical and frequency family. Of these, 18 had a period estimate in the LCDB.
Fig. 10 displays a histogram of the distribution of rotation fre-quencies for the 18 asteroids for which such information is available.
0 1 2 3 4 5 6 7 8 9 10
0 1 2 3 4 5 6 7 8
Frequency [1/d]
Count
Figure 10. Histograms of rotation frequencies (ind−1for the 18 Phocaea
families members present in the Asteroid Light-Curve Data Base.
The sample is too limited to allow to obtain statistically significant information, but it can be noticed that there are two objects, (2000) Herschel and (4283) Stoffler, with periods longer than 50 h, and eight objects with periods longer than 1 d. As found by Warner et al. (2009) for asteroids in the Hungaria region, there seems to be an excess of slow rotators, while the distribution of spin rates
in the range of 1d−1< f <7d−1appears to be uniform. This can
be possibly caused by the YORP effect, with the excess of slow rotators related to the longer time slowly rotating objects spend in that state (Pravec et al. 2008).
8 DY N A M I C S I N T H E R E G I O N O F T H E P H O C A E A FA M I LY
As discussed in Kneˇzevi´c & Milani (2003), the Phocaea family is characterized by a region of shallow close encounters with Mars at
e >0.3, which displays significant chaotic behaviour. To further study and delimit this region it is useful to compute maximum Lyapunov exponents (MLE) for orbits in this area. A detailed ex-planation of the theory of Lyapunov exponents goes beyond the scope of this paper; instead, I refer the reader to Lyapunov (1907) and Benettin et al. (1980). The MLE is a measure of exponential stretching of nearby orbits. The Lyapunov exponents are equal to zero for regular orbits (they tend to zero in finite-time calculations), while they assume positive values for chaotic orbits. The inverse of
a Lyapunov exponent is the Lyapunov timeTL. Smaller values of
TLindicate enhanced local stochasticity.
I start my analysis by looking at the values of MLEs currently available in the AstDyS data base in the Phocaea family region.
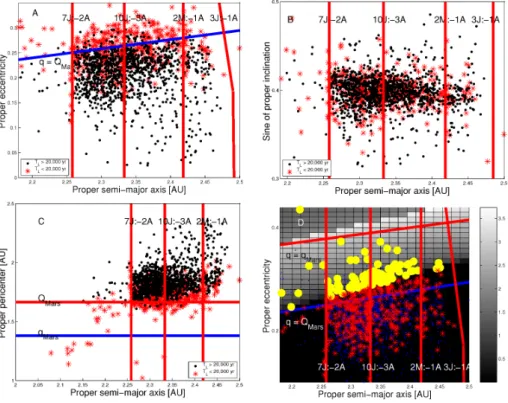
Fig. 11 displays an (a−e) (panel A), (a−sin(i)) (panel B), (a,q)
[panel C, whereq=a(1−e) is the asteroid pericentre] projections
of asteroid Lyapunov times in the region of the Phocaea family. Small black dots have Lyapunov times smaller than 20 000 yr, large
at Fundação Coordenação de Aperfeiçoamento de Pessoal de NÃ-vel Superior on July 15, 2013
http://mnras.oxfordjournals.org/
Figure 11.An (a,q) (panel A), (a, sin(i)) (panel B), (a,q) (panel C) projection of asteroids Lyapunov times in the region of the Phocaea family. Small black dots have Lyapunov times smaller than 20 000 yr, large red asterisks haveTL<20 000 yr. Panel D displays an (a,e) projection of asteroids in the region of
the Phocaea family (blue dots), superimposed with a colour plot of [(a2T)1/2]×103caused by encounters with Mars. Full red dots are asteroids with
Lyapunov timesTLsmaller than 20 000 yr, and full yellow dots are asteroids withTL<20 000 yr and (a2T)1/2>0.
red asterisks haveTL<20 000 yr. Panel C of Fig. 11 displays the
MLE versus the asteroid pericentre. Vertical lines show the values
ofqequal to Mars pericentre (blue line) and apocentre (red line).
As can be seen in Fig. 11 (panel A), orbits with small Lyapunov times are generally (but not only) characterized by larger values
of eccentricity, roughly speakinge >0.22. The blue line in the
figure displays the location of asteroids with the pericentre equal to the apocentre of Mars, which have the potential to be Mars crossers. With the exception of asteroids interacting with the 7J:-2A, the 2M:-1A or other mean-motion and secular resonances, most of the asteroids with low Lyapunov times are either Mars crossers or are objects that can be perturbed by encounters with Mars. This is more clearly shown in Fig. 11 (panel C), where I see that the lowest values of Lyapunov times are associated with Mars-crosser bodies. Note how there is no particular correlation between Lyapunov times and inclination (Fig. 11, panel B). This is also observed in the space of asteroid proper frequencies.
To further study the effect of close encounters with Mars on chaos in the Phocaea region, I turn my attention to the work of Greenberg (1982) on orbital interaction during close encounters. In his work, Greenberg assumed that the gravitational interaction between two closely approaching orbiting bodies can be modelled as a two-body hyperbolic encounter. As in Carruba et al. (2003), I used this
ap-proach to compute (a2T)1/2 (where
ais the change in the
semimajor axis andT is the orbital period of the perturbee, of the
order of 3.72 yr) for a grid of particles in the (1.9–2.5) au range ina, (0–0.43) range ineand with the inclination equal to that of
(25) Phocaea at J2000 (23◦.414). I also computed the same quantity
for all the 1736 objects in the local background of the Phocaea
family. Fig. 11 (panel D) displays an (a, e) projection of
aster-oids in the region of the Phocaea family (blue dots), superimposed
with a colour plot of [(a2
T)1/2]
×103 caused by
encoun-ters with Mars. Red asterisks are asteroids with Lyapunov timesTL
smaller than 20 000 yr, and full yellow dots are asteroids withTL<
20 000 yr and [(a2
T)1/2]>0.
As can be seen in the figure, we are now able to distinguish between the chaotic behaviour caused by close encounters with Mars (yellow full dots) and that caused by the overlapping of res-onances or other criteria (red asterisks). A question that naturally arises is about the long-term stability of the chaotic objects that are Mars crossing. Are all these objects protected by deep close encounters with Mars by the Kozai mechanism proposed by Milani et al. (1989), or are some of these objects relatively young bodies only recently inserted in unstable regions? Answering this question involves long-term dynamical simulations, which are beyond the purpose of this paper. But this issue remains an interesting topic for future work.
The next logical step was obtaining estimates of Lyapunov times for regions where no current or few asteroids are found. This is especially important for example for the regions that were found to be stable in Section 8, but show a small density of asteroids. One may wonder if the small asteroid density may be caused by a long-term dynamical effect, or if it is primordial. One useful tool to obtain information on the long-term stability of orbits may be obtaining MLEs.
To estimate MLEs for orbits in the region, I used a modified
version ofSWIFT-LYAP2.F, a code that integrates the difference
equa-tion (Mikkola & Innanen 1999; Morbidelli 2002) in theSWIFT
pack-age (Levison & Duncan 1994). For each of the test particles, I integrated the difference equation with an initial difference
vec-tor of modulusd(0) = √6×10⁻⁹, and determined the modulus
d(t) of the displacement vector between the two vectors at timet.
at Fundação Coordenação de Aperfeiçoamento de Pessoal de NÃ-vel Superior on July 15, 2013
http://mnras.oxfordjournals.org/
Figure 12. Lyapunov times projected in the space of averaged (a,e) (panel A), (a, sin(i)) (panel B) and (e, sin(i)) (panel C) elements. Panel D displays the Lyapunov times of real asteroids in the local background in the (g,g−s) space of proper frequencies. Yellow circles display Lyapunov times smaller than 20 000 yr, while black dots are associated with times larger than 20 000 yr.
I constructed a series (t, ln[d(t)/d(0)]), and performed a linear
least-square fit on this series. Sinced(t)≃d(0) exp(Lt), whereL
is the Lyapunov exponent, the slope of ln[d(t)/d(0)] versus time is
equal to the maximum Lyapunov exponent. More information on the procedure used to obtain MLEs can be found in Carruba et al. (2004).
Fig. 12 displays a projection in the space of averaged elements of the Lyapunov times obtained for a 20 Myr numerical simulation.
I used 5300 particles in the (a,e) plane, 9060 particles in the (a,
sin(i)) plane, and 13 590 test particles in the (e, sin(i)) plane near
the Phocaea family. I also used a step inaof 0.005 au, ineof 0.004
and iniof 0.◦1, and took particles in an equally spaced grid of 60
by 90 particles in the (a,e) plane, of 60 by 151 particles in the (a,
sin(i)) plane and of 90 by 151 particles in the (e, sin(i)) plane.5
The initial values of sin(i),e,a(for the simulations in the (a,e)),
(a, sin(i))- and (e, sin(i)) planes, respectively), and initial angular
elements,ωandλof the test particles were fixed at those of (25)
Phocaea at J2000.
In order to study the orbital evolution of asteroids in the re-gion of the Phocaea families, I also performed an integration with the SWIFT-MVS integrator of Levison & Duncan (1994), mod-ified by Mira Broˇz to include the second-order symplectic map from Laskar & Robutel (2001) (the code is publically available at http://sirrah.troja.mff.cuni.cz/mira/mp/) and the same test parti-cles used for obtaining MLEs. All planets from Venus to Neptune were included in the simulation. Mercury was accounted for as a barycentric correction of the initial conditions. Non-singular or-bital elements were Fourier filtered on line to eliminate all periods
5My test particles covered a range between 2.2 and 2.5 au ina, 0 and 0.36
ineand 15◦and 30◦ini, respectively.
Table 3.Argument and semimajor axis location of the main three-body resonances in the region of the Phocaea group. Three-body resonance Semimajor axisa(au)
9J:-5S:-2A 2.25838
3J:1S:-1A 2.30189
8J:-3S:-2A 2.30229
5J:-4S:-1A 2.30270
9J:-6S:-2A 2.34884
2J:3S:-1A 2.39647
4J:-2S:-1A 2.39736
6J:-7S:-1A 2.39825
7J:-2S:-2A 2.44847
9J:-7S:-2A 2.44893
smaller than 600 yr, and averaged elements were obtained over the whole length of the integration.
The main two-body mean-motion resonances in the region (7J:-2A, 10J:-3A, 2M:-1A, 3J:-1A) are displayed in Fig. 12 (panels A and B). The limits of the 3J:-1A resonance in Fig. 12 (panel A) are defined according to equation (3) in Morbidelli & Vokrouhlick´y (2003). Table 3 reports the resonant argument and approximate location in the semimajor axis of the main three-body resonances, as identified by Michtchenko et al. (2009) (for simplicity, they are not shown in Fig. 12). The thick blue lines in Fig. 12 (panels A, B and C) display the location of the centre in the average element space of the main secular resonances in the region.
Yellow circles display Lyapunov times smaller than 20 000 yr, while black dots are associated with times larger than 20 000 yr. The green line in Fig. 12 (panel A) displays the location of orbits
withq = QMars. As can be seen in Fig. 12 (panel A), most of
the chaos is confined to the region of close encounters with Mars.
at Fundação Coordenação de Aperfeiçoamento de Pessoal de NÃ-vel Superior on July 15, 2013
http://mnras.oxfordjournals.org/