46
Sparse Representation Fusion of Fingerprint, Iris and Palmprint
Biometric Features
S.Anu H Nair
1, P.Aruna
2, K.Sakthivel
3Abstract
Multimodal Biometric System using multiple sources of information for establishing the identity has been widely recognized. But the computational models for multimodal biometrics recognition have only recently received attention. In this paper multimodal biometric image such as fingerprint, palmprint, and iris are extracted individually and are fused together using a sparse fusion mechanism. A multimodal sparse representation method is proposed, which interprets the test data by a sparse linear combination of training data, while constraining the observations from different modalities of the test subject to share their sparse representations. The images are pre-processed for feature extraction. In this process Sobel, canny, Prewitt edge detection methods were applied. The image quality was measured using PSNR, NAE, and NCC metrics. Based on the results obtained, Sobel edge detection was used for feature extraction. Extracted features were subjected to sparse representation for the fusion of different modalities. The fused template can be used for watermarking and person identification application. CASIA database is chosen for the biometric images.
Keywords
Multimodal biometrics, feature fusion, sparse representation.
1.
Introduction
Biometric refers to the automatic recognition of individuals based on their physiological and behavioral characteristics. Physiological biometrics (fingerprint, iris, retina, hand geometry, face, etc) use measurements from the human body. Behavioral biometrics (signature, keystrokes, voice, etc) [2] use
Manuscript received January 09, 2014.
S.Anu H Nair, Assistant Professor, Department. of CSE,
Annamalai University, Chidambaram, India.
P.Aruna Professor, Department. of CSE, Annamalai
University, Chidambaram, India.
K.Sakthivel PG Student, Department of CSE, Annamalai University, Chidambaram, India.
47 address the problem of noisy data (illness affecting
voice, scar affecting fingerprint.
Classification in multimodal-biometric systems is done by fusing information from different biometric modalities. Information fusion can be done at different levels, broadly divided into feature-level, score-level [2] and rank/decision-level fusion. Due to preservation of raw information, feature-level fusion can be more discriminative than score or decision-level fusion. But, feature-decision-level fusion methods are being explored in the biometric community only recently. This is because of the differences in features extracted from different sensors in terms of type and dimensions. Often features have large dimensions, and fusion becomes difficult at the feature level. The prevalent method is feature concatenation, which has been used for different multi-biometric settings. However, for high dimensional feature vectors, simple feature concatenation may be inefficient and non-robust. In recent years, a theory of Sparse Representation (SR) has emerged as powerful tools for efficient processing of data in non-traditional ways [1]. The proposed methodology uses sparse representation for the fusion of extracted biometric features [3].
2.
Literature Review
In 2013, Meng Ding et al [1] proposed the fusion method based on compressive sensing theory which contains over complete dictionary, an algorithm for sparse vector approximation and fusion rule. In 2012, J.Aravinth et al [2] describes the feature extraction techniques for three modalities viz. fingerprint, iris and face. The extracted information is stored as a template which can be fused using density based score level fusion. In 2010, Gaurav Bhatnagar et al [6] presented a new watermark embedding technique based on Discrete Wavelet transform (DWT) for hiding little but important information in images. In 2011, Aly I. Desoky et al [7] proposed an iris recognition algorithm in which a set of iris images of a given eyes are fused to generate a final template using the most consistent feature data. In 2013, Wei Jia et al [8] proposed a new descriptor of palmprint named histogram of oriented lines (HOL), which is a variant of histogram of oriented gradients (HOG). In 2011, Shu Kong et al [9] proposed to fuse the multiple features into a more preferable presentation, which is more compact and more discriminative for better FR performance. In 2013, Sumit Shekhar et al [3] proposed a multimodal sparse representation method, which represents the test data by a sparse
linear combination of training data, while constraining the observations from different modalities of the test subject to share their sparse representations. In 2010, Li Xufang et al [12] proposed that the source images were represented with sparse coefficients using an overcomplete dictionary. In 2012, Mehmet Belgin [5] evaluates the applicability of PBR by testing it on a large set of matrices from the sparse matrix collection. In 2013, Arun Ross et al [4] address the problem of information fusion in biometric verification systems by combining information at the matching score level. In 2011, Punam Bedi et al [11] presented a robust multimodal biometric image watermarking scheme using Particle Swarm Optimization (PSO). In 2013, Yongsheng Chen et.al [10] proposed to fuse sparse coefficients of images using the details and activity levels of each sliding window. In 2012, Sunil Kumar Panjeta et.al [13] analysed different fusion techniques for different images of the same scene to improve quality of the image. In 2011, Parul Shah et.al [14] presented a novel fusion rule which fuses multifocus images in the wavelet domain by taking a weighted average of the pixels. In 2012, Maheswari et.al [15] used hamming distance based matching algorithm for comparing the templates. In 2012, Gayathri et.al [16] extracted Gabor Texture from preprocessed palmprint and iris images.
3.
Proposed Work
The proposed work describes the fusion of multimodal biometric images such as, palmprint, iris
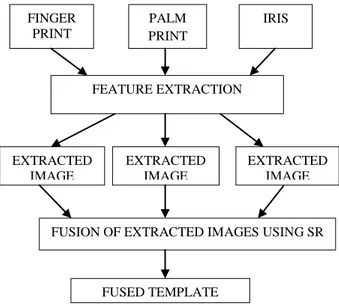
Fig 1. Flow diagram of proposed work.
FINGER PRINT
PALM PRINT
IRIS
FEATURE EXTRACTION
EXTRACTED IMAGE
EXTRACTED IMAGE
EXTRACTED IMAGE
FUSION OF EXTRACTED IMAGES USING SR
48 and fingerprint. Initially the features are extracted
individually from the biometric images. Then the resultant modalities are fused together into a simple template. Figure 1 explains the flow diagram of the proposed work.
4.
Biometric Feature Extraction
Some of the limitations of unimodal biometric systems can be addressed by deploying multimodal biometric systems that essentially integrate the evidence presented by multiple sources of information such as iris, fingerprint and palm print. Such systems are less vulnerable to spoof attacks as it would be difficult for an imposter to simultaneously spoof multiple biometric traits of a genuine user [7]. Due to sufficient population coverage, these systems are able to address the problem of non-universality.
4.1 Fingerprint Extraction
Figure 2 represents the flow diagram of fingerprint feature extraction. In the first step fingerprint image is fed as the input. The image is subjected to Adaptive histogram equalization technique. This is used to enhance the contrast of the grayscale image by transforming the values using contrast-limited adaptive histogram equalization (CLAHE). Histogram equalization defines a mapping of gray levels into gray levels such that the distribution of gray level is uniform. Since contrast is expanded for most of the image pixels, the transformation improves the detect ability of many image features. The enhanced image is passed to orientation process to find the direction of edges in the fingerprint image [2]. This can be achieved by using the SOBEL filter to detect the edges of the image. For an image edge, the direction can be defined in terms of the gradient, pointing in the direction of maximum image intensity increase (from dark to bright). This implies that two edges can have the same orientation but the corresponding image gradients point in opposite directions if the edges go in different directions. ROI selection is used to give maximum magnitude of convolution in the region of core point. This fingerprint masking is used to select the region where the fingerprint images are present. This Region of Interest (ROI) is done by masking. Once this is done, the feature of the fingerprint image is successfully extracted. The input image size is 256*255 and the output image size is 512*512.
4.2 Palmprint Extraction
Figure 3 represents the flow diagram of palmprint
Fig 2. Flow diagram of fingerprint feature extraction.
feature extraction. The palmprint image is fed as input image. Adaptive histogram equalization technique is applied to enhance the contrast of the grayscale image [8]. Then a diffusion filter algorithm is used to remove noise from an image by modifying the image via a partial differential equation (PDE). Modifying the image according to this isotropic diffusion equation is equivalent to filtering the image with a Gaussian filter. Edge detection is performed using sobel filter to identifying the ridges. Thinning algorithms reduce connected patterns to a width of a single pixel while maintaining their topology. The thinning is performed using Morphological operation. Once this is done, the feature of the palmprint is successfully extracted. The input image size is 257*226 and the output image size is 512*512.
Fig 3. Flow diagram of palmprint feature extraction.
Input Fingerprint Image
Adaptive Histogram Equalization to increase the contrast of the image
Orientation Process to identify the direction of the edges using sobel
ROI Selection using fingerprint mask
Extracted fingerprint feature
Adaptive Histogram Equalization to increase the contrast of the image
Input Palmprint Image
Diffusion Filtering Algorithm reduce noise
Edge detection using sobel for identifying ridges
Thinning
49 Figure 3 represents the flow diagram of palmprint
feature extraction. The palmprint image is fed as input image. Adaptive histogram equalization technique is applied to enhance the contrast of the grayscale image [8]. Then a diffusion filter algorithm is used to remove noise from an image by modifying the image via a partial differential equation (PDE). Modifying the image according to this isotropic diffusion equation is equivalent to filtering the image with a Gaussian filter. Edge detection is performed using sobel filter to identifying the ridges. Thinning algorithms reduce connected patterns to a width of a single pixel while maintaining their topology. The thinning is performed using Morphological operation. Once this is done, the feature of the palmprint is successfully extracted. The input image size is 257*226 and the output image size is 512*512.
4.3 Iris Extraction
Figure 4 represents the flow diagram of iris feature extraction the iris image is given as the input. Morphological operation is performed on the input image to erode or dilate pixels [7]. The Fourier transform is applied to the image to filter the image based on frequency. Then edge detection process using sobel filter is performed. The Hough Transform is applied to the filtered image to find the straight lines (functions) hidden in larger amounts of other data. For detecting lines in images, the image is first binarised using some form of thresholding and then the positive instances catalogued [2]. Adaptive histogram technique is applied finally to enhance the contrast of the image.
Fig 4. Flow diagram of iris feature extraction.
Once this is done, the feature of the iris is successfully extracted. The input image size is 320*280 and the output image size is 512*512.
5.
Sparse Representation Fusion
Mechanism
The extracted features are fed as the input of the sparse fusion methodology. The input features were converted into matrix format to perform sparse representation [3]. Circular shift process is used to shifts the values in the array circularly by shift size elements. Shift size is a vector of integer scalars where the n-th element specifies the shift amount for the nth dimension of array.
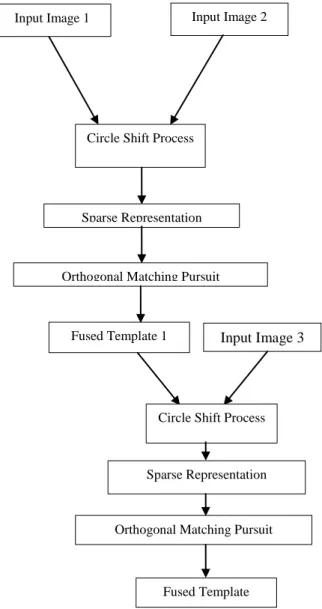
Fig 5. Flow diagram of fusion mechanism Fusion Algorithm
Input Iris Image
Morphological Operation to perform erode or dilate pixels
Hough Transform to detect the hidden straight lines
Adaptive Histogram Equalization to increase the contrast of the image
Extracted iris feature Edge detection using sobel
for identifying ridges
Input Image 3
Input Image 1 Input Image 2
Circle Shift Process
Sparse Representation
Orthogonal Matching Pursuit
Fused Template 1
Circle Shift Process
Sparse Representation
Orthogonal Matching Pursuit
50 If an element in shift size is positive, the values are
shifted down (or to the right). If it is negative, the values are shifted up (or to the left). If it is 0, the values in that dimension are not shifted. The sparse function generates matrices in the MATLAB sparse storage organization. A Sparse Matrix is a matrix that mostly contains zeros. In MATLAB, sparse matrices contrast regular ones in the way they are stored, such that memory is used more efficiently for matrices that are sparse. It converts a full matrix to sparse form by squeezing out any zero elements. If the matrix is already sparse it returns the matrix. Orthogonal Matching Pursuit is used to construct the values obtained into an image [1]. It is similar to Matching Pursuit, except that an atom once picked, cannot be picked again. The algorithm maintains an active set of atoms already picked, and adds new atoms at each iteration. In such a way sparse fusion is performed to the first two modalities to form fused template 1 and further it is performed to the obtained fused template 1 and the 3rd modality to form the ultimate fused template.
1. The images are fed as input.
2. The values of input image 1 and input image 2 are convolved.
3. The resultant matrix is converted into sparse representation by squeezing out the zero elements.
4. The sparse representation is further transformed into an image using orthogonal matching pursuit.
5. The fused template and the input image 3 are fed as input.
6. The values of the fused template and the input image 3 are convolved.
7. The resultant matrix is converted into sparse representation by squeezing out the zero elements.
8. The sparse representation is further transformed into an image using orthogonal matching pursuit.
9. Finally a fused template of the three inputs is obtained as output.
6.
Experimental Results
6.1 Quality Metrics
Several quality metrics are used for analyzing the quality of images. Here Peak Signal Noise Ratio, Normalized Absolute Error and Normalized Cross Correlation metrics are used.
6.1.1 Peak Signal-To-Noise Ratio (Psnr)
The PSNR block computes the peak signal-to-noise ratio, in decibels, between two images. This ratio is often used as a quality measurement between the original and a compressed image. The higher the PSNR, the better the quality of the compressed or reconstructed image.
The Mean Square Error (MSE) and the Peak Signal
to Noise Ratio (PSNR) are the two error metrics used
to compare image compression quality. The MSE represents the cumulative squared error between the compressed and the original image, whereas PSNR represents a measure of the peak error. The lower the value of MSE, the lower the error.
To compute the PSNR, the block first calculates the mean-squared error using the following equation:
N
M
n
m
I
n
m
I
MSE
MN*
)]
,
(
)
,
(
[
, 2 2 1
(1)In the previous equation, M and N are the number of rows and columns in the input images, respectively. Then the block computes the PSNR using the following equation:
MSE
R
PSNR
2 10log
10
(2)In the previous equation, R is the maximum fluctuation in the input image data type. For example, if the input image has a double-precision floating-point data type, then R is 1. If it has an 8-bit unsigned integer data type, R is 255.
6.1.2 Normalized Absolute Error
Normalized absolute error is the total absolute error normalized by the error simply predicting the average of the actual values. The large value of Normalized Absolute Error (NAE) means that image is poor quality. NAE is defined as follow:
M j M k M j M k jk k j k jx
x
x
NAE
1 11 1 ,
' , ,
(3)
6.1.3 Normalized Cross Correlation
51 (correlated) pixel within a certain disparity range that
minimizes the associated error and maximizes the similarity.
In brief, the matching process involves computation of the similarity measure for each disparity value, followed by an aggregation and optimization step. Since these steps consume a lot of processing power, there are significant speed-performance advantages to be had in optimizing the matching algorithm.
Mi N
j m
i n
j ij ij ij
A
B
A
NCC
1 1
1 1
2
)
(
(4)
(i) Performance measure for Fingerprint edge detection methods
Table 1. Image quality measure for Fingerprint edge detection methods
METRICS CANNY SOBEL PREWITT
PSNR 51.624 51.644 51.599
NAE 5.234 5.035 5.709
NCC 0.510 0.521 0.492
51 51.02 51.04 51.06 51.08 51.1 51.12
CANNY SOBEL PREWITT
PSNR
Fig 6. Shows the comparison of PSNR values for different edge detection process in fingerprint
images.
0 1 2 3 4 5 6 7
CANNY SOBEL PREWITT
NAE
Fig 7. Shows the comparison of NAE values for different edge detection process in fingerprint
images.
0.44 0.45 0.46 0.47 0.48 0.49 0.5 0.51
CANNY SOBEL PREWITT
NCC
Fig 8. Shows the comparison of NCC values for different edge detection process in fingerprint
images.
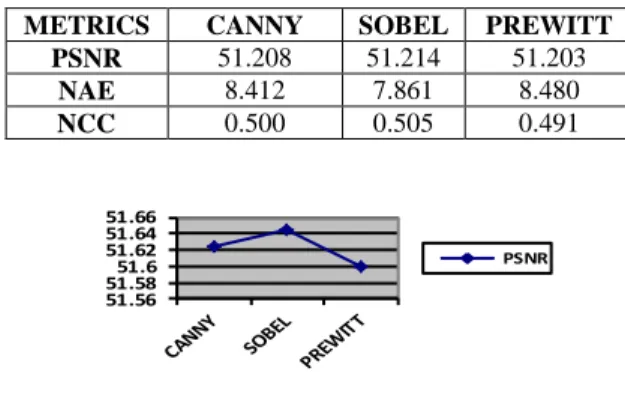
(ii) Performance measure for Palmprint edge detection methods
Table 2. Image quality measure for Palmprint edge detection methods
METRICS CANNY SOBEL PREWITT
PSNR 51.208 51.214 51.203
NAE 8.412 7.861 8.480
NCC 0.500 0.505 0.491
51.195 51.2 51.205 51.21 51.215
CANNY SOBEL PREWITT
PSNR
Fig 9. Shows the comparison of PSNR values for different edge detection process in palmprint
images.
7.4 7.6 7.8 8 8.2 8.4 8.6
CANNY SOBEL PREWITT
NAE
Fig 10. Shows the comparison of NAE values for different edge detection process in palmprint
52 Fig 11. Shows the comparison of NCC values for
different edge detection process in palmprint images.
(ii) Performance measure for Iris edge detection methods
Table 3. Image quality measure for Iris edge detection methods.
METRICS CANNY SOBEL PREWITT
PSNR 51.208 51.214 51.203
NAE 8.412 7.861 8.480
NCC 0.500 0.505 0.491
51.56 51.58 51.6 51.62 51.64 51.66
PSNR
Fig 12. Shows the comparison of PSNR values for different edge detection process in iris images.
Fig 13. Shows the comparison of NAE values for different edge detection process in iris images.
Fig 14. Shows the comparison of NCC values for different edge detection process in iris images.
6.2 Sample Outputs of Sparse Representation Fusion
Fig 15. (a-o) shows the set of input images and (p-t) shows the set of output images
Here the edge detection methods canny, sobel, prewitt are used and compared. The PSNR, NCC values for sobel edge detection method in fingerprint, iris, palmprint images are higher compared to canny and prewitt edge detection methods. The NAE values for sobel edge detection method in fingerprint, iris, palmprint are lower compared to canny, prewitt edge detection methods. Therefore sobel edge detection method proves the best. The above tables and figures show the performance results of edge detection method for fingerprint, iris, and palmprint.
7.
Conclusion
53
References
[1] Meng Ding, Li Wei, Bangfeng Wang,“Research on fusion method for infrared and visible images
via compressive sensing”, Elsevier, 2013.
[2] Mr.J.Aravinth1, Dr.S.Valarmathy2, “A Novel Feature Extraction Techniques for Multimodal Score Fusion Using Density Based Gaussian
Mixture Model Approach”, IJETAE, Jan 2012.
[3] Sumit Shekhar, Student Member, IEEE, Vishal M. Patel, Member, IEEE, Nasser M. Nasrabadi,
Fellow, IEEE, “Joint Sparse Representation for Robust Multimodal Biometrics Recognition”,
IEEE, 2013.
[4] Arun Ross, Anil Jain , “Information fusion in
biometrics”, Elsevier, 2013.
[5] Mehmet Belgin1, Godmar Back, Calvin J.
Ribbens, “Applicability of Pattern-based Sparse
Matrix Representation for Real Applications”,
Elsevier, 2012.
[6] Gaurav Bhatnagar, Q.M. Jonathan Wu,
Balasubramanian Raman, “Biometric Template Security based on Watermarking”, Elsevier,
2010.
[7] Aly I. Desoky, Hesham A. Ali, Nahla B.
Abdel-Hamid, “Enhancing iris recognition system
performance using templates fusion”, Ain Shams
Engineering Journal, 2011.
[8] Wei Jia, Member, IEEE, Rong-Xiang Hu, Ying-Ke Lei, Yang Zhao, and Jie Gui, “Histogram of
Oriented Lines for Palmprint Recognition”,
IEEE, 2013.
[9] Shu Kong, Xikui Wang, Donghui Wang, Fei Wu,
“Multiple Feature Fusion for Face Recognition”, 10th IEEE International Conference and Workshops on Automatic Face and Gesture Recognition.2013.
[10]Yongsheng Chen, Gang Xiao, “Fusion of Infrared and Visible Images Based on Distributed
Compressive Sensing”, World Academic
Publishing, 2013.
[11]Punam Bedi, Roli Bansal, Priti Sehgal,
“Multimodal Biometric Authentication using PSO based Watermarking”,Procedia Technology,
Elsevier, 2012.
[12]Li Xufang, Hu Min, “A Novel DWT based
Multi-focus image fusion method”, Procedia
Technology, Elsevier, 2011.
[13]Sunil Kumar Panjeta and Deepak Sharma,“A Survey on Image fusion Techniques used to Improve Image Quality,”, International Journal of Applied Engineering Research, ISSN 0973-4562 Vol.7 No.11 2012.
[14]Parul Shah, Shabbir N. Merchant, Uday B. Desai
“An Efficient Adaptive Fusion Scheme for
Multifocus Images in Wavelet Domain Using Statistical Properties of Neighborhood,” 14th International Conference on Information Fusion Chicago, Illinois, USA, July 5-8, 2011.
[15]Maheswari M A.P, Ancy S and Eben Praisy
Devanesam.K,, “Biometric identification system
for features fusion of iris and fingerprint,”,
Recent Research in Science and Technology 2012, 4(6): 01-04.
[16]R.Gayathri, P.Ramamoorthy,” Feature Level Fusion of Palmprint and Iris,” IJCSI International Journal of Computer Science Issues, Vol. 9, Issue 4, No 1, July 2012.
Ms. S. Anu H Nair is an Assistant
Professor in the Department of Computer Science and Engineering of Annamalai University. Received her Bachelor degree in 2002 and Master Degree at Manonmaniam Sundaranar University in 2005. Her main research areas include image processing, pattern classification techniques and neural networks. She has published papers on these topics.
Dr. P. Aruna received her B.E. from
Madras University, M.Tech from IIT Delhi and the Ph.D degree from Annamalai University. Presently she is working as a Professor in the Department of Computer Science and Engineering of Annamalai University. She has published twenty research papers in International journals and five research papers in national journals. She has published fifteen research papers in International conferences and twenty two research papers in national conferences. She has twenty two years of teaching experience and thirteen years of research experience. Her area of specialization includes Neural networks & Fuzzy systems, Data Mining and Image processing.
Mr. K. Sakthivel received his B.E.
degree from Bharathiyar College of Engineering and Technology, Karaikal. He is pursuing his M.E. degree in Annamalai University. His area of interests are Image Processing, Computer Networks.
Author’s Photo
Author’s Photo