Working
Paper
408
Lighting and violent crimes: evaluating the effect of
an electrification policy in rural Brazil on violent
crime reduction
Paulo Arvate
Filipe Ortiz Falsete
Felipe Garcia Ribeiro
André Portela
CMICRO - Nº3
3
WORKING PAPER 408–CMICRO Nº 33•JANEIRO DE 2016• 1
Os artigos dos Textos para Discussão da Escola de Economia de São Paulo da Fundação Getulio Vargas são de inteira responsabilidade dos autores e não refletem necessariamente a opinião da
FGV-EESP. É permitida a reprodução total ou parcial dos artigos, desde que creditada a fonte.
Lighting and violent crimes: evaluating the effect of an electrification policy
in rural Brazil on violent crime reduction
Paulo Arvate
São Paulo School of Business Administration and Center for Applied Microeconomic Studies Getulio Vargas Foundation
Filipe Ortiz Falsete Sao Paulo School of Economics Getulio Vargas Foundation [email protected]
Felipe Garcia Ribeiro Deparment of Economics
Federal University of Pelotas and
Center for Applied Microeconomic Studies Getulio Vargas Foundation
André Portela Souza
Sao Paulo School of Economics and Center for Applied Microeconomic Studies Getulio Vargas Foundation
Abstract
This paper estimates the effect of lighting on violent crime reduction. We explore an electrification program (LUZ PARA TODOS or Light for All - LPT) adopted by the federal government to expand electrification to rural areas in all Brazilian municipalities in the 2000s as an exogenous source of variation in electrification expansion. Our instrumental variable results show a reduction in homicide rates (approximately five homicides per 100,000 inhabitants) on rural roads/urban streets when a municipality moved from no access to full coverage of electricity between 2000 and 2010. These findings are even more significant in the northern and northeastern regions of Brazil, where rates of electrification are lower than those of the rest of the country and, thus, where the program is concentrated. In the north (northeast), the number of violent deaths on the streets per 100,000 inhabitants decreased by 48.12 (13.43). This moved a municipality at the 99th percentile (75th) to the median (zero) of the crime distribution of municipalities. Finally, we do not find effects on violent deaths in households and at other locations. Because we use an IV strategy by exploring the LPT program eligibility criteria, we can interpret the results as the estimated impact of the program on those experiencing an increase in electricity coverage due to their program eligibility. Thus, the results represent local average treatment effects of lighting on homicides.
Keywords: Violent crime (Homicide); Lighting; Hospital homicide data; Brazil
INTRODUCTION
The criminology literature reveals that improved street lighting is quite effective against some kinds of crime, such as robbery, assault, burglary, and vandalism (Welsh and Farrington 2008). Most of the evidence is from urban areas (i.e., cities, downtown areas, residential and commercial neighborhoods, etc.) in developed countries (the United States and England), and police report data are typically used.
In principle, lighting can have positive or negative effects on crime. On the one hand, the increased visibility as a result of electrification improves criminals’ identification of objects of interest. Additionally, individuals purchase more items that are targeted by criminals as electrification boosts the demand for such items (Pease, 1999). On the other hand, electrification improves the security technology used by the police and individuals (new weapons, cameras and surveillance technologies, alarms, etc.). Additionally, increased visibility makes it easier to identify a criminal offense and the offender. According to an analysis of the costs and benefits of a crime, this easier identification eventually increases the cost of criminal activity (Becker 1968; Stigler 1970). The findings of the empirical literature on urban areas in developed countries suggest that crime deterrence might predominate over other factors.
This paper contributes to this literature by investigating the effects of lighting on violent crimes in a completely different context, that is, the rural areas of a developing country - Brazil. We take advantage of the introduction of a comprehensive and extensive rural electrification program (named Luz para Todos – LPT (Light for All)) implemented by the Brazilian Federal government in 2003. The program targeted rural areas with low electrification coverage and was designed to supply lighting to family farms, households and places without lighting, including public buildings and commercial establishments. Before the program’s implementation, people lived, ran their businesses, and traveled without electricity. This environment favors violent crimes, as the lack of lighting facilitates the planning of violent crimes. Two emblematic cases that occurred in northern Brazil (rainforest area) and made headline news worldwide portray this type of violent crime: the premeditated murders of environmentalist Chico Mendes in 1988 and U.S. environmentalist Dorothy Mae Stang in 2005.
This paper also contributes to the literature on the impacts of electrification programs on individual and household outcomes. Electrification programs worldwide proved to be effective in ameliorating social welfare in different areas. According to Khander, Barnes and Samad (2009) and Khander, Barnes and Samad (2012), this type of program leads to improvements in employment, income, education, and health. Several studies corroborate the benefits of electrification (Dinkelman 2011; Bensch, Kluve and Peters 2011; Barnes and Waddle 2004; Modi et al. 2006). Our study adds to this literature by estimating the impact of the LPT program on those in rural Brazil who have access to electricity through the program.
Our study has two advantages beyond those of the existing literature. Brazil is a continental country with political and administrative divisions. It has nearly 5,700 municipalities, each with an average of 20,000 inhabitants, and all municipalities have constitutional autonomy (Constitution of 1988) endowed with the power to establish their own policies and make decisions regarding their budgets (expenditures and local taxes). Due to the large number of municipalities, the results of our investigation are robust. Additionally, homicide data are obtained from hospital reports. Thus, we avoid the use of police report data, which may suffer from underreporting.
The homicide rate is one of the largest social problems in Brazil. The relative and absolute numbers of murders in Brazil are alarming. In 2010, there were 52,260 homicides,
averaging more than 143 cases per day. Among the world’s 12 most populated countries,
Brazil has the highest homicide rates. Brazil occupies the seventh position among the 95 countries with the highest homicide rate per 100,000 inhabitants, outranked by only those countries in a state of civil war, such as the Republic of Congo, Sudan, and Afghanistan. In 2007, the Washington Post portrayed the scenario by reporting that the war between Palestine and Israel caused 729 deaths of people under the age of 18 years between 2002 and 2006. In Rio de Janeiro, there were 1,857 murders of people under the age of 18 years during the same period (Reel (2007)). Importantly, we do have information about the places where the violent deaths occurred: rural road/urban street, household or hospital.
enforced in Brazilian municipalities of the State of São Paulo, the increase in electrification had a rather greater effect.
Because we identify only the place where the violent death occurred and not where lighting was provided (private or public place), we also investigate the same effect on indoor places to minimize alternative explanations: households and hospitals. In most cases, these effects were not significantly different from zero. Interestingly, the great bulk of the negative impact is found for the violent deaths that occurred in the rural roads/urban streets in the northern, northeastern and midwestern regions of the country. Those are the regions where the LPT program was majorly implemented.
This paper is organized into seven sections. The following section introduces the related literature. Section 3 presents the Brazilian institutional background and data. Section 4 describes the methodology used, the instrumental variables with panel data, and Section 5 discusses the results. Section 6 presents the final remarks.
RELATED LITERATURE
THE EFFECT OF STREET LIGHTING ON DIFFERENT TYPES OF CRIMES
Welsh and Farrington (2008) produce an extensive report on the benefits of improved street lighting in regards to crime reduction. They cite eight investigations on American streets and five on British streets. All works evaluate the situation before and after the installation of lighting and the effects of lighting on criminality. For the US, they show the experience of the Atlanta Regional Commission (1974), whose impromptu street lighting system reduced robbery but increased burglary in the city’s downtown area. In another case,
Milwaukee’s Department of Inter-governmental Fiscal Liaison (173, 1974) demonstrates that
crimes against property and violence against persons are reduced in residential and commercial areas with street lighting. The experience of Inskeep and Golf (1974) follows the same sequence of results: less robbery and assault and more burglary in the residential neighborhood of Portland. Wright et al. (1974) find the same results for robbery, assault, and larceny and more motor vehicle theft in residential and commercial areas in Kansas City. The Harrisburg Police Department (1976) shows the same benefits (reduction in robbery and increase in assault, burglary, and motor vehicle theft in residential neighborhoods) in Harrisburg, Pennsylvania. Sternhell (1977) demonstrates that street lighting reduces crimes such as assault, burglary, and motor vehicle theft in residential and commercial areas of New Orleans. Lewis and Sullivan (1979) show a reduction in crime against property (burglary and theft) and a smaller reduction in crimes against persons (rape, assault, and robbery) in the residential neighborhood of Forth Worth, Texas.1 Finally, more violence and less crime against property are found in the residential neighborhood of Indianapolis (Quinet and Nunn 1998). For the UK, Poyner (1991) mentions that improved lighting reduces the theft of vehicles from a parking garage in Dover. Shaftoe (1994) shows a reduction in car theft and an increase in robbery in a residential neighborhood with improved street lighting (Bristol). Poyner and Webb (1992) show the same reduction in thefts in Birmingham’s downtown market. According to Painter and Farrington (1997, 2001a), crime (burglary, vehicle theft, violence, vandalism, and dishonesty) decreased with the introduction of street lighting in
1 The homicide rate was virtually zero given that two murders were observed before and one after street
Dudley. Finally, the authors mention that crime rates for burglary, vehicle theft, and violence decreased in Stake-on-Trent after the introduction of street lighting.
The elasticity observed for different crimes in the US and UK experiments is relatively high, averaging between 20% and 50%. In one case, Atlanta, the effects of street lighting on crimes are stronger: a 418.2% reduction in assaults and a 319.2% decrease in other crimes.
OTHER FACTORS THAT AFFECT VIOLENT CRIMES (THE HOMICIDE RATE)
Some works show the influence of other public safety policies, demographics, and income on the homicide rate. Regarding public safety policies, Levit (1996) shows that a 1% increase in the incarceration rate reduces the number of violent crimes by -0.379 in the United States. Similarly, Levitt (2002) argues that a 1% increase in the number of police officers per capita is associated with a -0.435 percent reduction in violent crimes (homicide rate) in the United States. For Brazilian cities in the State of São Paulo, the imposition of a dry law on commerce (a limit for bar closing hours) is associated with a large reduction (10%) in homicide rates (Biderman et al. 2009).2
The population’s demographic characteristics also influence the rates of violent crimes. Levitt (1999) estimates that a 1% increase in the fraction of young people in the population is associated with a 0.41% increase in homicide rates in the United States.
By observing the effects of inequality, Fajnzylber, Lederman and Loyaza (2002a) estimate that a one percentage point increase in the Gini coefficient is associated with a 1.5 % increase in homicide rates in several countries (cross-country study). Finally, Fajnzylber, Lederman and Loyaza (2002b) estimate that a one percentage point increase in the growth rate of income per capita is associated with a 2.4% decline in homicide rates.
INSTITUTIONAL BACKGROUND AND DATA
THE LUZ PARA TODOS (LPT) PROGRAM
The LPT program was initiated in late 2003 by the Federal Government to provide Brazilian households with public access to electricity and improve the supply of this service to unattended communities and households. It was established by the Federal Decree nº 4.873 of November, 11, 2003, and the goal was to provide universal access by 2008.
To achieve this goal, the federal government established rules for admission into the program and the responsibilities that each government level (federal, state and local) assumes in running the program. The LPT program provided local electricity providers with public subsidies to give access and deliver electricity to targeted communities, farmers or households. The program was managed by the Ministry of Mining and Energy.
Municipalities that meet at least one of the following criteria are considered eligible for the LPT program, and priority is given to the municipality that meets the largest number of criteria:
2 Between March 2001 and August 2004, 16 of the 39 municipalities in the São Paulo Metropolitan Area
I- Municipalities with electricity access coverage of less than 85% of the households based on the 2000 census data;
II- Municipalities with a human development index (HDI) lower than their state’s average in 2000;
III- Communities affected by hydroelectric power plants;
IV- Communities with rural electrification projects targeted at the productive use of electric power and at fostering local integrated development;
V- Unattended public schools, health centers, and water wells; VI- Unattended rural settlements;
VII- Unattended family farmers;
VIII- Unattended small and medium-sized farms;
IX- Communities with rural electrification projects stalled due to a lack of funds and aimed at rural communities and villages;
X- Communities living in the vicinity of nature conservation units; and
XI- Special communities, such as racial minorities, remaining quilombo communities, extractive communities, etc.
As a result, the program expanded the transmission of electricity over 1.4 million kilometers of electric cables, and the goal to reach 10 million households was achieved in 2009. The difficulty in installing cables over long distances was overcome, with some regions in the Amazon forest reached by way of underwater cable systems.
Criteria I and II, which involve electrification coverage and the HDI of municipalities in 2000, are used to construct instrumental variables for the household electrification access rate.
DATA
Brazil has 5,565 municipalities in 2010. Our sample consists of all intact municipalities in 2000 and 2010. Some new municipalities were created by dividing the previous municipalities. We construct municipality panel data for the period of 2000-2010 and exclude the municipalities that suffered divisions between 2000 and 2010, resulting in a total of 5,457 municipalities.
All variables are obtained or constructed at the municipality level. The homicide data are obtained from the Information System on Mortality on a yearly basis by DATASUS, a database organized by the Brazilian Unified Health System (SUS) of the Ministry of Health.3 The Ministry is in charge of collecting, processing, and disclosing information on health inputs and outcomes from hospital and health center reports. The data are publically available at the municipality level. Importantly, the DATASUS uses a homogeneous criterion for the classification of deaths across the country, allowing for comparisons across municipalities. In the specific case of homicides, the category that the system uses to measure this variable is that of the assault group within the matrix of death caused by external causes. Violent death is further classified by the location of occurrence: hospital, road/street, household, and others. An advantage of this dataset is that is does not suffer from underreporting, a very common problem in the police report data.
3
The explanatory variables are obtained from the 2000 and 2010 Brazilian demographic censuses conducted by IBGE (Brazilian census bureau). These censuses are chosen because their samples are representative at the municipality level and the interval between the census years coincides with the periods before and after the implementation of the LPT program.
The main explanatory variable created from the demographic census is household electricity coverage at the municipality level. It is the percentage of households with access to electricity. We also use a large set of demographic and economic variables as controls. We control for the age and years of schooling distributions. The shares of individuals in certain categories are used for age and schooling variables. Seven categories are developed for age: 0 to 7 years, 8 to 15 years, 16 to 29 years, 30 to 39 years, 40 to 49 years, 50 to 59 years, and 60 years or older. The schooling variables are based on individuals older than 25 years, with four categories created: i) up to incomplete elementary education, ii) complete elementary education, iii) incomplete and complete secondary education and iv) incomplete and complete tertiary education. The additional controls are the proportion of men (gender variable), proportion of whites (race/color variable), and the proportion of households in the rural area (rural variable).
We also control for municipality income per capita, unemployment rate and the Gini coefficient. The latter variable is obtained from the United Nations Development Program (UNDP) database, whereas the remaining variables are collected from censuses. Finally, we also control for the number of police officers (by population size) using the codes of occupations provided in the census database. Because there are differences in the classifications of occupations between the 2000 and 2010 databases, occupations directly linked to policing are grouped with other safety-related occupations (e.g., firefighters).
DESCRIPTIVE STATISTICS
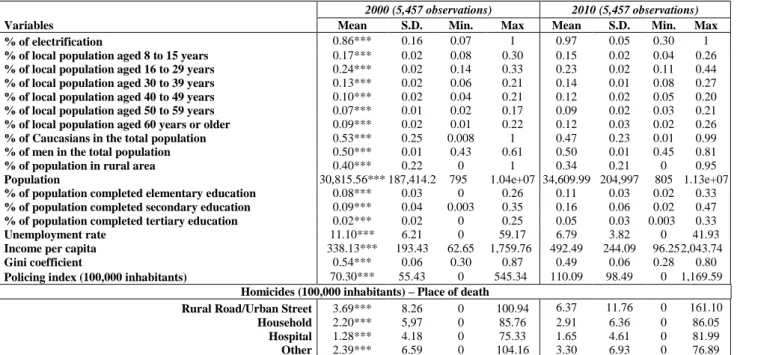
Table 1 presents the descriptive statistics of the municipality variables separately for the years 2000 and 2010. The variables include demographic and social information.
Insert Table 1 here
For all variables, the values measured in 2000 significantly differed from those measured in (Mann-Whitney test – nonparametric test). According to the table, the percentage of electrification was, on average, 86% in 2000 and 97% in 2010. In regards to age, municipalities had a young population, as over 41% of individuals were younger than 30 years old in 2000. This rate decreased to 38% in 2010. Regarding schooling, there was a delay in educational attainment; on average, 9% of the population aged over 25 years had not completed secondary education (the percentage increased in 2010, 16%), and only 2% had completed tertiary education (the percentage increased in 2010: 5%).
Note that the percentage of households without access to electricity decreased to 3% (compared to 14% in 2000). An interesting finding concerns the minimum number of households with access to electricity. In 2000, the city/town with the lowest coverage rate did not reach 7%. By contrast, in 2010, the city/town with lowest rate showed at least 30% access to electricity, which is still far from ideal but represents a major breakthrough.
value, a decrease in the percentage of households in the rural area and an increase in the average employment rate.
However, concerning criminality, the data are not encouraging. Crimes in which death occurred on rural roads/urban streets rose from 3.69 to 6.37 per 100,000 inhabitants between 2000 and 2010, representing an increase of 72%. Crimes in which violent death occurred in households increased from 2.20 to 2.91 per 100,000 inhabitants between 2000 and 2010. The number of assault-related deaths in hospitals increased from 1.28 to 1.65 per 100,000 inhabitants between 2000 and 2010. Finally, the number of homicides without clear indication of where they occurred (other) rose from 2.39 to 6.93 per 100,000 inhabitants between 2000 and 2010. There is large dispersion in the sample in regards to place. For nearly all the places, zero to 161 homicides per 100,000 inhabitants were committed on public roads/streets. Figure A.1 in the appendix shows the frequencies of homicides per 100,000 individuals by place of occurrence separately for 2000 and 2010. The distributions are highly asymmetric. This asymmetry indicates a zero median for nearly every criminal event in 2000 and 2010. The highest frequency was obtained for cities with no murders.
Table 2 shows same descriptive statistics by region for the pooled years of 2000 and 2010: north, northeast, south, southeast, and midwest. The southeast is the most populated and the richest region in Brazil. The north and northeast are the poorest regions.
Insert Table 2 here
Electrification differed across regions, and rural roads/urban street homicide rates were higher in regions where electrification was slightly lower. The data are as asymmetric as those obtained from national surveys. We built two maps (see Appendix) to show the distribution of electricity across Brazilian municipalities in 2000 and 2010. It is quite clear that the lowest coverages are found in the northern and northeastern regions (top of the maps).
EMPIRICAL STRATEGY
Instrumental variables are used to estimate the effect of electrification on crime rates, especially the homicide rate per 100,000 inhabitants. As briefly discussed in the introduction, the simple estimation of equations that link homicide rate to electrification using OLS likely yields biased results. Such bias is likely to occur because of the time-varying unobservable characteristics of municipalities that are concomitantly correlated with electrification and with crime rates. For example, it is assumed that cities/towns whose mayors can manage funds and apply public policies more efficiently could have lower homicide rates and greater access to electricity. In this case, the estimation of the parameters that measure the effect of local electrification on local homicide rates provides information on not only the causal relationship between access to electricity and homicides but also the quality of the mayor’s management, which may change over time. Additionally, inverse causality is possible. For instance, the places where crime rates increased due to, e.g., greater local control by mobs and gangs, are the locations where the access to public services showed the smallest increase.
with the endogenous variable, households’ access to electricity, but is not directly correlated with unobservable factors that affect the main dependent variable, homicide rate. The first hypothesis can be tested statistically through validity testing of the instruments calculated in the first stage of the regression. The second hypothesis can be analyzed from a theoretical/economic perspective.
In the present study, the second hypothesis of the instrumental variables method assumes that the LPT program is not closely related to the unobservable factors that determine homicide rates at the local level. It is reasonable to assume this hypothesis because the criteria of the LPT program are not influenced by municipalities because the program was devised by the federal government. Therefore, instrumental variables are used as the indicator variables for the eligibility criteria for the LPT program: 2000 HDI and household electricity coverage in 2000. The municipalities that met these criteria in 2000 are believed to have increased the likelihood of the expansion of electrification in the last decade.
In the first stage of the instrumental variables method, the following equation is estimated:
𝑚𝑡= + 𝑦 𝑎𝑟𝑡∗ 𝑚 + 𝑦 𝑎𝑟𝑡∗ 𝑙 𝑡𝑟𝑖 𝑖𝑐𝑎𝑡𝑖 𝑚 + ∑ = 𝜌 𝑚𝑡+
𝜑𝑚+ 𝑦 𝑎𝑟𝑡+ 𝜀𝑚𝑡 (1)
Emt represents the percentage of households with access to electricity in municipality
m in period t. The variables yeart*HDI2000m and yeart*electrification2000m are the
instrumental variables obtained from the interaction between the indicator variable yeart, in
which observations for year 2010 are assigned value 1 (and zero otherwise), and the dummies for compliance with the quantitative criteria of the LPT program. The 𝑚 variable assumes a value equal to one if the local HDI of municipality m in 2000 is lower than the average for its respective state and zero otherwise. The 𝑙 𝑡𝑟𝑖 𝑖𝑐𝑎𝑡𝑖 𝑚 indicator variable assumes a value equal to one if access to electricity in municipality m in 2000 is lower than 85% and zero otherwise. The k variables represented by Xjmt indicate the controls used. They
are the percentage of individuals per age group, average schooling attainment, race dummies, rural/urban location of household, income per capita, unemployment rate, municipality size (population), income distribution index (Gini coefficient), and policing. Finally, ψm is the
fixed effect of the municipality, 𝑦 𝑎𝑟𝑡 is the year 2010 indicator variable and 𝜀𝑚𝑡 is the idiosyncratic error term.
Municipalities can be categorized into four groups for the sake of analysis. The first group meets both criteria and accounts for 31% of the sample. The second group meets the HDI criterion and includes 3,054 municipalities, accounting for 55% of the sample. The third group meets the electrification criterion only and represents 1% of the sample. The last group does not meet any of the criteria and includes 734 municipalities, representing 13% of the sample.
The second stage equation is as follows:
𝑚𝑡= + + ̂𝑚𝑡+ ∑ = 𝜔 𝑚𝑡+ 𝑦 𝑎𝑟𝑡+ 𝜇𝑚+ 𝜖𝑚𝑡. (2)
Ymt is the homicide rate per 100,000 inhabitants, and ̂𝑚𝑡 is the predicted value of
effect, and 𝜖𝑚𝑡 is the error term. The coefficient of interest is . Similar strategies have been used in electrification studies in Bangladesh and South Africa (Dinkelman 2011; Khander, Barnes and Samad 2012).
The specification includes controls for municipalities’ demographic and social characteristics that are likely to be associated with the crime rate and electricity coverage: the shares of young individuals and adults, percentages of ethnic/color groups, gender, and percentage of households in the rural area. In addition to controlling for these variables, we control for schooling variables, assuming that a better level of education leads to a reduction in crime rates. The economic variables include the unemployment rate and income per capita of the municipality because favorable working conditions and income tend to reduce crime rates. This tendency is noted by Raphael and Winter-Ebmer (2001), who find a positive effect of unemployment on crime rates and conclude that policies targeted at improving the level of employment of individuals who have greater difficulties entering the labor market may be an effective measure against crime and increase the opportunity cost for unlawful actions. An equity factor and a policing variable are also controlled, following the literature (Di Tella and Schargrodsky (2004) and Draca and Machin (2011)).
RESULTS
Table 3 shows the results of the estimation of equation (1), the first stage of the instrumental variables method. The coefficients estimated for the instruments confirm the hypothesis proposed regarding the use of LPT program rules as instrumental variables for household electrification. Both the criterion of electrification coverage in 2000 and the criterion related to HDI in 2000 are significantly different from zero and display the expected signs. The results show that the municipalities that met the electrification criterion for program eligibility increased their electricity coverage by 19.2 percentage points more than those that did not satisfy this criterion. Additionally, the municipalities that satisfied the HDI criterion for program eligibility increased their electricity coverage by 0.8 percentage points more than those that did not satisfy this criterion. The F-statistic of the excluded instruments indicates that they are strongly correlated with electricity coverage, and the tests on the joint weakness of the instruments stresses their individual importance.
Insert Table 3 here
Table 4 shows the estimates for the second stage for the entire country. We identify where the homicide occurred but not where lighting was available in the municipality (private or public area). To rule out alternative explanations, we investigate the electrification coverage effect on homicides (per 100,000 inhabitants) by location of occurrence of the violent death: rural road/urban street, households, hospitals and other places (several other places without proper identification).
Insert Table 4 here
assumption that lighting allows for the easier identification of suspects, increasing the opportunity cost and deterring crime. This finding also concurs with that of Clarke and Mahyew (1980), who demonstrate that crimes may be affected by the physical features of the environment where they take place and that well-lit areas may help prevent crimes.
As previously mentioned, the dispersion of the sample of homicides per 100,000 inhabitants ranged from 0 to 100 in 2000 and from 0 to 161.10 in 2010, and the median for both years was zero. The figure of -5.091 homicides moves the municipality from the 75th percentile to the median (zero homicide). Homicides on rural roads/urban streets are virtually eliminated if a municipality moves from no light to 100% electricity access. A very strong impact is greater than the effect of the dry law (Biderman et al. 2009) implemented in the municipalities of the State of São Paulo on homicides (10% reduction). If we consider the literature findings for other crimes in the United States and England, the reduction rate is also high.
We observed a 3.91 increase in homicides per 100,000 inhabitants in unidentified areas. This result may suggest that some of the crime moved to other areas.
RESULTS BY BRAZILIAN MACRO-REGIONS
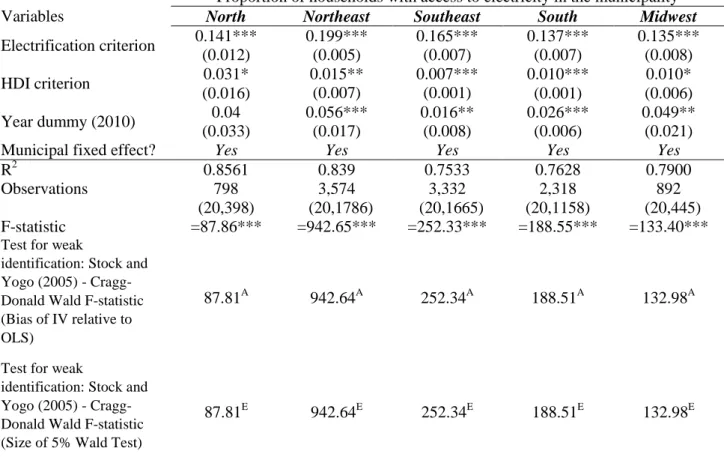
Table 5 shows the results for the second-stage regression for each of the five Brazilian regions separately. The LPT program was primarily concentrated in the municipalities of the northern and the northeastern regions, where the electricity coverages were the lowest in 2000 and increased the most between 2000 and 2010. There may be heterogeneous effects across regions.
Insert Table 5 here
The results of Table 5 support the evidence that lighting significantly reduces the number of violent deaths on public streets, especially in the northern and northeastern regions. In the northern region, moving a municipality from no access to full access to electricity was associated with a reduction of 48.12 violent deaths on streets per 100,000 inhabitants. The crime dispersion ranged from 0 to 76.67 homicides per 100,000 inhabitants, and the median was zero. This finding is sizable. A municipality moved from the 99th percentile (48.97 homicides) to the median (zero). In the northeastern region, the number of violent deaths on the streets per 100,000 inhabitants decreased to 13.43. This moved a municipality from above the 75th percentile (9.70) to the median (zero). In the midwestern region, the rate of violent deaths on the streets had an impact of -19.29 violent deaths on the streets per 100,000 inhabitants. In this case, a municipality moved from the 50th percentile to the median (zero). We do not find statistically significant impacts for the southeastern and southern regions.
We find significantly different from zero results for the effect of lighting on violent crimes in places other than rural roads/urban streets for two cases only. However, the results were not robust nationally. In the midwestern region, the coefficient estimate for violent crimes reported by hospitals was -9.63. in the southeastern region, and the coefficient of electrification coverage on crimes that occurred in other locations was -8.642. All the other coefficients were not significantly different from zero.
geographic location: the northern and northeastern regions benefit more from the positive effects of electricity. These regions showed the lowest electrification rates in 2000 and the most improved outcomes in terms of violence.
FINAL REMARKS
Larger household electrification is beneficial to the community receiving this service and can produce positive externalities. The improvements brought by municipalities’ greater access to electricity include better school enrollment rates; improved production techniques, thereby boosting productivity; health benefits and the fight against hunger, for instance, the use of cleaner energy, avoidance of pulmonary disorders, and information on disease prevention. This study sought to assess the benefits of electrification in regards to the reduction of violent deaths (homicides per 100,000 inhabitants), which remains under-investigated by the literature.
The results obtained for homicides per place of death indicate that the expansion of electrification reduces murder rates on public road or streets. This result is corroborated by the existing literature. According to this literature, one of the basic uses of electric power - lighting - may help deter this type of violence. Lighting has a preventive effect because it increases the cost for the offenders by, for example, facilitating their identification.
The categorization per region revealed a significant impact on the northern and northeastern regions, which are the poorest regions and have the highest crime rates. These
regions’ access to electricity was below the national average; therefore, they were more
sensitive to the LPT program. In other words, in regions that tend to benefit more from the program, access to electricity significantly reduces homicide rates in public areas.
Our findings regarding violent deaths (homicides per 100,000 inhabitants) are robust. Because the distribution of violent crimes is asymmetric (a large number of cities/towns have no homicides), we estimate that moving a municipality from no access to full coverage of eletricity access moves the municipality along the distribution of crime across municipalties from the 75th percentile to the median (zero) at the national level: a -5.091 reduction in homicides. This result is even more striking if we analyze it by region. In the northern region, the same exercise would move a municipality from the 99th percentile to the median (zero). Crime is thus practically eliminated (-48.12 crimes per 100,000 inhabitants). The northern region had, on average, the poorest access to electricity. In the northeastern region, similarly, full electrification would move a municipality from a percentile slightly above the 75th percentile to the median (no homicides per 100,000 inhabitants). Crime is also eliminated (-13.43 crimes per 100,000 inhabitants). The same result was found for the midwestern region. In that region, full electrification would move a municipality from a percentile slightly above the 90th percentile to the median (no homicides per 100,000 inhabitants). Crime is also eliminated (-19.29 crimes per 100,000 inhabitants).
We contribute to the literature by estimating the relationship between electrification and the homicide (violent crime) rate, yielding robust results (a large number of municipalities) for a developing country, and avoiding underreporting (hospital data). Because we use an IV strategy by exploring the LPT program eligibility criteria, we can interpret the results as the estimated impact of the program on those experiencing an increase in electricity coverage due to their program eligibility. Thus, the results represent local average treatment effects of lighting on homicides.
Togheter the results suggest that lighting due to LPT reduces violent crimes in public places. The verification of a significant impact gives public policymakers the chance to reduce crime rates. This benefit can be added to the other advantages of electrification for households that did not previously have access to electricity. Another advantage is that this approach can be applied in tandem with other crime-fighting measures.
REFERENCES
ATLANTA REGIONAL COMMISSION. Street Light Project: Final Evaluation Report. Atlanta,Georgia, 1974
BARNES, Douglas F; WADDLE, Daniel. Power-sector Reform and the Rural Poor in Central America. Energy Sector Management Assistance Program Washington, DC: The World Bank Report297/04, 2004.
BECKER, Gary S. Crime and punishment: An economic approach, Journal of Political
Economy v. 76, n. 2,p 169-217, 1968.
BENSCH , Gunther ; KLUVE ,Jochen ; PETERS ,Jörg. Impacts of rural electrification in Rwanda, The Journal of Development Effectiveness, v. 3 n.4, p 567-588, December 2011. BIDERMAN, Ciro, DE MELLO, João M. P. & SCHNEIDER, Alexandre. Dry Laws and Homicides: Evidence from the São Paulo Metropolitan Area. Economic Journal, Vol. 120, n. 543, pp 157-182, 2009.
BOYCE, Peter ; GUTKOWSKI, Janusz. The if, why and what of street lighting and street crime: A review. Lighting Research and Technology, v. 27, n. 2, p. 103-112, 1995.
Brasil, Ministério de Minas e Energia. Programa Nacional de Universalização do Acesso e uso da Energia Elétrica. Manual de Operacionalização do Programa Luz Para Todos. Revisão no6, de 22 de fevereiro de 2009.
CLARKE, Ronald ; MAYHEW, Peter. Designing Out Crime. London : HMSO, 186 p., 1980. CERQUEIRA, Daniel R. C., Causas e Consequências do Crime no Brasil. Tese de Doutorado em Economia - Pontifícia Universidade Católica do Rio de Janeiro, 2010.
CERQUEIRA, Daniel. Mapa dos Homicídios Ocultos no Brasil. Brasília, DF: IPEA, . 64 p. (Texto Para Discussão n.1848), 2013.
COOK, Philip; ZARKIN, Gary. Crime and the Business Cycle Journal of Legal Studies v. v. 14, p. 115-128, 1985.
DEPARTMENT of INTERGOVERNAMENTAL FISCAL LIAISON. Preliminary Report –
Milwaukee High Intensity Street Lighting Project. Milwaukee, Wisconsin, 1973
DINKELMAN, Taryn. The Effects of Rural Electrification on Employment: New Evidence From South Africa. American Economic Review, v. 101 n. 7, p 3078-3108, 2011.
DE MELLO, João M. P. & SCHNEIDER, Alexandre. Assessing São Paulo’s Large Drop in
Homicides: The Role of Demography and Policy Interventions. In: The Economics of Crime:
Lessons for and from Latin America, pp. 207-237, 2010.
DRACA, Mirko; MACHIN, Stephen ; WITT, Robert. Panic on the Streets of London: Police, Crime, and the July 2005 Terror Attacks. American Economic Review, v. 101 n. 5, p 2157-81, 2011.
DUGGAN, Mark. More Guns, More Crime. Journal of Political Economy, Vol. 109, n. 5, pp. 1086-1114, October 2001.
EHRLICH, Isaac. Crime, Punishment, and the Market for Offenses, The Journal of Economic
Perspectives, v. 10 n.1 ,p. 43-67, 1996.
FAJNZYLBER, Pable; LEDERMAN, David; LOYAZA, N.V. Inequality and violent crime.
Journal of Law and Economics 45(1):1-40, 2002a
_____________What causes violent crimes? European Economic Review 46(7): 1323-57, 2002b
HARRISBURG POLICE DEPARTMENT. Final Evaluation Report of the “High Intensity
Street Lighting Program“. Harrisburg, Pennsylvania: Planning and Research Section, Staff and Technical Services Division, Harrisburg Police Department, 1976
INSKEEP, N. R. and GOFF, C. A Preliminary Evaluation of the Portland Lighting Project. Salem, Oregon: Oregon Law Enforcement Council, 1974
KELLY, Morgan. Inequality and Crime, The Review of Economics and Statistics, v. 82 n.4, p. 530-539, 2000.
LEVITT, Stephen The limited role of changing age structure in explaining aggregate crime rates. Criminology 37(3):581-98, 1999
LEVITT, Stephen Using electoral cycles in police hiring to estimate the effect of police on crime: Reply. American Economic Review 92(4):1244-50, 2002
LEVITT, Steven ; MILES, Thomas. Economic Contributions to the Understanding of Crime.
Annual Review of Law and Social Science, v. 2, p. 147-164, 2006.
LEWIS, E. B. and SULLIVAN, T. T. Combating crime and citizen attitudes: A case study of the corresponding reality. Journal of Criminal Justice, 7, 71-79, 1979
KHANDER, Shahidur ; BARNES, Douglas ; SAMAD, Hussain. Welfare Impacts of Rural Electrification – Evidence from Vietnam. ; Washington : World Bank 2009, 51 p. (Policy Research Working Paper, No. 5057), 2009.
KHANDER, Shahidur ; BARNES, Douglas ; SAMAD, Hussain. Welfare Impacts of Rural Electrification: A Case Study from Bangladesh. The Energy Journal, v. 10 n.1 , p. 187-206, 2012
MODI, Vijay ; McDade, Susan ; Lallement, Dominique ; Saghir, Jamal. Energy Services for the Millennium Development Goals. Energy Sector Management Assistance Program, United
Nations Development Programme, UN Millennium Project, World Bank, New York, USA,
109 p, 2006.
PAINTER, Kate. Lighting and Crime Prevention, The Edmonton Project. Centre from Criminology, Paper n. 1, Cambridge, Middlesex Polytechnic, 1988.
PAINTER, K. A. and FARRINGTON, D. P. The crime reducing effect of improved street lighting: The Dudley project. In R. V. Clarke (ed.) Situational Crime Prevention: Successful
Case Studies, 2nd ed. (pp. 209-226). Guilderland, N.Y.: Harrow and Heston., 1997
______________________________________Evaluating situational crime prevention using
a young people’s survey. British Journal of Criminology, 41, 266-284., 2001a
______________________________________The financial benefits of improved street lighting, based on crime reduction. Lighting Research and Technology, 33, 3-12., 2001b PEASE, Ken. A review of street lighting evaluations: Crime reduction effects. Crime Prevent
ion Studies, v.10 n.1, p 47-76. 1999
POYNER, Barry. ; WEBB, Barry. Reducing Theft from Shopping Bags in City Centre Markets. In: CLARKE, Ronald. Situational Crime Preventions: Successful Case Studies. Ed. 2. Albany, NY Harrow e Heston., p 83-89, 1992.
QUINET, K. D. and NUNN, S. Illuminating crime: The impact of street lighting on calls for police service. Evaluation Review, 22, 751-779, 1998
QUINNEY, Richard. "Structural Characteristics, Population Areas, and Crime Rates in the United States." Journal of Criminal Law , v. 57 n. 1, pp. 45-52. March 1966.
RAMSEY, Malcom ; NEWTON,Rosemary. The Effect of Better Street Lighting on Crime and Fear: a Review. London, UK: Home Office, Crime Prevention Unit Paper n. 29, 1991 RAPHAEL, Stephen ; WINTER-EBMER, Rudolf. Identifying the Effect of Unemployment on Crime, Journal of Law and Economics, v. 44 n. 1, p 259-284, 2001.
REEL, Monte. In Rio, death comes early: Juveniles are often victim as gangs, police vie for control of slums 2007. Washington Post, Washington, April 16, 2007, Washington Post Foreign Service, 2007.
SHAFTOE, H. Easton/Ashley, Bristol: Lighting improvements. In S. Osborn (ed.) Housing
Safe Communities: An Evaluation of Recent Initiatives (pp. 72-77). London: Safe
Neighbourhoods Unit., 1994
SOARES, Rodrigo R. Crime Reporting as a Measure of Institutional Development. Economic
Development and Cultural Change, Vol. 52, n. 4, pp. 851-871, July 2004
SOARES, Rodrigo R. & NARITOMI, Joana. Understanding High Crime Rates in Latin America: The Role of Social and Policy Factors. In: The Economics of Crime: Lessons for
and from Latin America, pp. 19-55, 2010
STIGLER, George. The optimum enforcement of laws. Journal of Political Economy 78(3):526-36, 1970
STERNHELL, R. The Limits of Lighting: The New Orleans Experiment in Crime Reduction:
Final Impact Evaluation Report. New Orleans, Louisiana: Mayor’s Criminal Justice
Coordinating Council, 1977
WAISELFISZ, Julio J. Mapa da Violência 2013: Homicídios e Juventude no Brasil. São Paulo: Instituto Sangari, 1ª Edição, 2013.
WELSH, Brandon ; FARRINGTON, David, Effects of Improved Street Lighting on Crime.
Campbell Systematic Review, v. 13, n. 1, 2008.
Tables and Figures
Table 1: Descriptive Statistics (2000 and 2010)
Variables
2000 (5,457 observations) 2010 (5,457 observations) Mean S.D. Min. Max Mean S.D. Min. Max % of electrification 0.86*** 0.16 0.07 1 0.97 0.05 0.30 1 % of local population aged 8 to 15 years 0.17*** 0.02 0.08 0.30 0.15 0.02 0.04 0.26 % of local population aged 16 to 29 years 0.24*** 0.02 0.14 0.33 0.23 0.02 0.11 0.44 % of local population aged 30 to 39 years 0.13*** 0.02 0.06 0.21 0.14 0.01 0.08 0.27 % of local population aged 40 to 49 years 0.10*** 0.02 0.04 0.21 0.12 0.02 0.05 0.20 % of local population aged 50 to 59 years 0.07*** 0.01 0.02 0.17 0.09 0.02 0.03 0.21 % of local population aged 60 years or older 0.09*** 0.02 0.01 0.22 0.12 0.03 0.02 0.26 % of Caucasians in the total population 0.53*** 0.25 0.008 1 0.47 0.23 0.01 0.99 % of men in the total population 0.50*** 0.01 0.43 0.61 0.50 0.01 0.45 0.81 % of population in rural area 0.40*** 0.22 0 1 0.34 0.21 0 0.95 Population 30,815.56*** 187,414.2 795 1.04e+07 34,609.99 204,997 805 1.13e+07 % of population completed elementary education 0.08*** 0.03 0 0.26 0.11 0.03 0.02 0.33 % of population completed secondary education 0.09*** 0.04 0.003 0.35 0.16 0.06 0.02 0.47 % of population completed tertiary education 0.02*** 0.02 0 0.25 0.05 0.03 0.003 0.33 Unemployment rate 11.10*** 6.21 0 59.17 6.79 3.82 0 41.93 Income per capita 338.13*** 193.43 62.65 1,759.76 492.49 244.09 96.25 2,043.74 Gini coefficient 0.54*** 0.06 0.30 0.87 0.49 0.06 0.28 0.80 Policing index (100,000 inhabitants) 70.30*** 55.43 0 545.34 110.09 98.49 0 1,169.59
Homicides (100,000 inhabitants) – Place of death
Rural Road/Urban Street 3.69*** 8.26 0 100.94 6.37 11.76 0 161.10 Household 2.20*** 5,97 0 85.76 2.91 6.36 0 86.05
Table 2: Descriptive Statistics by Region (2000 and 2010)
Variables
North (798 observations) Northeast (3,574 observations) Southeast (3,332 observations) South (2,318 observations) Midwest (892 observations) Mean S.D. Min. Max Mean S.D. Min. Max Mean S.D. Min. Max Mean S.D. Min. Max Mean S.D. Min. Max % of electrification 0.75 0.18 0.16 0.99 0.86 0.16 0.07 1 0.96 0.06 0.33 1 0.97 0.04 0.50 1 0.93 0.09 0.36 1 % of local population aged 8 to
15 years 0.19 0.02 0.10 0.30 0.18 0.02 0.10 0.26 0.15 0.02 0.04 0.25 0.14 0.02 0.07 0.23 0.15 0.02 0.08 0.24 % of local population aged 16
to 29 years 0.25 0.02 0.17 0.33 0.25 0.01 0.18 0.33 0.23 0.02 0.15 0.44 0.22 0.02 0.11 0.30 0.24 0.02 0.17 0.33 % of local population aged 30
to 39 years 0.12 0.02 0.06 0.21 0.12 0.01 0.06 0.21 0.14 0.01 0.09 0.27 0.14 0.02 0.08 0.21 0.15 0.01 0.09 0.20 % of local population aged 40
to 49 years 0.09 0.01 0.04 0.14 0.09 0.01 0.05 0.16 0.12 0.01 0.06 0.20 0.13 0.01 0.07 0.21 0.12 0.01 0.06 0.18 % of local population aged 50
to 59 years 0.06 0.01 0.02 0.11 0.07 0.01 0.03 0.13 0.09 0.01 0.03 0.16 0.10 0.02 0.04 0.21 0.08 0.02 0.03 0.15 % of local population aged 60
years or older 0.06 0.02 0.01 0.13 0.10 0.02 0.02 0.19 0.11 0.03 0.03 0.25 0.12 0.03 0.03 0.26 0.09 0.03 0.01 0.19 % of Caucasians in the total
population 0.52 0.09 0.01 0.86 0.30 0.11 0.008 0.86 0.58 0.19 0.07 0.98 0.81 0.12 0.22 1 0.45 0.12 0.11 0.93 % of men in the total
population 0.52 0.01 0.47 0.61 0.50 0.01 0.45 0.56 0.50 0.01 0.43 0.81 0.50 0.01 0.46 0.63 0.51 0.01 0.47 0.57 % of population in rural area 0.44 0.19 0 0.95 0.46 0.19 0 0.98 0.27 0.19 0 0.86 0.40 0.23 0 1 0.29 0.17 0 0.80 Population 32,630.01 111,734.7 958 1,802,014 28,164.38 103,928.9 1,253 2,675,656 45,744.97 320,415.8 795 1.13e+07 22,589.06 76,717.31 1,113 1,751,907 28,638.19 133,604.6 895 2,570,160 % of population completed
elementary education 0.09 0.03 0.01 0.22 0.07 0.03 0 0.33 0.11 0.03 0.008 0.26 0.12 0.03 0.02 0.33 0.11 0.03 0.03 0.22 % of population completed
secondary education 0.12 0.06 0.008 0.38 0.10 0.05 0.003 0.47 0.14 0.06 0.006 0.40 0.13 0.05 0.004 0.36 0.14 0.05 0.02 0.35 % of population completed
tertiary education 0.02 0.02 0 0.20 0.02 0.01 0 0.19 0.05 0.03 0 0.33 0.04 0.03 0 0.31 0.04 0.03 0 0.23 Unemployment rate 10.45 6.31 0.48 59.17 10.15 5.81 0 45.28 9.41 5.30 0 35.57 5.91 4.56 0 40.59 8.91 4.46 1.23 27.01 Income per capita 277.15 128.25 62.65 1,087.35 223.31 101.03 63.5 1,144.26 514.65 216.29 85.69 2,043.74 583.29 217.69 156.51 1,798.12 500.64 174.95 116.72 1,715.11 Gini coefficient 0.58 0.06 0.42 0.81 0.54 0.05 0.35 0.82 0.49 0.06 0.32 0.78 0.49 0.07 0.28 0.08 0.52 0.07 0.36 0.87 Policing index (100,000
inhabitants) 118.14 118.90 0 1,169.59 88.14 78.91 0 716.96 88.85 81.37 0 846.92 73.82 60.57 0 632.11 120.95 93.73 0 912.40 Homicides (100,000 inhabitants) – Place of death
Rural Road/Urban Street 5.35 10.38 0 76.67 6.79 12.14 0 161.10 3.80 8.61 0 110.43 3.61 8.61 0 132.21 5.94 10.25 0 100.94 Household 2.91 7.06 0 85.99 2.38 5.28 0 58.02 2.04 5.46 0 86.05 2.72 7.08 0 80.97 4.37 8.06 0 68.39
Table 3: First-stage Results
Variables
Dependent Variable:
% of electrification
Electrification criterion 0.192***
(0.003)
HDI criterion 0.008***
(0.002)
Year dummy (2010) 0.038***
(0.006)
Municipal fixed effect? Yes
R2 0.8133
Observations 10,914
F (20,5456) 624.37****
Test for weak identification: Stock and Yogo (2005) -
Cragg-Donald Wald F-statistic (Bias of IV relative to OLS) 1959.25A
Test for weak identification: Stock and Yogo (2005) -
Cragg-Donald Wald F-statistic (Size of 5% Wald Test) 1959.25E
Note: *** p<0.01, ** p<0.05, * p<0.1; Standard deviation in parentheses and clustered by municipality (see
Bertrand, Duflo, and Mullainethen 2004); Control variables: percentage of different age groups (aged 8 to 15 years, aged 16 to 29 years, aged 30 to 39 years, aged 40 to 49 years, aged 50 to 59 years, aged 60 years or older), proportion of Caucasians in the total population, percentage of men in the total population, percentage of population in rural area, percentage of population in different educational groups (completed elementary education, completed secondary education, completed tertiary education), local population, local unemployment rate, local income per capita, local Gini coefficient, and policing index; A, B, C, and D are the maximum IV relative bias at 5%, 10%, 20%, and more than 30%, , respectively; E, F, G, and H are the maximum IV size at 10%, 15%, 20%, and more than 25%, respectively.
Table 4: Lighting and Violent Crime by Place of Death
Variable
Dependent Variable:
Homicides per 100,000 inhabitants Rural Road
/Urban Street Household Hospital Other
% of electrification -5.091* -1.027 -0.200 3.190* (2.669) (1.716) (0.749) (1.728) Municipal fixed effect? Yes Yes Yes Yes
Year dummy? (2010) Yes Yes Yes Yes
R2 0.064 0.012 0.016 0.029
Observations 10,914 10,914 10,914 10,914
Note: *** p<0.01, ** p<0.05, * p<0.1; Standard deviation in parentheses and clustered by municipality (see
Table 5: Lighting and Violent Crime by Place of Death – Different Brazilian Regions
Place of death
Dependent Variable:
Homicides per 100,000 inhabitants on
North Northeast Southeast South Midwest
Rural Road /Urban Street -48.12*** -13.43*** -2.383 15.34 -19.29* (16.34) (4.160) (6.649) (15.75) (11.19)
R2 0.125 0.166 0.042 0.074 0.051
Observations 798 3,574 3,332 2,318 892
Household -1.004 -1.095 -1.444 -10.26 1.780
(8.956) (2.092) (4.114) (9.462) (10.59)
R2 0.095 0.026 0.020 0.027 0.058
Observations 798 3,574 3,332 2,318 892
Hospital
-14.94 -0.485 2.992 -0.443 -9.634*
(11.89) (0.854) (2.115) (3.260) (5.447)
R2 0.038 0.104 0.092 0.037 0.055
Observations 798 3,574 3,332 2,318 892
Other 6.183 2.917 -8.642* -2.750 0.483
(9.714) (2.156) (4.876) (9.722) (12.79)
R2 0.144 0.088 0.037 0.023 0.060
Observations 798 3,574 3,332 2,318 892
Municipal fixed effect? Yes Yes Yes Yes Yes
Year dummy? (2010) Yes Yes Yes Yes Yes
Note: *** p<0.01, ** p<0.05, * p<0.1; Standard deviation in parentheses and clustered by
municipality (see Bertrand, Duflo, and Mullainethen 2004); Control variables: percentage of different age groups (aged 8 to 15 years, aged 16 to 29 years, aged 30 to 39 years, aged 40 to 49 years, aged 50 to 59 years, aged 60 years or older), proportion of Caucasians in the total population, percentage of men in the total population, percentage of population in rural area, percentage of population in different educational groups (completed elementary education, completed secondary education, completed tertiary education), local population, local unemployment rate, local income per capita, local Gini coefficient, and policing index.
0 1000 2000 3000 4000 F re q u e n c y
0 10 20 30
Per hundred thousand inhabitants
Homicidies - Rural Way/Urban Street - 2000
0 1000 2000 3000 F re q u e n c y
0 10 20 30
Per hundred thousand inhabitants Homicidies - Rural Way/Urban Street - 2010
0 1000 2000 3000 4000 F re q u e n c y
0 10 20 30
Per hundred thousand inhabitants Homicidies - Housing - 2000
0 1000 2000 3000 4000 F re q u e n c y
0 10 20 30
Per hundred thousand inhabitants Homicidies - Housing - 2010
0 1000 2000 3000 4000 5000 F re q u e n c y
0 10 20 30
Per hundred thousand inhabitants Homicidies - Hospital - 2000
0 1000 2000 3000 4000 F re q u e n c y
0 10 20 30
Per hundred thousand inhabitants Homicidies - Hospital - 2010
0 1000 2000 3000 4000 F re q u e n c y
0 10 20 30
Per hundred thousand inhabitants Homicidies - Others - 2000
0 1000 2000 3000 4000 F re q u e n c y
0 10 20 30
Per hundred thousand inhabitants Homicidies - Others - 2010
Informed Place of Homicidies
Table A2: First-stage Results – Different Regions
Variables
Dependent Variable:
Proportion of households with access to electricity in the municipality
North Northeast Southeast South Midwest
Electrification criterion 0.141*** 0.199*** 0.165*** 0.137*** 0.135***
(0.012) (0.005) (0.007) (0.007) (0.008)
HDI criterion 0.031* 0.015** 0.007*** 0.010*** 0.010*
(0.016) (0.007) (0.001) (0.001) (0.006)
Year dummy (2010) 0.04 0.056*** 0.016** 0.026*** 0.049**
(0.033) (0.017) (0.008) (0.006) (0.021)
Municipal fixed effect? Yes Yes Yes Yes Yes
R2 0.8561 0.839 0.7533 0.7628 0.7900
Observations 798 3,574 3,332 2,318 892
F-statistic
(20,398) =87.86***
(20,1786) =942.65***
(20,1665) =252.33***
(20,1158) =188.55***
(20,445) =133.40*** Test for weak
identification: Stock and Yogo (2005) - Cragg-Donald Wald F-statistic (Bias of IV relative to OLS)
87.81A 942.64A 252.34A 188.51A 132.98A
Test for weak
identification: Stock and Yogo (2005) - Cragg-Donald Wald F-statistic (Size of 5% Wald Test)
87.81E 942.64E 252.34E 188.51E 132.98E
Note: *** p<0.01, ** p<0.05, * p<0.1; Standard deviation in parentheses and clustered by municipality (see Bertrand,