CHARACTERIZATION OF HUMAN THERMAL COMFORT IN URBAN AREAS OF
BRAZILIAN SEMIARID
PEDRO VIEIRA DE AZEVEDO
1, PÉRICLES TADEU DA COSTA BEZERRA
2, MÁRIO DE MIRANDA
VILAS BOAS RAMOS LEITÃO
3, CARLOS ANTONIO COSTA DOS SANTOS
11
Universidade Federal de Campina Grande,
Unidade Acadêmicade Ciências Atmosféricas,
Campina Grande, PB, Brasil
2
Ministério do Planejamento, Orçamento e Gestão, Brasília, DF, Brasil
3
Universidade Federal do Vale do São Francisco, Colegiado Acadêmico de Engenharia Agrícola
(UNIVASF/CAEA), Juazeiro, BA, Brasil
[email protected], [email protected], [email protected], pericles.bezerra@dnit.
gov.br, [email protected].
Received November 2014 - Accepted March 2015
ABSTRACT
Experimental studies were conducted aiming to characterize the thermal conditions in urban areas of the Brazilian semiarid for identifying the level of human thermal comfort in urban areas of the municipalities of Mossoró-RN, Serra Talhada-PE, Petrolina-PE and Juazeiro-BA. The results showed that the constituent elements of urban areas contribute to human thermal discomfort index (DIT).
Both the wet and dry seasons showed up an uncomfortable condition in Mossoró on May 15th and on 23rd, 2008 (rural area) and on May 25rd, 2008 (urban area). By applying Thom’s equation for obtaining the DIT, it was observed that the urban areas reported thermal comfort conditions always
inferior to those observed in the rural areas. The results indicate conditions of partial comfort for the all areas surveyed. However, the incidence of human thermal discomfort related to the minimum, average and maximum air temperatures are, probably associated to the formation of urban heat islands. In addition, the afforestation is an effective mechanism of mitigating the adverse effects of these structures with better quality of life to the population. Therefore, it can be stated that the Brazilian
semiarid region has speciic urban climate, which is inluenced by the design characteristics of the
urban structure and buildings.
Keywords: urban and rural areas, air temperature and humidity, human thermal discomfort index. RESUMO: CARACTERIZAÇÃO DO CONFORTO TÉRMICO HUMANO EM ÁREAS URBANAS DO SEMIÁRIDO BRASILEIRO
Estudos experimentais foram realizados com o objetivo de caracterizar as condições térmicas em
áreas urbanas do semiárido brasileiro para identiicar o nível de conforto térmico dos municípios
de Mossoró-RN, Serra Talhada-PE, Petrolina-PE e Juazeiro-BA. Os resultados mostraram que os elementos constitutivos de áreas urbanas contribuem para índice de desconforto térmico (DIT). Nas estações secas e úmidas foram observadas condições desconfortáveis em Mossoró. Ao aplicar a equação de Thom para a obtenção do DIT, observou-se que as áreas urbanas relataram condições de conforto térmico sempre inferiores às observadas nas áreas rurais. Os resultados indicam condições de conforto parcial para as todas as regiões pesquisadas. No entanto, a incidência de desconforto térmico relacionada com as temperaturas mínima, média e máxima do ar são, provavelmente associadas à
formação de ilhas de calor urbanas. Além disso, a arborização é um mecanismo eicaz na mitigação
dos efeitos adversos destas estruturas com melhor qualidade de vida à população. Portanto, pode-se
airmar que a região do semiárido brasileiro tem clima urbano especíico, que é inluenciada pelas
características dos projetos da estrutura urbana e edifícios.
1. INTRODUCTION
Blazejczyk et al. (2012) afirms that in the last century there has been much active research on how to deine human
thermal comfort which resulted in various models. A large number of indices have been proposed, which are (or were) in use throughout the world. Some studies, such as Goldreich (1995), Ichinose et al. (1999) and Silva et al. (2010) showed that urban climate has been widely studied in many parts of the world, and the heat island phenomenon has been discussed, along with its impacts on the urban thermal environment. Similarly, the assessment of the effects of urbanization on human thermal comfort has been also studied by several researchers, for example: Burian and Shepherd (2005), Stathopoulos et al. (2004) and Sarrat et al. (2006).
Thermal comfort expresses satisfaction with the thermal environment, which is assessed by evaluating both objective and subjective parameters. The environmental conditions for reaching a sense of thermal comfort vary with the individual, once people have physiological and psychological differences. When the thermal environmental conditions exceed certain ranges, the human body thermoregulatory mechanisms are activated in order to maintain constant internal body temperature. Temperatures beyond the limits of comfort may cause thermal fatigue, and consequently, malaise, reduction of work performance, total loss of ability to perform intellectual activities, health problems and even death (Lamberts, 2014).
The human activities cause changes in the atmospheric composition and triggers climate change studies that form in the cities, called urban climate, which constitutes one of the most relevant factors for the environmental quality of the built environment (Coltri et al., 2007). The interurban climatic conditions are directly related to the heterogeneity of land use and urban features, generating heat islands and wet and dry
islands (Viana and Amorim, 2008). Signiicant changes were
observed in the urban atmosphere in Campina Grande-PB because of intense urbanization (Sousa Júnior, 2006; Silva et al., 2010). According to Johansson (2006), in hot and dry climates, a compact urban model is preferable. However, if there is a cold season, this urban model must include some wider or open spaces to provide access to solar radiation. In search for alternatives to offer human thermal comfort in environments already built, Alexandria and Jonesb (2008) found a reduction of temperature, improved thermal comfort,
and energy savings by covering rooing and walls with some
vegetation. Thus, thermal comfort can be approached on the basis of human and environmental variables (Nicol and Humphreys, 2002; Barbosa et al., 2003; Corbella and Yannas, 2003; Lamberts, 2014; Kwok and Chun, 2003 and Prado and Ferreira, 2005).
In the Brazilian semiarid region, the development of some cities, particularly those of medium size, helps to explain how changes in their urban structures, especially the coating of public roads in downtown areas, lead to experience temperature rise from the surrounding areas (Oke, 1991; Monteiro and Alucci, 2005; Bezerra et al., 2013). Temperature differences between the city and its surroundings, caused by environmental differences between urban and rural areas form currents of rising air moving from the urban periphery to the most heated areas, conducting air pollutants generated in the periphery to the urban center. These pollutants will be added to the existing urban center, intensifying the problem of environmental degradation in urban centers. Therefore, the already adverse natural conditions of the semiarid region are worsened by the building blocks of urban structures that contribute more markedly to worsen the quality of life in urban centers with increased thermal discomfort for the city population (Bezerra, 2009).
The Brazilian semiarid low latitudes are responsible for higher temperatures in cities, together with the land use and land
cover changes cause modiications in energy balance, evidenced
by the generation of heat islands (Perez et al., 2001; Azevedo and Tarifa, 2001; Kalnay and Cai, 2003; Monteiro and Mendonça, 2003 and Silva et al., 2010). Studies of energy balance in urban areas have shown that, contrary to what occurs in natural areas,
the sensible heat lux has to be much higher than the latent heat lux, causing an increase in temperature compared with the
rural environment (Oke et al., 1992). Recognizing the regional uncertainties on global climate models, several initiatives have emphasized the analyses focusing on smaller scales as boundary conditions for the production of more detailed scenarios (Silva Dias and Silva Dias, 2007).
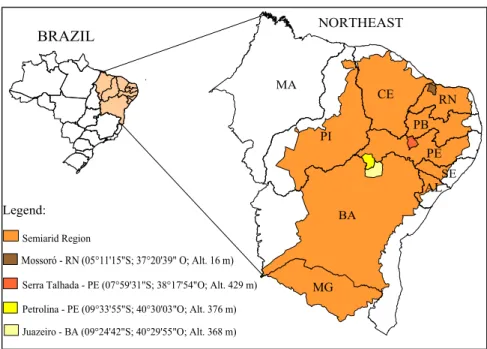
In this context, knowledge of urban climate provides information for cities spatial management and planning, through technical, economic and political scenarios that can contribute to sustainable development (Grimmond et al., 2010; Kithiia and Dowling, 2010 and Mills et al., 2010). Given the above, this study aimed to characterize the human thermal conditions in urban areas of the Brazilian semiarid, to identify the level of human thermal comfort in urban areas of the municipalities of Mossoró-RN, Serra Talhada-PE, Petrolina-PE and Juazeiro-BA.
2. MATERIAL AND METHODS
2.1 Areas of study and Instrumentation
6,389 km2 and Population: 197,965 inhabitants), all inserted in the Brazilian semiarid region (Figure 1). These municipalities have the following climatic characteristics:
Mossoro: Very hot and dry climate with the rainy season from February to May, average annual temperature of 27.6 ºC, annual rainfall of 772.7 mm and average annual relative humidity of 68.3%;
Serra Talhada: Semiarid climate with rainy season from November to April, average annual temperature of 25.2 ºC, annual rainfall of 381.5 mm, average annual relative humidity of 47.4 %;
Petrolina: Very dry and semi-arid climate with rainy season from November to April, average annual temperature of 25.2 ºC, annual rainfall of 479 mm, average annual relative humidity of 50.2 %;
Juazeiro: Dry and hot climate with a high risk of drought and with rainy season from November to April, average annual temperature of 25.9 ºC, annual rainfall of 430 mm, average annual relative humidity of 53.4 %.
An automatic weather station was installed in the main public square in downtown of each municipality, with absence of obstacles around, for measuring temperature and relative humidity, wind speed and direction and rainfall for the periods: wet (May 12th to 26th, 2008) and dry (November 15th to December 5th, 2008). The sensors were coupled to automatic
data collection systems (CR-10X data logger, Campbell), programmed to collect data every 2 seconds, providing average every 30 minutes and extreme values every 24 hours report. Data obtained in the different observational sites have been compared to each other and to those representing the natural
condition without inluence of urbanization, collected at weather
stations located in a rural area of each municipality analyzed.
2.2 METHODOLOGY
The degree of thermal comfort was obtained by adapting the discomfort index of Thom (DIT), as follows (Monteiro and
Alucci, 2005):
Where Ta is the air temperature (ºC) and RHa the relative
humidity (%).
For all studied areas, it was observed an inverse relationship between air temperature and relative humidity, i.e., the maximum air temperature occurs at times very close to those of the minimum relative humidity. Similarly, the minimum air temperature occurs at times close to those of maximum relative humidity. Thus, it was possible to split the calculation of DIT
into two components:
Where (DIT)x is the maximum thermal discomfort index
(ºC), Tx the maximum air temperature (°C), RHm the minimum
relative humidity (%), (DIT)m the minimum thermal discomfort
index (ºC), Tm the minimum air temperature (°C) and RHx the
maximum relative humidity (%).
(
0,55−0,0055)(
−14,5)
−
= a a a
T T RH T
DI
(1) Legend:
Mossoró - RN (05°11'15"S; 37°20'39" O; Alt. 16 m) Semiarid Region
Serra Talhada - PE (07°59'31"S; 38°17'54"O; Alt. 429 m)
Petrolina - PE (09°33'55"S; 40°30'03"O; Alt. 376 m)
Juazeiro - BA (09°24'42"S; 40°29'55"O; Alt. 368 m)
MA
BA PI
MG
CE RN
PB
PE
SE AL BRAZIL
NORTHEAST
Figure 1 - Geographical location of the studied areas.
(
DIT)
x=Tx−(
0, 55−0, 0055RHm)(
Tx−14, 5)
(
DIT)
m =Tm−(
0,55−0,0055RHx)(
Tm−14,5)
(2)
The information in Table 1 were used to classify the level of thermal discomfort (Silva et al., 2010). To enable an effective comparison of data obtained in different localities surveyed, all
recorded in ield experiments (in clock time) were converted
to true solar time, considering the corrections of time equation (Et) and the differences of longitude (λ) as follows:
Where ta is the apparent time (true solar time); tc is the
civil time (clock time); Δλ is the correction due to different longitudes:
Et = 7.5x10⁻⁵ + 1.87x10⁻³cos(Γ) – 3.21x10⁻²sen (Γ)
– 1.46x10⁻²cos(2Γ) – 4.09x10⁻²sen(2Γ)
Where λs is the standard meridian of longitude; λl is the
local longitude, and
d = day of the year.
3. RESULTS AND DISCUSSION
Mean and extreme (maximum and minimum) values of air temperature, relative humidity and wind speed were analyzed for wet (May 12th to 26th, 2008) and dry (November 15th to
December 5th, 2008) periods beyond comparisons between rural and urban areas of each city studied.
3.1 Air Temperature
a) Wet period
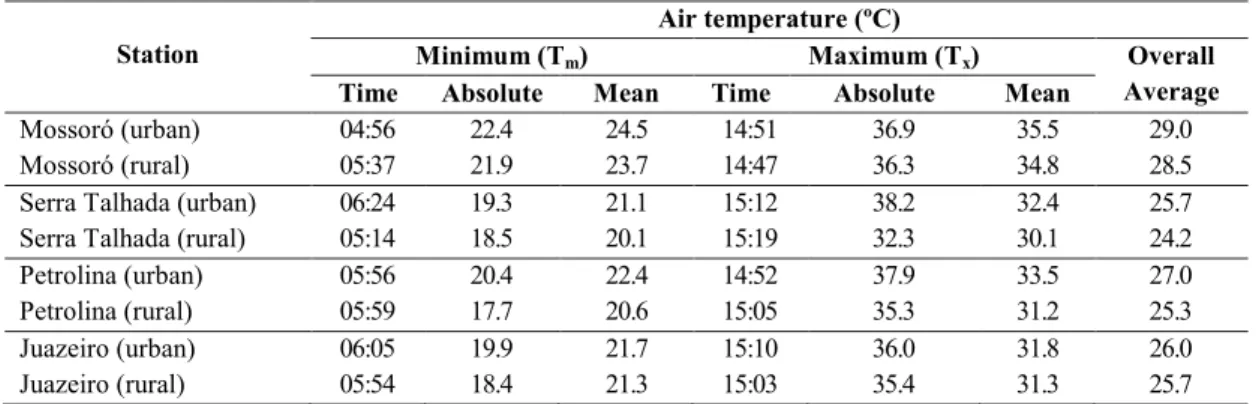
By analyzing the data of the wet period (Table 2), it appears that the air temperature (Ta) in urban areas was on average higher than that observed in rural areas in all districts and the urban area of Mossoró presented increased overall average (29.0 °C). Moreover, the urban area of Serra Talhada was the largest absolute value of air temperature (38.2 °C). In this same area, with the largest temperature range of 18.9 ºC difference between the maximum and minimum air temperatures, was also observed. However, the urban area of Mossoró had the highest average maximum temperature (Tx = 35.5 ºC). The rural area registered
the lowest minimum air temperature absolute values of 17.7 ºC and 20.1 ºC for Petrolina and Serra Talhada, respectively, while the rural area of Serra Talhada had the lowest mean minimum air temperature (Tm = 20.1 °C). Occurrences of lower temperatures were observed during the time-period from 5 to 6 a.m. while the higher air temperatures occurred between 14 and 15 p.m.
b) Dry period
During the dry period (Table 3), it was observed that the air temperature in the urban area was, on average, higher than t
c
a t E
t = + ∆λ +
(4)
(
λs λl)
λ = −
∆ 4
-5 -3 Γ) – 3.21x10⁻² Γ
– 1.46x10 Γ) – 4.09x10 Γ
(5)
(6)
(
1)
365 360
−
=
Γ d
(7)
Level Range of DIT (ºC) Classes of thermal discomfort
1 DIT≤ 14,9 uncomfortable
2 15,0 ≤ DIT≤ 19,9 comfortable
3 20,0 ≤ DIT≤ 26,4 partial comfort
4 DIT≥ 26,5 uncomfortable
Table 1 - Classes of thermal discomfort due to the Thom’s thermal discomfort index (DIT).
Station
Air temperature (ºC)
Minimum (Tm) Maximum (Tx) Overall
Average
Time Absolute Mean Time Absolute Mean
Mossoró (urban) 04:56 22.4 24.5 14:51 36.9 35.5 29.0 Mossoró (rural) 05:37 21.9 23.7 14:47 36.3 34.8 28.5 Serra Talhada (urban) 06:24 19.3 21.1 15:12 38.2 32.4 25.7 Serra Talhada (rural) 05:14 18.5 20.1 15:19 32.3 30.1 24.2 Petrolina (urban) 05:56 20.4 22.4 14:52 37.9 33.5 27.0 Petrolina (rural) 05:59 17.7 20.6 15:05 35.3 31.2 25.3 Juazeiro (urban) 06:05 19.9 21.7 15:10 36.0 31.8 26.0 Juazeiro (rural) 05:54 18.4 21.3 15:03 35.4 31.3 25.7
that observed in rural areas in all municipalities. In addition, it was observed that the urban area of Serra Talhada had the highest average (30.0 ºC) and the highest absolute value of the air temperature (39.0 °C) during the period. In the rural area of Serra Talhada occurred the lowest mean minimum temperature (22.0 °C). However, it was in the urban area of Petrolina that registered the lowest absolute value for this climate variable (20.6 °C). The largest thermal amplitude occurred in rural area of Serra Talhada with 17.7 ºC difference between Tx and Tm. The occurrence of
lower temperatures were always observed at the times between 4 and 7 a.m. while the higher air temperatures occurred at between 1:00 and 4:00 pm. These results are in agreement with the climatology of the region, as described in the Section 2.1.
3.2 Relative humidity
a) Wet period
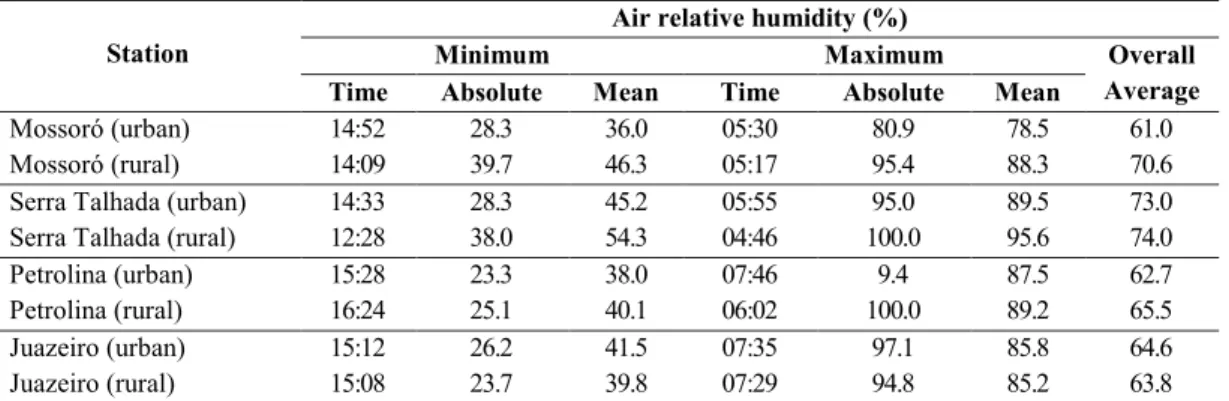
The relative humidity results obtained during the wet period are summarized in Table 4. It is observed, that in the course of this period, the maximum relative humidity (RHx)
was, on average, more than 78.5% in all the surveyed localities.
This climatic variable was on average lower in the urban than in rural environments in Mossoró, Serra Talhada and Petrolina. In Juazeiro, probably due to wind currents arising from the São Francisco River, the urban area presented a relative humidity average slightly higher than that observed in rural area. The absolute maximum relative humidity always occurred at times between 5:00 and 8:00 am while the minimum relative humidity occurred between 2:00 and 4:30 pm.
It is worth noting that the occurrence of extreme values of relative humidity has a direct impact on thermal comfort, since rates above 90% hinders respiration while less than 40% levels are harmful to human health and the occurrences of values lower than this moisture level were observed in the four cities studied. The urban area of Mossoró presented, on average, the lowest values of relative humidity (36.0%) while in absolute terms the lowest rate recorded during this period was 23.3% in the urban area of Petrolina.
b) Dry period
The results of the dry period are summarized in Table 5, in which one can observe that the maximum relative humidity
Station
Air temperature (ºC)
Minimum Maximum Overall
Average Time Absolute Mean Time Absolute Mean
Mossoró (urban) 04:37 23.7 24.6 12:51 37.9 36.0 29.1 Mossoró (rural) 04:14 22.7 23.8 12:04 36.9 35.0 28.3 Serra Talhada (urban) 05:26 21.5 23.1 15:07 39.0 37.2 30.0 Serra Talhada (rural) 05:25 20.8 22.0 13:32 38.5 36.1 29.6 Petrolina (urban) 05:23 20.6 22.9 13:59 39.0 35.9 28.9 Petrolina (rural) 06:26 20.7 22.7 16:17 36.4 34.5 28.1 Juazeiro (urban) 07:01 21.0 23.5 13:52 37.1 35.1 29.1 Juazeiro (rural) 07:03 21.1 23.5 16:04 36.1 34.4 28.8
Table 3 - Air temperature: minimum (mean and absolute values and times of occurrence), maximum (mean and absolute values and times of occurrence) and overall average in the dry season.
Station
Air relative humidity (%)
Minimum Maximum Overall
Average Time Absolute Mean Time Absolute Mean
Mossoró (urban) 14:52 28.3 36.0 05:30 80.9 78.5 61.0 Mossoró (rural) 14:09 39.7 46.3 05:17 95.4 88.3 70.6 Serra Talhada (urban) 14:33 28.3 45.2 05:55 95.0 89.5 73.0 Serra Talhada (rural) 12:28 38.0 54.3 04:46 100.0 95.6 74.0 Petrolina (urban) 15:28 23.3 38.0 07:46 9.4 87.5 62.7 Petrolina (rural) 16:24 25.1 40.1 06:02 100.0 89.2 65.5 Juazeiro (urban) 15:12 26.2 41.5 07:35 97.1 85.8 64.6 Juazeiro (rural) 15:08 23.7 39.8 07:29 94.8 85.2 63.8
(RHx) was, on average, lower than 60.0% in all localities
surveyed. The absolute minimum-recorded value was 12.2% in urban Serra Talhada. In general, the mean values of the climatic variables were lower in the urban than in rural areas of all municipalities. In the Section 2.1 it is possible to evidence that these results are in agreement with the regional climatology.
3.3 Wind speed
a) Wet period
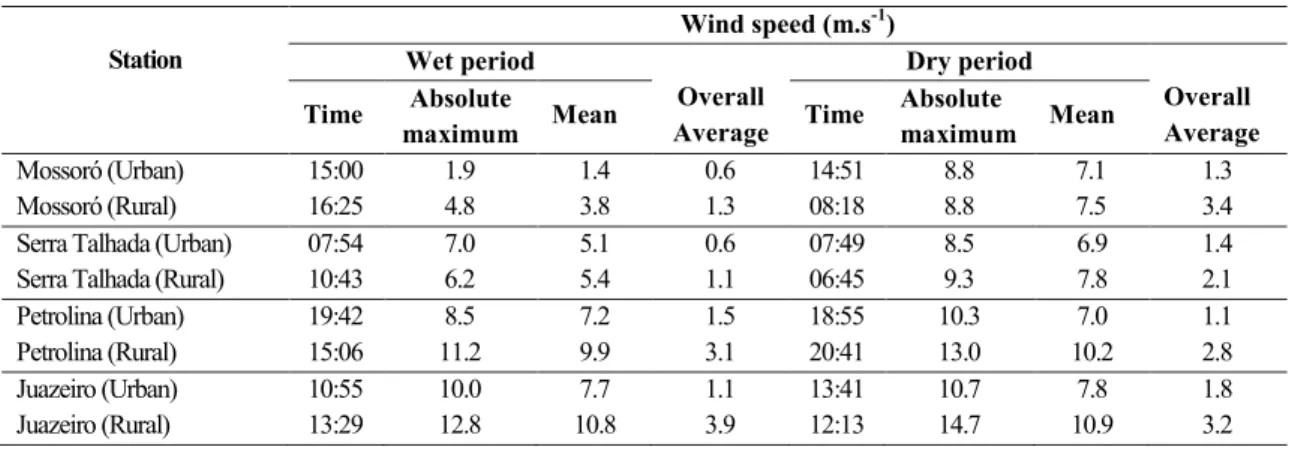
The wind speed is also an important attribute of climate ambience of the urban areas. In general, strong air movements represent a disadvantage in cold climates and effective in warm climates. In the Brazilian semiarid, warm days and calm wind causes quite sharp heat sensation. The wind is a meteorological variable which promotes urban climatic comfort, however, is the element most altered by urbanization (Grimmond, 2007; Runnals and Oke, 2000). The results obtained for this climatic variable are grouped and presented for each study period (Table 6).
For the wet period (Table 6), it was evidenced the occurrence of very weak winds in Mossoró, averaging 0.6
ms-1 in the urban area. Even in the rural area of the city, the average wind speed was relatively low (1.3 ms-1). In Serra Talhada, despite having the same average value of Mossoró (0.6 m.s-1) during the wet period, there were bursts of 7.0 ms-1 in the urban area. In the rural area of the city, the average wind speed was 1.1 ms-1, very similar to those presented in Mossoró, as well as, showed an absolute maximum value of 6.2 ms-1. The urban area of Petrolina city has shown an average of 1.5 m.s-1 with absolute maximum value of 8.5 m.s-1, while the rural area showed an average and absolute maximum values of 3.1 m.s-1 and 11.2 m.s-1, respectively. Similarly, the urban area of Juazeiro city presented an average of 1.1 ms-1 with absolute maximum value of 10.0 ms-1, and the rural area an average and absolute maximum value of 3.9 and 12.8 ms-1, respectively. These similar behaviors between Petrolina and Juazeiro can be explained by the proximity between the two cities, i.e., about 4 km of distance.
b) Dry period
Table 6 also shows the wind speed values for the dry period. It was observed that the average wind speed of urban area of Mossoró is 1.3 ms-1 and the absolute maximum value
Station
Wind speed (m.s-1) Wet period
Overall Average
Dry period
Overall Average
Time Absolute
maximum Mean Time
Absolute
maximum Mean
Mossoró (Urban) 15:00 1.9 1.4 0.6 14:51 8.8 7.1 1.3 Mossoró (Rural) 16:25 4.8 3.8 1.3 08:18 8.8 7.5 3.4 Serra Talhada (Urban) 07:54 7.0 5.1 0.6 07:49 8.5 6.9 1.4 Serra Talhada (Rural) 10:43 6.2 5.4 1.1 06:45 9.3 7.8 2.1 Petrolina (Urban) 19:42 8.5 7.2 1.5 18:55 10.3 7.0 1.1 Petrolina (Rural) 15:06 11.2 9.9 3.1 20:41 13.0 10.2 2.8 Juazeiro (Urban) 10:55 10.0 7.7 1.1 13:41 10.7 7.8 1.8 Juazeiro (Rural) 13:29 12.8 10.8 3.9 12:13 14.7 10.9 3.2
Table 6 - Wind speed wet and dry periods: (times of occurrence, absolute and mean values) and and overall averages.
Table 5 - Relative humidity: minimum and maximum (mean and absolute values and times of occurrence) and overall average in the dry season.
Station
Relative humidity (%)
Minimum Maximum Overall
Average Time Absolute Mean Time Absolute Mean
of 8.8 ms-1. In the rural area of the city, the average wind speed was higher than the urban area (3.4 ms-1) and same absolute maximum value. In Serra Talhada, the urban area has showed average wind speed of 1.4 m.s-1 and absolute maximum value of 8.5 m.s-1. In the rural area of the city, the average wind speed and absolute maximum values were 2.1 and 9.3 m.s-1, respectively. The urban area of Petrolina city has shown an average of 1.1 m.s-1 with absolute maximum value of 10.3 m.s-1, and the rural area an average and absolute maximum value of 2.8 m.s-1 and 13.0 m.s-1, respectively. The urban area of Juazeiro city presented an average of 1.8 m.s-1 with absolute maximum value of 10.7 m.s-1, and the rural area showed an average and absolute maximum value of 3.2 and 14.7 ms-1, respectively. It was observed again the similar wind speed behaviors between Petrolina and Juazeiro as discussed previously. It is possible to identify that in the dry period the urban area of Petrolina had the lowest average wind speed (1.1 m.s-1), while the rural area of Mossoró had the highest average (3.4 m.s-1). It is also evident that the rural area of all counties showed average wind speed above
the respective urban area, thus demonstrating the inluence
of urban structures on this variable. Thus, the morphology of cities in terms of height, width and density of buildings, affects, besides the standard heating, air movement at street level (Grimmond, 2007) and that the intensity of heat islands decreases with increase in wind speed and cloud cover (Runnals and Oke, 2000).
3.4 Evaluation of thermal comfort
a) Wet Period
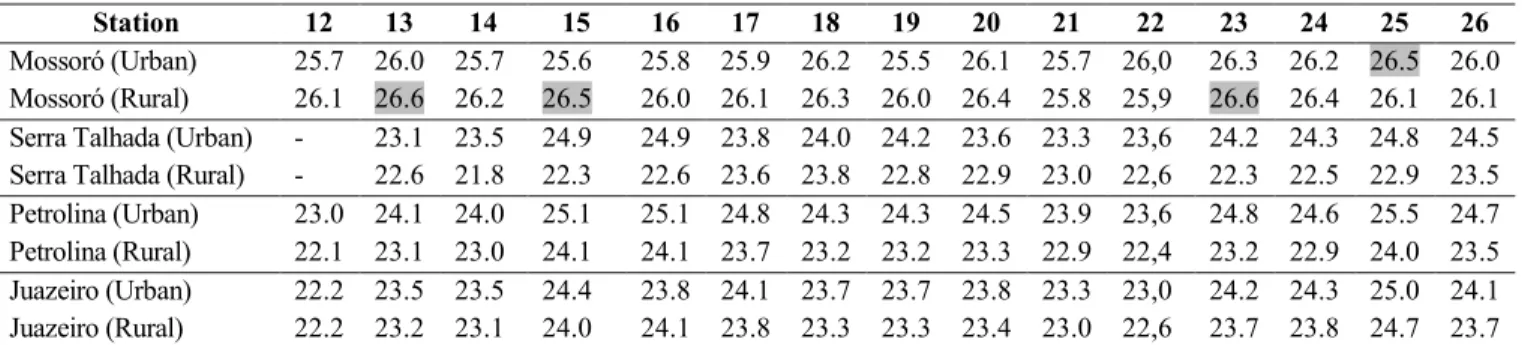
The results of thermal discomfort index (DIT) for the wet
period (Table 7) showed an uncomfortable condition (DIT ≥ 26.5
°C) in Mossoró on 13, 15 and 23/05/2008 (rural area) and on 25/05/2008 (urban area). These uncomfortable conditions were probably caused by the low wind speed occurred in that wet period (Table 6). The other results indicate a condition of partial
comfort (20.0 ≤ DIT ≤ 26.4 ºC) for all areas surveyed. The mean
values showed no thermal discomfort (15.0 ≤ DIT ≤ 19.9 ºC) on
any day of the period analyzed. It is also emphasized that the data in Table 7 are daily averages and serve only as indicative of thermal comfort/discomfort situations.
b) Dry period
In the dry period (Tables 8 and 9) there was a larger
partial comfort condition (20.0 ºC ≤ DIT ≤ 26.4 ºC) in all tested
areas. The mean values showed no thermal discomfort and/or comfort on any day of the period analyzed. It is also emphasized that the data in Tables 8 and 9 are daily averages and serve only as indicative of thermal comfort/thermal discomfort situations.
It also appears that there are few records of a situation of thermal discomfort. However, this situation stems from the fact that by adopting average values of temperature and relative
Station 12 13 14 15 16 17 18 19 20 21 22 23 24 25 26
Mossoró (Urban) 25.7 26.0 25.7 25.6 25.8 25.9 26.2 25.5 26.1 25.7 26,0 26.3 26.2 26.5 26.0
Mossoró (Rural) 26.1 26.6 26.2 26.5 26.0 26.1 26.3 26.0 26.4 25.8 25,9 26.6 26.4 26.1 26.1
Serra Talhada (Urban) - 23.1 23.5 24.9 24.9 23.8 24.0 24.2 23.6 23.3 23,6 24.2 24.3 24.8 24.5
Serra Talhada (Rural) - 22.6 21.8 22.3 22.6 23.6 23.8 22.8 22.9 23.0 22,6 22.3 22.5 22.9 23.5
Petrolina (Urban) 23.0 24.1 24.0 25.1 25.1 24.8 24.3 24.3 24.5 23.9 23,6 24.8 24.6 25.5 24.7
Petrolina (Rural) 22.1 23.1 23.0 24.1 24.1 23.7 23.2 23.2 23.3 22.9 22,4 23.2 22.9 24.0 23.5
Juazeiro (Urban) 22.2 23.5 23.5 24.4 23.8 24.1 23.7 23.7 23.8 23.3 23,0 24.2 24.3 25.0 24.1
Juazeiro (Rural) 22.2 23.2 23.1 24.0 24.1 23.8 23.3 23.3 23.4 23.0 22,6 23.7 23.8 24.7 23.7
Station 15 16 17 18 19 20 21 22 23 24 25 26 27 28 29 30
Mossoró (Urban) 24.6 25.6 25.7 25.7 25.7 25.7 25.5 25.5 25.7 25.6 25.9 26.2 26.1 25.6 25.8 26.3 Mossoró (Rural) 25.4 25.1 25.1 25.2 25.1 25.1 24.9 24.9 25.2 25.1 25.4 25.7 25.8 25.0 25.2 25.8 Serra Talhada (Urban) - 24.8 25.4 24.2 25.9 25.6 24.4 24.4 24.1 24.6 25.0 25.2 24.9 24.8 24.5 25.6 Serra Talhada (Rural) 24.6 25.2 25.7 25.2 25.3 25.5 25.2 24.2 24.8 25.0 25.6 25.1 25.3 24.3 24.8 25.6 Petrolina (Urban) 25.1 24.7 25.1 25.0 25.2 25.8 25.6 25.3 24.9 24.5 24.1 25.2 25.5 24.7 24.9 24.7 Petrolina (Rural) 24.4 24.0 24..2 24.1 24.4 25.2 25.1 24.7 24.5 24.1 23.5 24.6 25.1 24.1 24.3 24.3 Juazeiro (Urban) 24.7 24.9 23.9 25.0 25.1 25.9 25.4 25.2 24.8 24.5 24.2 25.1 25.4 24.8 25.0 24.6 Juazeiro (Rural) 24.9 24.4 24.7 24.6 24.9 25.6 25.3 25.0 24.6 24.3 24.0 24.9 25.2 24.6 24.6 24.5
Table 7 - Evaluation of thermal discomfort index (DIT) during the wet period (May, 2007). The highlighted values mean uncomfortable conditions.
Station 01 02 03 04 05
Mossoró (Urban) 26.3 26.0 25.8 25.6 26.2
Mossoró (Rural) 25.8 25.4 25.2 24.9 25.5
Serra Talhada (Urban) 25.8 25.0 24.1 25.7 25.5
Serra Talhada (Rural) 25.9 25.9 24.9 26.3 26.1
Petrolina (Urban) 25.9 25.3 24.0 24.8 25.4
Petrolina (Rural) 25.4 24.8 23.6 22.7 24.9
Juazeiro (Urban) 25.9 25.3 24.1 23.1 25.5
Juazeiro (Rural) 25.7 25.1 23.9 23.1 25.3
Table 9 - Evaluation of thermal discomfort index (DIT) during the dry period (December, 2008).
humidity in the calculation of the DIT with Thom’s equation in
its original form. It is possible to minimize the real inluence of these variables on the classiication of the condition of thermal
comfort (Tables 8 and 9). Accordingly, it is proposed to use the related minimum values of maximum temperature and minimum humidity or maximum temperature and maximum humidity for determining the parameters derived from thermal discomfort index proposed by Thom, called (DIT)x or (DIT)m,
respectively. Cities that have not consolidated the urbanization process use to monitor its urban development to prevent the formation of heat islands, promote thermal comfort and improve life quality. This can occur during the environmental licensing of urban allotments and areas of public interest aimed at the implementation of housing programs, with a greater accuracy in
choosing the type of looring to be used in the paving of roads
(Bezerra et al., 2013 ).
4. CONCLUSIONS
The results of the evaluation of the thermal conditions in urban areas of the Brazilian semiarid region, from data obtained from automatic weather stations installed in wet and dry periods in the municipalities of Mossoró-RN, Serra Talhada and Petrolina-PE and Juazeiro-BA, allow us to formulate the following conclusions:
1) It was shown that naturally there are adverse climatic conditions in the semiarid region, which is potentiated by the constructive elements of the urban spaces, contributing for thermal discomfort of the population;
2) By applying Thom’s equation for obtaining the thermal discomfort index (DIT), it was observed that the urban
areas reported thermal comfort conditions always inferior to those of the rural area;
3) On the average, thermal discomfort conditions
(15.0 ºC ≤ DIT ≤ 19.9 °C) were observed for some days of the
period analyzed. However, the incidence of thermal discomfort related to minimum, average and maximum temperatures, probably associated to the process of planning occupation of
their urban space, which have never considered the climatic aspects;
4) Therefore, it can be stated that the Brazilian semiarid
region has a speciic urban climate, which is inluenced by the
design characteristics of the urban structure and buildings. This association contributes to the formation of urban heat islands and population thermal discomfort. In addition, the afforestation is an effective mechanism of mitigating the adverse effects of these structures with better life quality of the population.
5. REFERENCES
AKBARI, H.; POMERANTZ, M.; TAHA, H. Cool surfaces and shade trees to reduce energy use and improve air quality in urban areas. Solar Energy: v. 70, n. 3, p.
295–310, 2001.
ALEXANDRIA, E.; JONESB, P. Temperature decreases in an urban canyon due to green walls and green roofs in diverse climates. Building and Environments: n. 43, p. 480–493,
2008.
ARMELIN, H. S.; CHERRY, N. Avaliação do uso e desempenho de barreiras de radiação térmica na construção civil. Revista de Ciência e Tecnologia de Materiais de Construção Civil: v. 1, n. 1, p. 79-82, 2004.
AZEVEDO, T. R.; TARIFA, J.R. O ritmo semanal das atividades humanas e o clima da região metropolitana de São Paulo. Laboratório de Climatologia e Biogeograia. Departamento de Geograia, Faculdade de Filosoia, Letras
e Ciências Humanas, Universidade de São Paulo, Série TA
– Texto 008, 2001.
BARBOSA, R. V. R.; BARBIRATO, G. M.; VECCHIA, F. A. S. Vegetação urbana: análise experimental em cidade de clima quente e úmido. ENCAC-COTEDI. Curitiba-PR, Brasil, 5-7 de novembro de 2003.
BEZERRA, P. T. C. A Inluência da urbanização no clima
BEZERRA, P. T. C.; LEITÃO, M. M. V. B. R.; AZEVEDO, P. V. Ilhas de Calor e Desconforto Térmico no Semiárido Brasileiro: Um Estudo de Caso na cidade de Petrolina-PE.
Revista Brasileira de Geograia Física: v. 6, n. 3, p. 427-441, 2013.
BLAZEJCZYK, K.; EPSTEIN, Y.; JENDRITZKY, G.; STAIGER, H.; TINZ, B. Comparison of UTCI to selected thermal indices. International Journal of Biometeorology,
v.56, p.515–535, 2012.
BURIAN, S. J.; SHEPHERD, J. M. Effect of urbanization on the diurnal rainfall pattern in Houston. Hydrological Processes,
v.19, p.1089–1103, 2005.
COLTRI, P. P.; VELASCO, G. D. N.; POLIZEL, J. L.; DEMETRIO, V. A.; FERREIRA, N. J. Ilhas de calor da estação de inverno da área urbana do município de Piracicaba/SP.XIII Simpósio de Sensoriamento Remoto, Florianópolis/SC... Anais: p. 5151-5157, 2007.
CORBELLA, O.; YANNAS, S. Em busca de uma arquitetura sustentável para os trópicos. Rio de Janeiro: Revan, 2003. GOLDREICH, Y. Urban climate studies in Israel - A review.
Atmospheric Environment, v.29, p.467–478, 1995.
GRIMMOND, C.S.B.; ROTH, M.; OKE, T.R.; AU, Y.C.; BEST, M.; BETTS, R.; CARMICHAEL, G.; CLEUGH, H.; DABBERDT, W.; EMMANUEL, R.; FREITAS, E.; FORTUNIAK, K.; HANNA, S.; KLEIN, P.; KALKSTEIN, L.S.; LIU, C.H.; NICKSON, A.; PEARLMUTTER, D.; SAILOR, D. ; VOOGT, J. Climate and More Sustainable Cities: Climate Information for Improved Planning and Management of Cities (Producers/Capabilities Perspective).
Procedia Environmental Sciences: v. 1, p. 247–274, 2010.
GRIMMOND, S. Urbanization and global environmental change: local effects of urban warming. The Geographical Journal:v. 173, p. 83-88, 2007.
ICHINOSE, T.; SHIMODOZONO, K.; HANAKI, K. Impact of anthropogenic heat on urban climate in Tokyo. Atmospheric Environment, v.33, p.3897–3909, 1999.
JOHANSSON, E. Inluence of urban geometry on outdoor
thermal comfort in a hot dry climate: A study in Fez, Morocco. Building and Environment: v. 41, p. 1326–1338, 2006.
KALNAY, E.; CAI, M. Impact of urbanization and land-use change on climate. Nature: v. 432, n. 6939, p. 528-531, 2003.
KITHIIA, J.; DOWLING, R. An integrated city-level planning process to address the impacts of climate change in Kenya: The case of Mombasa. Cities: v. 27, p. 466–475, 2010.
KWOK, A.G. ; CHUN, C. Thermal comfort in Japanese schools.
Solar Energy: v.74, p. 245-252, 2003.
LAMBERTS, R. Conforto térmico e stress térmico. Laboratório de Eficiência Energética em Edificações.
Florianópolis – SC, 2014. Disponível em: < http://www.
labeee.ufsc.br/sites/default/iles/disciplinas/Conforto%20
T%C3%A9rmico%202014_Com%20norma.pdf >. Acesso em 22/09/2015.
MILLS; G., CLEUGH,H.; EMMANUEL,R.; ENDLICHER,W.; ERELL,E.; MCGRANAHAN, G.; NG,E.; NICKSON,A.; ROSENTHAL, J.; STEEMER, K. Climate Information for Improved Planning and Management of Mega Cities (Needs Perspective). Procedia Environmental Sciences: v. 1, p.
228–246, 2010.
MONTEIRO, C.A.F.; MENDONÇA, F. (Org.). Clima urbano. São Paulo: Contexto, 2003.
NICOL, J.F.; HUMPHREYS, M.A. Adaptative thermal comfort and sustainable thermal standards for buildings. Energy and building: v. 34, p. 563-572, 2002.
MONTEIRO, L.; ALUCCI, M. Procedimentos para
quantiicação de variáveis para análise termoisiológica.
In: ENCONTRO NACIONAL DE CONFORTO NO AMBIENTE CONSTRUÍDO, 8.; ENCONTRO LATINO-AMERICANO DE CONFORTO NO AMBIENTE CONSTRUÍDO, 6., Maceió, 2005. Anais... Maceió: ANTAC, 2005.
OKE, T. R. Canyon geometry and the nocturnal urban heat
island: Comparison of scale model and ield observations. Journal of Climatology: v. 1, n. 3, p. 237–254, 1991.
OKE, T.R; ZEUNER, G.; JÁUREGUI, E. The Surface Energy Balance in Mexico City. Atmospheric Environments: v. 26B, n. 4, p. 433 - 444, 1992.
PEREZ, J.C; SÁNCHEZ, M.A.V.; BARRADAS, V.L. Clima, urbanización y uso del suelo en ciudades tropicales de Mexico. Ciudades, v. 51, p. 19-24, 2001.
PRADO, R.T.A.; FERREIRA, F.L. Measurement of albedo
and analysis of its inluence the surface temperature of
building roof materials. Energy and Building: v. 37, p. 295-300, 2005.
RUNNALS, K.E., OKE, T.R. Dynamics and control of the near-surface heat Island of Vancouver, British Columbia.
Physical Geography: v. 21, n. 4, p. 283–304, 2000.
SARRAT, C.; LEMONSU, A.; MASSON, V.; GUEDALIA, D. Impact of urban heat island on regional atmospheric pollution. Atmospheric Environment, v.40, p.1743–1758, 2006.
SILVA DIAS, M. A. F.; SILVA DIAS, P. L. As incertezas regionais nos cenários de mudanças climáticas globais.
Boletim da Sociedade Brasileira de Meteorologia: v. 31, p. 12-17, 2007.
SOUZA JÚNIOR, I. F. A inluência da urbanização no clima
da cidade de Campina Grande-PB. Dissertação (Mestrado em Meteorologia). Universidade Federal de Campina Grande, Unidade Acadêmica de Ciências Atmosféricas, Campina Grande, 2006, 86p.
STATHOPOULOS, T.; WU, H.; ZACHARIAS, J. Outdoor human comfort in an urban climate. Building and Environment, v.39, p.297–305, 2004.
VIANA, S.S.M.; AMORIM, M.C.C.T. Caracterização do clima urbano em Teodoro Sampaio-SP: uma introdução.