www.nat-hazards-earth-syst-sci.net/14/1371/2014/ doi:10.5194/nhess-14-1371-2014
© Author(s) 2014. CC Attribution 3.0 License.
Temporal variations in the wind and wave climate at a location in
the eastern Arabian Sea based on ERA-Interim reanalysis data
P. R. Shanas and V. Sanil Kumar
Ocean Engineering, CSIR – National Institute of Oceanography (Council of Scientific & Industrial Research), Dona Paula, Goa 403 004, India
Correspondence to:V. Sanil Kumar ([email protected])
Received: 30 October 2013 – Published in Nat. Hazards Earth Syst. Sci. Discuss.: 6 December 2013 Revised: 27 March 2014 – Accepted: 16 April 2014 – Published: 28 May 2014
Abstract. Temporal variations in wind speed and signifi-cant wave height (SWH) at a location in the eastern Ara-bian Sea are studied using ERA-Interim reanalysis data from 1979 to 2012. A shallow water location is selected for the study since measured buoy data are available close to the lo-cation for comparison with the reanalysis data. The annual mean wind speed shows a statistically significant decreasing trend of 1.5 cm s−1year−1, whereas a statistically
insignif-icant increasing trend of 3.6 cm s−1year−1 is observed for
annual maximum wind speed due to the local events that al-tered the trend in annual maximum wind speed. Weakening of SWH during one of the peak monsoon months (August) is identified from the monthly analysis of SWH, which shows a higher upward trend in SWH during the southwest mon-soon period, with an exception during August. The annual mean SWH shows a slight upward trend (0.012 cm year−1),
whereas a larger upward trend (1.4 cm year−1)is observed
for annual maximum SWH. Both identified trends are statis-tically insignificant. The influence of tropical cyclone activ-ity is also studied and it is found that the maximum SWH and wind speed during 1996 are directly related to the cyclonic event.
1 Introduction
Knowledge of the wind and wave climate is required for en-gineering design (e.g., ships and offshore platforms) and the shipping industry (Krogstad and Barstow, 1999; Tucker and Pitt, 2001). Wind and wave climate is assessed based on the data obtained through (i) in situ measurement, (ii) a model data set, (iii) a satellite altimeter and (iv) voluntary observing
ship (VOS) data. Understanding the long-term variations in the wind and wave parameter is a key element in contempo-rary physical oceanography and coastal science. Long-term wind and wave records based on in situ measurements are still sparse in the Arabian Sea (AS), and only short-term records are available (Premkumar et al., 2000; Kumar, 2006; Sajiv et al., 2012; Glejin et al., 2013). A comprehensive un-derstanding of the properties of the approaching waves and their potential changes is the major knowledge necessary for sustainable management of both offshore activities and the coastal region (Soomere and Räämet, 2011). Generally sig-nificant wave height (SWH) is used to study the wave cli-mate at a location. Globally there have been many studies on the change in wave climate, especially in the North Pa-cific and North Atlantic regions (Carter and Draper, 1988; Allan and Komar, 2000; Caires and Swail, 2004; Gulev and Grigorieva, 2004; Soomere and Räämet, 2011; Vanem and Walker, 2013). Kumar and Sajiv (2010) carried out a study on variations in long-term wind speed estimates considering different decades in the AS and reported that extreme wind speed has an annual decreasing trend of 1.3 cm s−1.
As a part of the global study, Caires and Swail (2004) examined the long-term trend in SWH in the AS based on VOS data, but the long-term changes and decadal variation in wave climate in the eastern AS are not known at present. Since no regionalized study has been done on the tempo-ral variations of SWH in the eastern AS, a study is carried out using the ERA-Interim re-analysis data set. The objec-tive of the study is to quantify the monthly, inter-annual and decadal variability of the wind and wave climate at a location off Honnavar in the eastern AS. The analysis is based on the wind speed and SWH data obtained from ECMWF reanalysis
Figure 1.Study area along with location of extracted model data set and buoy.
ERA-Interim data for 34 years (1979–2012). A shallow wa-ter location (14.25◦N, 74.25◦E) in the eastern AS is selected
for the study since measured buoy data are available close to this location for comparison of the ERA-Interim SWH data. Figure 1 shows the buoy location and reanalysis data extrac-tion locaextrac-tion.
2 Data and methodology
The Indian Ocean exhibits a number of modes of cli-mate variability, ranging from intra-seasonal to inter-annual and longer timescales, most of which are coupled to the strong seasonal cycle (Schott et al., 2009). The surface waves in the North Indian Ocean mainly depend on the wind conditions prevailing over the three different seasons, viz. southwest (SW) monsoon or summer monsoon (June– September), northeast (NE) monsoon or post-monsoon (October–January) and pre-monsoon or fair weather period (February–May) (Glejin et al., 2012). Generally high wave activity is observed during the southwest monsoon season, and is relatively calm during the rest of the season (Kumar et al., 2006).
2.1 ERA-Interim reanalysis data
The present study is based on the ERA-Interim global at-mospheric reanalysis data that are produced by the Euro-pean Center for Medium-Range Weather Forecasts (Berris-ford et al., 2009; Dee et al., 2011). ERA-Interim is the first re-analysis using adaptive and fully automated bias correc-tions of satellite radiance observacorrec-tions (Dee and Uppala, 2008) and contains improvements to ERA-40 such as the
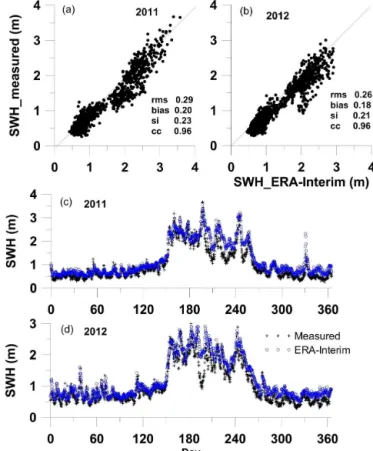
Figure 2. (a)Scatter plot showing the comparison of significant wave height based on ERA-Interim and the measured buoy data
dur-ing 2011 and(b)during 2012;(c)time series plot of the significant
wave height based on ERA-Interim and the measured data during
2011 and(d)during 2012.
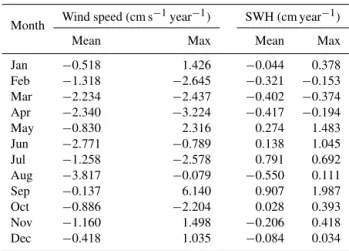
Table 1.Trend in wind speed and significant wave height (SWH) from 1979 to 2012 in different months.
Month Wind speed (cm s−
1year−1) SWH (cm year−1)
Mean Max Mean Max
Jan −0.518 1.426 −0.044 0.378 Feb −1.318 −2.645 −0.321 −0.153 Mar −2.234 −2.437 −0.402 −0.374 Apr −2.340 −3.224 −0.417 −0.194 May −0.830 2.316 0.274 1.483 Jun −2.771 −0.789 0.138 1.045 Jul −1.258 −2.578 0.791 0.692 Aug −3.817 −0.079 −0.550 0.111 Sep −0.137 6.140 0.907 1.987 Oct −0.886 −2.204 0.028 0.393 Nov −1.160 1.498 −0.206 0.418 Dec −0.418 1.035 −0.084 0.034
2.2 Buoy data
Measured wave data at 9 m water depth (14.304◦N,
74.391◦E) off Honnavar (Fig. 1) using a moored directional
wave rider buoy from January 2011 to December 2012 are used in the present study for comparison of the ERA-Interim SWH data. The directional waverider buoy is a spherical case of 0.9 m diameter containing three accelerometers oriented orthogonally in one vertical direction and two horizontal di-rections. The vertical and horizontal (eastward and north-ward) displacements are obtained by double integration of the respective acceleration signal without applying a filter. The displacement data are recorded continuously at 1.28 Hz and the data for every 30 min are processed as one record. At every 200 s, a total number of 256 heave samples are collected and a fast Fourier transform (FFT) is applied to obtain a periodogram in a frequency range of 0 to 0.58 Hz with a frequency resolution of 0.005 Hz. The periodogram is smoothed using a Hanning window with 25 % overlap and the spectrum is obtained. Eight consecutive spectra cover-ing 1600 s are averaged and used to compute the half-hourly wave spectrum (Kumar et al., 2014). Significant wave height (SWH), which equals 4√m0, and mean wave period (T m02), which equalsqm0
m2, are obtained from the spectral moments.
Here mn is the nth order spectral moment and is given as mn=R0∞fnS(f )df,n=0 and 2, andS(f )is the spectral energy density at frequencyf.
2.3 Comparison of reanalysis data with measured data Extensive inter-comparison and evaluation of wind stress es-timates from the reanalysis data set (ERA-Interim) against available in situ observations have been performed for the tropical Indian Ocean (Praveen et al., 2013). Evaluation of the data is based on the comparison with available observa-tions from the global tropical moored buoy array (McPhaden et al., 1998) and OceanSITES (http://www.OceanSITES.org,
2009) data with observations and shows that ERA-Interim data captures temporal variability with better performance (∼0.86 correlation) in near-surface parameters (wind, air surface temperature, humidity, etc.) with respect to other re-analysis data like NCEP (Kalnay et al., 1996) and NCEP-DOE Reanalysis 2 (Kanamitsu et al., 2002). For the present study, the nearest available ERA-Interim SWH data to the measured in situ buoy data at Honnavar during 2011 and 2012 are used for the comparison. The comparison between the reanalysis and measured SWH data shows a very high correlation (correlation coefficient=0.96) with a small RMS error (0.27 m) during both years. The scattering index (SI) value is 0.23, with a positive bias of 0.2 m during 2011, whereas a slightly reduced SI and bias are observed during 2012 (Fig. 2).
3 Results and discussions
3.1 Variation in wind speed from 1979 to 2012
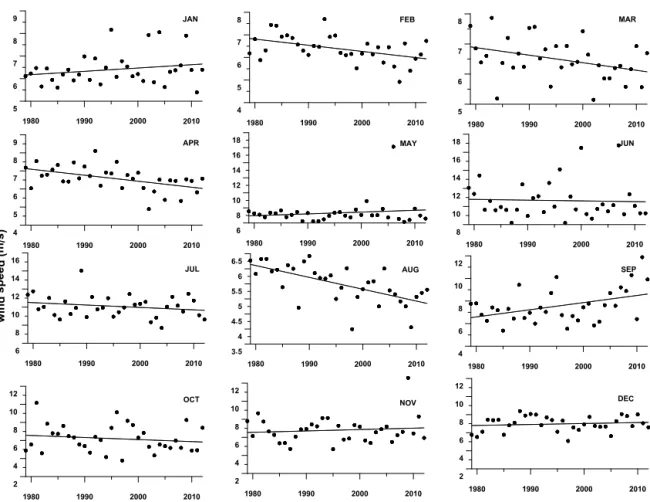
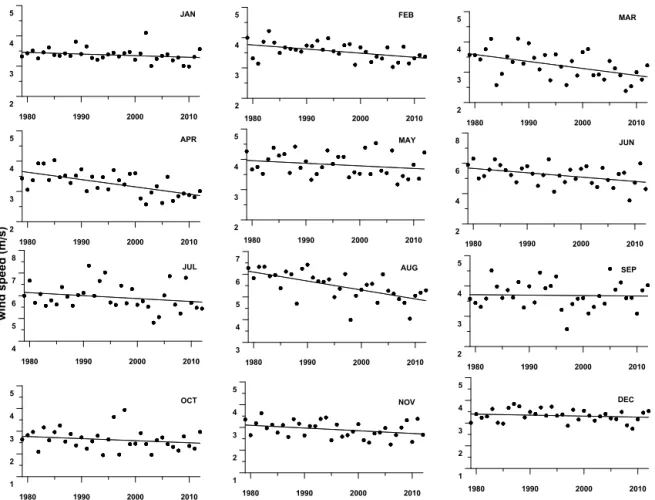
Temporal variation in monthly maximum and mean wind speed is plotted for 34 years (Figs. 3 and 4). Monthly max-imum wind speed shows a decreasing trend from February to April, June to August and in October (Table 1). Other months show an upward trend in monthly maximum wind speed. The monthly mean wind speed shows a decreasing trend in all months, with higher values during the peak south-west monsoon season (June and August). Even though a higher decreasing trend (∼4 cm s−1year−1)of mean wind
speed is observed during August, the decreasing trend is less (0.079 cm s−1year−1)for maximum wind speed (Table 1).
The highest upward trend in maximum wind speed is ob-served during September (6.14 cm s−1year−1).
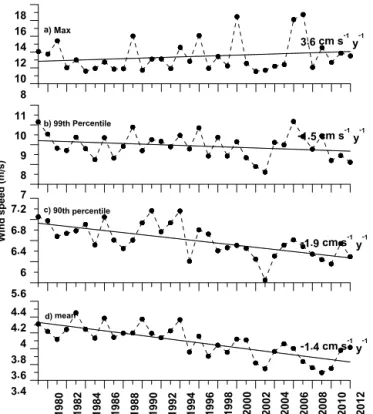
An upward trend (3.6 cm s−1year−1) is observed for
annual maximum wind speed and a decreasing trend (1.5 cm s−1year−1)is observed for annual mean wind speed
(Fig. 5). The opposite trends observed for annual maxi-mum and mean wind speed are due to the fact that indi-vidual local events would drive the trends of annual max-ima. These individual events can alter the trend significantly. The annual maximum and mean wind speed from 1979 to 2005 has decreasing trends of 1.4 and 0.8 cm s−1year −1,
respectively. The overall negative trend in maximum wind speeds is shifted to positive by individual events in 2006 and 2007. During June 2006, high wind speed is observed with the onset of the southwest monsoon (Sanil Kumar et al., 2010). High wind speed observed in June 2007 is due to the remnant of a deep depression that developed over the western central Bay of Bengal (BoB) on 21 June and moved west-northwestwards across southern India on 22– 23 June, emerging in the northeastern AS as a well-marked low-pressure area on 24 June. Hence we have estimated the 90th and 99th percentile winds, which still provide enough data points for stronger winds (which drive most of the wave
1980 1990 2000 2010 5
6 7 8
9 JAN
1980 1990 2000 2010 4
5 6 7
8 FEB
1980 1990 2000 2010 4
5 6 7 8
9 APR
1980 1990 2000 2010 6
8 10 12 14 16
18 MAY
1980 1990 2000 2010 6
8 10 12 14 16
w
in
d
s
p
e
ed ( m/s
)
JUL
1980 1990 2000 2010 3.5
4 4.5 5 5.5 6 6.5
AUG
1980 1990 2000 2010
ear
2 4 6 8 10 12
NOV
1980 1990 2000 2010 2
4 6 8 10 12
1980 1990 2000 2010 2
4 6 8 10 12
1980 1990 2000 2010 5
6 7
8 MAR
1980 1990 2000 2010 8
10 12 14 16
18 JUN
1980 1990 2000 2010 4
6 8 10 12
SEP
OCT DEC
Figure 3.Temporal variation in the monthly maximum wind speed from 1979 to 2012.
action) to carry out a relevant statistical analysis. The 90th and 99th percentile values show decreasing trends (1.9 and 1.6 cm s−1year−1)similar to the trend of annual mean wind
speed (1.5 cm s−1year−1).
Statistical analysis of wind speed frequency is performed by classifying wind speed into different ranges through decadal periods from (i) 1980 to 1989, (ii) 1990 to 1999 and (iii) 2000 to 2009 (Table 2). The study shows a decreasing trend in the frequency of occurrence of stronger winds. The weakening of strong winds is also consistent with the de-creasing trend of monthly mean wind speed over 34 years.
A study on long-term variation of wind speed by Kumar and Sajiv (2010) along the AS considering different decades reported that extreme wind speed has an annual decreasing trend of 1.3 cm s−1. Some other studies also indicated a
de-clining trend of wind speed in the last decade around the globe (Jiang et al., 2010). The decrease in the frequency of the occurrence of stronger winds (90th and 99th percentiles) in the present study also supports the hypothesis that the cy-clonic activity in the AS is decreasing. Based on 118 year pe-riod data of cyclonic disturbances including cyclonic storms in AS, Shyamala and Iyer (1996) examined the decadal vari-ability and found that the maximum number of cyclonic storms in AS occurred during the decade 1901–1910 (15),
followed by 1961–1970 (14), 1971–1980 (13), 1981–1990 (3) and 1991–2000 (7). The decade 1981–1990 had the low-est frequency (3) of cyclonic storms and severe cyclonic storms. These are statistically significant decadal variabili-ties with a decreasing tendency in decadal frequency of cy-clonic storms in AS for the three decades from 1971 to 2000. Srivastava et al. (2000) studied trends in annual cyclonic dis-turbances for the period 1891–1997 over the BoB and the AS and found that there is a significant decreasing trend in the annual frequency of storms over both the basins, and that the slopes of the decreasing trend are maximal during the last four decades. Singh (2001) examined the long-term trend in the frequencies of cyclonic disturbances (depression) and the cyclonic storms forming over the BoB and the AS in the monsoon season and found that the frequency of cyclonic disturbances has decreased at a rate of about six to seven dis-turbances per hundred years, whereas the frequency of cy-clonic storms has decreased at a rate of about one to two cyclonic storms per hundred years.
3.2 Variation in significant wave height from 1979 to 2012
1980 1990 2000 2010 2
3 4
5 JAN
1980 1990 2000 2010 2
3 4
5 FEB
1980 1990 2000 2010 2
3 4
5 APR
1980 1990 2000 2010 2
3 4
5 MAY
1980 1990 2000 2010 4
5 6 7 8
w
in
d
sp
e
e
d
(m
/s
)
JUL
1980 1990 2000 2010 3
4 5 6 7
AUG
1980 1990 2000 2010
ear
1 2 3 4 5
NOV
1980 1990 2000 2010 1
2 3 4 5
1980 1990 2000 2010 1
2 3 4 5
1980 1990 2000 2010 2
3 4
5 MAR
1980 1990 2000 2010 2
4 6
8 JUN
1980 1990 2000 2010 2
3 4 5
SEP
OCT DEC
Figure 4.Temporal variation in monthly mean wind speed from 1979 to 2012.
Table 2. Frequency of occurrence of wind speed in different decades.
Wind speed range 1980–1989 1990–1999 2000–2009 (m s−1) Frequency (%) Frequency (%) Frequency (%)
0–3 30.89 34.40 38.68
3–6 54.55 51.15 49.96
6–9 13.61 13.43 10.46
9–12 0.90 0.98 0.84
>12 0.05 0.05 0.05
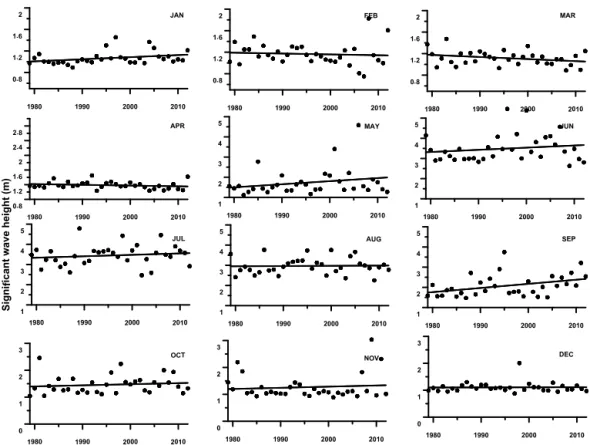
observed during the southwest monsoon months are in line with the observation of monsoon wind speed and the ear-lier studies on waves in AS (Kumar et al., 2000, 2003, 2012; Sajiv et al., 2012; Glejin et al., 2013). The monthly mean SWH shows decreasing trends in August and from Novem-ber to April, whereas during other months an upward trend is found (Table 1). The southwest monsoon period showed a higher upward trend in mean SWH, with an exception during August, and a maximum upward trend is observed during September (0.9 cm year−1). The significant weaken-ing of strong winds durweaken-ing August also reflects the cause of weakening of mean SWH, whereas the monthly maximum
SWH shows an upward trend for most of the months except from February to April. The decreasing trend from February to April is observed in the range 0.15–0.37 cm year−1.
Dur-ing the southwest monsoon season, the monthly maximum SWH showed a higher upward trend, with a maximum dur-ing September (1.9 cm year−1)similar to the mean SWH.
The annual mean SWH shows a slight upward trend, with an increase of 0.012 cm year−1, whereas an increasing trend
of 1.4 cm year−1 is observed for annual maximum SWH
(Fig. 8), but both trends are found to be statistically insignif-icant. The trend in annual maximum SWH depends on in-dividual events, and hence the 90th and 99th percentile ues of SWH are estimated. The 90th and 99th percentile val-ues of SWH increased by 0.15 and 0.76 cm year−1,
respec-tively (Fig. 8). The increase in the annual mean is much lower than the 90th and 99th percentile and annual maximum val-ues, suggesting larger positive trends for higher waves. The higher rate of increase for the 99th and annual maximum SWH indicates that extremes are increasing at a faster rate than the mean. Since the annual mean, maximum and the 90th and 99th percentile SWH have the increasing trend, the study shows that the SWH has an increasing trend at the lo-cation studied.
8 10 12 14 16 18 7 8 9 10 11 5.6 6 6.4 6.8 7.2 W in d sp e e d ( m/s ) 19 8 0 1 9 8 2 1 9 8 4 19 8 6 1 9 8 8 1 9 9 0 1 9 9 2 1 9 9 4 1 9 9 6 1 9 9 8 20 0 0 2 0 0 2 2 0 0 4 2 0 0 6 2 0 0 8 2 0 1 0 2 0 1 2 3.4 3.6 3.8 4 4.2 4.4 a) Max
b) 99th Percentile
c) 90th percentile
d) mean
3.6 cm s-1 y-1
-1.5 cm s-1 y-1
-1.9 cm s-1 y-1
-1.4 cm s-1 y-1
Figure 5.Long-term trend in annual(a)maximum,(b)99th
per-centile,(c)90th percentile and(d)mean wind speed from 1979 to
2012.
Similar results of increasing trends in SWH can be ob-served in the study of Hemer et al. (2010) for the In-dian Ocean sector of the Southern Ocean. Gulev and Grig-orieva (2004) studied over 100 years of ship observations and reported a slightly increasing trend in the mean wave height of 0.14 m decade−1for the North Atlantic and 0.08–
0.1 m decade−1for the North Pacific. Neu (1984) and Bouws
et al. (1996) analyzed synoptic charts issued by the Meteo-rological and Oceanographic Center (Canada) for the North Atlantic and largely based on ship observations. They found a trend in mean wave height of 0.23 m decade−1(1970–1982), whereas Neu (1984) reported larger values between 0.6 and 1.4 m decade−1 (1960–1985). More recent studies of buoy
data in the North Pacific have shown increasing trends in av-erage SWH between 0.05 and 0.27 m decade−1 from 1979
to 1999 (Allan and Komar, 2000) and 0.15 m decade−1for
the period 1976–2007 (Ruggiero et al., 2010; Young et al., 2011).
The present study shows that at the study location, the mean, 90th and 99th percentile wind speeds have a decreas-ing trend, whereas the corresponddecreas-ing SWH have an increas-ing trend. This contrastincreas-ing result is due to the fact that waves in the eastern Arabian Sea are mainly the swells propagating from the southern Indian Ocean and Southern Ocean (Glejin et al., 2013; Sajiv et al., 2012) and hence are not directly re-lated to the local phenomenon. Hemer et al. (2013) reported that increased Southern Ocean wave activity influences a
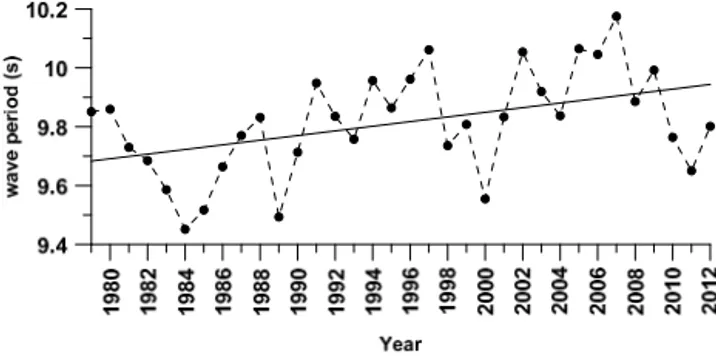
larger proportion of the global ocean as swell propagates northwards into the other ocean basins (Hemer et al., 2013). The increase in swells at the study location is also evident from the increase in the wave period (Fig. 9). The increase in swells at the study location is due to the increase in wind speed over the Southern Ocean during the past 20 years as observed by Young et al. (2011).
3.3 Intensity of wind speed and wave height during the peak events in AS
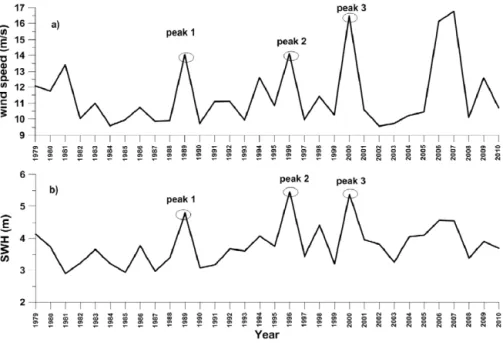
Stronger storm events like cyclones produce higher waves in the region. Gray (1985) found that the northern Indian Ocean accounts for 7 % of global tropical cyclones. Occur-rences of tropical cyclones are more in the BoB than in the AS, and the ratio of their frequencies is about 4:1 (Dube et al., 1997). From 1979 to 2008 there was an average of 4.7 cyclonic storm days per year over the AS, with 1981, 1990, 1991, 2000, 2005, and 2008 having 0 storms, and 1998 and 2004 having more than 15 cyclonic storm days (Evan and Camargo, 2011). Hence, to examine the influence of these cyclonic events on the waves, the extreme SWH dur-ing the study period is analyzed. From 1979 to 2012 there were three peak events with SWH more than 4.5 m: peak1 in 1989, peak2 in 1996 and peak3 in 2000 (Fig. 10). During 1989, 1996 and 2000, the occurrence of cyclones is observed along the west coast of India. During 1989, tropical cyclone 02A developed off the west coast of India from 7 to 13 June, with a wind speed of up to 15.3 m s−1, but the peak1 is on
23 July and is not due to the cyclone period (7–13 June). In 1996, a tropical depression formed in the AS from 9 to 12 June and developed into a tropical storm on 17 June off the west coast off India. This severe cyclonic storm from 17 to 20 June had a peak intensity of 30.6 m s−1and generated
the peak2 event. During 2000, a depression formed at BoB on 26 November and intensified into a storm and crossed the In-dian sub-continent, but the peak3 is on 7 June and not during the cyclone period (26–30 November). Simon et al. (2001) found an increase in wind speed over the AS off the Kar-nataka coast on 6–7 June based on the multi-frequency mi-crowave radiometer study. The increase in the local wind speed on 6 and 7 June is the reason for the unusual increase in SWH during the peak3 event.
3.4 Statistical trend analysis for the time series data A statistical analysis of the ERA-Interim wave and wind time series data has been performed to test the significance of trends during the 34-year period. A Student’sttest andztest have been used to assess the probability distribution with
N−2 degrees of freedom with a level of significance (α)
1980 1990 2000 2010 0.8
1.2 1.6
2 JAN
1980 1990 2000 2010
0.8 1.2 1.6
2 FEB
1980 1990 2000 2010
0.8 1.2 1.6 2 2.4
2.8 APR
1980 1990 2000 2010
1 2 3 4
5 MAY
1980 1990 2000 2010
1 2 3 4 5
S
i
i
i
t
h
i
h
t
g
g
n
n
w
v
m
f
c
a
a
e
e
(
)
JUL
1980 1990 2000 2010
1 2 3 4 5
AUG
1980 1990 2000 2010
Year
0 1 2 3
NOV
1980 1990 2000 2010
0 1 2 3
1980 1990 2000 2010
0 1 2 3
1980 1990 2000 2010
0.8 1.2 1.6
2 MAR
1980 1990 2000 2010
1 2 3 4
5 JUN
1980 1990 2000 2010
1 2 3 4 5
SEP
OCT DEC
Figure 6.Temporal variation in monthly maximum significant wave height from 1979 to 2012.
Figure 7.Temporal variation in monthly mean significant wave height from 1979 to 2012.
Figure 8.Long-term trend in annual(a)maximum,(b)99th
per-centile, (c)90th percentile and (d)mean significant wave height
from 1979 to 2012.
ztest lower than the significance levelα=0.05, one should reject the null hypothesis H0, and accept the alternative hy-pothesis Ha (where H0, the difference between the means, is equal to 0, and Ha, the difference between the means, is different from 0). It simply means that there exists a trend with a slope in these time series and that these trends are es-timated using simple linear regression. Hence the statistical significance of the identified trends has to be evaluated.
There are several statistical non-parametric tests available for testing the time series data (Hirsch et al., 1993). The main advantages of the non-parametric procedures over paramet-ric alternatives are that the procedures can be used without making too many assumptions about the underlying concen-tration distributions and, in many cases, their relative sim-plicity. The Mann–Kendall test is a non-parametric signifi-cance test for a monotonic trend in a time series based on Kendall’s tau (τ )(Mann, 1945; Kendall, 1975). We have car-ried out a two-tailed Mann–Kendall test with the linear fit-ted trend for the long-term trend of annual wave and wind parameters. The Theil–Sen slope (Sen, 1968; Theil, 1950), also known as “Kendall’s slope” or the “nonparametric ear regression slope”, is an alternative to the standard lin-ear regression slope. Theil and Sen’s slope estimate is also a method for robust linear regression that chooses the me-dian slope among all lines through pairs of two-dimensional
Figure 9. Variation in annual 90th percentile energy wave period from 1979 to 2012.
sample points. Kendall’s tau is an alternative nonparamet-ric statistic that can be used to test for trends (Hirsch et al., 1993). These statistics can be calculated as the number of possible pairs of years for which the ordering of the years is the same as the ordering of the annual summary statistics (the lower annual statistic occurs in the earlier year) less the num-ber of possible pairs of years with the reverse ordering. The positive and negative values in Sen’s slope indicate positive and negative trends, respectively (Table 4).
The results of all statistics performed are presented in Ta-ble 4. As the computedpvalue is lower than the significance level alpha=0.05, one should reject the null hypothesis H0, and accept the alternative hypothesis Ha. A statistically sig-nificant trend is found for mean wind speed and 90th per-centile wind speed; the null hypothesis of a zero slope is re-jected for these cases at a 5 % level of significance. All other parameters (mean, maximum, 90th and 99th percentile SWH and maximum wind speed) tested failed to satisfy the signifi-cance level. Even though a small increasing trend is observed in annual mean and maximum SWH, the results of the tests show that it is statistically insignificant.
4 Conclusions
A long-term trend in winds and waves along the eastern AS is analyzed using the ERA-interim data set. The study shows that from 1979 to 2012, the annual mean wind speed was characterized by a decreasing trend (1.5 cm s−1year−1),
whereas the annual maximum wind speed displays an up-ward trend of 3.6 cm s−1year−1. The annual maximum and
mean wind speed from 1979 to 2005 has a decreasing trend of 1.4 and 0.8 cm s−1year−1, respectively. The higher wind
speed associated with the local depression events that oc-curred in AS in 2006 and 2007 shifted the trend of an-nual maximum wind speed from 1979 to 2012 from neg-ative to positive. During the southwest monsoon period a higher upward trend in significant wave height (SWH) is ob-served with an exception during August. Annual mean SWH shows a small increasing trend (0.012 cm year−1), whereas
Figure 10.Temporal variation of(a)annual maximum wind speed and(b)annual maximum SWH from 1979 to 2010.
Table 3.Studentttest andZtest for wave and wind.
Parameter ttest Ztest
αlevel pvalue 95 % confidence Standard pvalue 95 % confidence
(two tailed) interval on the mean deviation interval on the mean
SWH_mean 5 % <0.0001 (1.227, 1.249) 0.031 <0.0001 (1.228, 1.248)
SWH_max 5 % <0.0001 (3.532, 3.985) 0.650 <0.0001 (3.54, 3.94)
Wind speed_mean 5 % <0.0001 (3.816, 3.954) 0.198 <0.0001 (3.818, 3.951)
Wind speed_max 5 % <0.0001 (10.780, 12.148) 1.99 <0.0001 (10.806, 12.148)
Table 4.Mann–Kendall significance test for trend analysis.
Parameter Variance Mean Standard deviation Mann–Kendall test
Sen’s slope pvalue (two tailed) Significance
SWH_mean 0.0009 1.238 0.031 0.0001 0.7 NS
SWH_max 0.422 3.758 0.650 0.016 0.16 NS
SWH 90th percentile 1.67 2.58 1.29 0.0016 0.49 NS
SWH 99th percentile 1.67 3.47 1.34 0.008 0.15 NS
Wind speed mean 0.039 3.885 0.198 −0.014 0.0001 SG
Wind speed max 3.99 11.47 1.99 0.020 0.40 NS
Wind speed 90th percentile 0.096 6.4 0.31 −0.018 0.0001 SG
Wind speed 99th percentile 0.38 8.95 0.62 −0.019 0.12 NS
SG: significant; NG: not significant.
annual maximum SWH. Both annual mean and annual max-imum trends are statistically insignificant. The present study is based on the data covering 34 years and long time series are needed in order to assess the trends with acceptable re-liability. Detailed analyses have been carried out to examine the influence of the cyclonic events on the intensity of wave
activity and wind speed, finding that the peak2 event during 1996 is due to a cyclonic event and that peak3 was due to the locally formed low-pressure event.
Acknowledgements. We thank S. W. A. Naqvi, Director, CSIR – National Institute of Oceanography, Goa for providing the encouragement to carry out the study. We thank the two reviewers for their constructive comments and suggestions that substantially improved the paper. This is NIO contribution no. 5505.
Edited by: I. Didenkulova
Reviewed by: A. Speranza and one anonymous referee
References
Allan, J. and Komar, P.: Are ocean wave heights increasing in the eastern North Pacific? Eos Trans., AGU, 47, 566–567, 2000. Berrisford, P., Dee, D., Fielding, K., Fuentes, M., Kållberg,
K., Kobayashi, S., and Uppala, S.: The ERA-interim archive, ERA Report Series, 1. Technical Report, European Centre for Medium-Range Weather Forecasts, Shinfield Park, Reading, 16, 2009.
Bouws, E., Jannink, D., and Komen, G. J.: The increasing wave height in the North Atlantic, Ocean. Bull. Amer. Meteor. Soc., 77, 2275–2277, 1996.
Caires, S. and Swail, V. R.: Global wave climate trend and variabil-ity analysis, paper presented at the 8th International Workshop on Wave hindcasting and Forecasting, US Army Eng. Res. and Dev. Cent. Coastal and Hydraulics Lab., North Shore, Hawaii, 14–19 November 2004.
Carter, D. J. T. and Draper, L.: Has the North East Atlantic become rougher?, Nature, 332, p. 494, doi:10.1038/332494a0, 1988. Dee, D. P. and Uppala, S.: Variational bias correction in
ERA-Interim. ECMWF Tech. Rep. Memorandum no.575, Read-ing, UK, available at: www.ecmwf.int/publications (last access: 7 March 2013), 2008.
Dee, D. P., Uppala, S. M., Simmons, A. J., Berrisford, P., Poli, P., and Kobayashi, S.: The ERA- interim reanalysis: configuration and performance of the data assimilation system, Q. J. Roy. Me-teor. Soc., 137, 553–597, 2011.
Dube, S. K., Rao, A. D., Sinha, P. C., Murty, T. S., and Bahulayan, N.: Numerical modelling of storm surges in the Arabian Sea, Appl. Math. Model., 9, 289–294, 1997.
Evan, A. T. and Camargo S. J.: A Climatology of Arabian Sea Cy-clonic Storms, J. Climate, 24, 140–158, 2011.
Glejin, J., Kumar, V. S., Chempalayil, S. P., Singh, J., Pednekar, P., Kumar K. A., Dora, G. U., and Gowthaman, R.: Variations in swells along eastern Arabian Sea during the summer monsoon, Open J. Mar. Sci., 2, 43–50, 2012.
Glejin, J., Sanil Kumar, V., Balakrishnan Nair, T. M., and Singh, J.: Influence of winds on temporally varying short and long period gravity waves in the near shore regions of the eastern Arabian Sea, Ocean Sci., 9, 343–353, doi:10.5194/os-9-343-2013, 2013. Gray, W. M.: Technical Document WMO/TD No. 72, WMO,
Geneva, Switzerland, I, 3–19, 1985.
Gulev, S. K. and Grigorieva, V.: Last century changes in ocean wind wave height from global visual wave data. Geophys. Res. Lett., 31, L24302, doi:10.1029/2004GL021040, 2004.
Hemer, M. A., Church, J. A., and Hunter, J. R.: Variability and trends in the directional wave climate of the Southern Hemi-sphere, Int. J. Climatol., 30, 475–491, 2010.
Hemer, M. A., Fan, Y., Mori, N., Semedo, A., and Wang, X. L.: Projected changes in wave climate from a multi-model ensemble, Nature climate change, 3, 471–476, 2013.
Hirsch, R. M., Helsel, D. R., Cohn, T. A., and Gilroy, E. J.: Sta-tistical analysis of hydrologic data, in: Handbook of Hydrology, edited by: Maidment, D. R., McGraw-Hill Inc., New York, Ch. 17, 17.11–17.37, 1993.
Jiang, Y., Luo, Y., Zhao, Z., and Tao, S.: Changes in wind speed over China during 1956–2004, Theor. Appl. Climatol., 99, 421–430, 2010.
Kalnay, E., Kanamitsu, M., Kistler, R., Collins, W., Deaven, D., Gandin, L., Iredell, M., Saha, S., White, G., Woollen, J., Zhu, Y., Chelliah, M., Ebisuzaki, W., Higgins, W., Janowiak, J., Mo, K. C., Ropelewski, C., Wang, J., Leetmaa, A., Reynolds, R., Jenne, R., and Joseph, D.: The NCEP/NCAR 40-year reanalysis project, Bull. Amer. Meteor. Soc., 77, 437–471, 1996.
Kanamitsu, M., Ebisuzaki, W., Woolen, J., Potter, J., and Fiorino, M.: NCEP/DOE AMIP-II Reanalysis (R-2), Bull. Amer. Met. Soc., 83, 1631–1643, 2002.
Kendall, M. G.: Rank Correlation Methods. Griffin, London, UK, 1975.
Komen, G. J., Cavalieri, L., Donelan, M., Hasselmann, K., Hassel-mann, S., and Janssen, P. A. E. M.: Dynamics and Modelling of Ocean Waves, Cambridge University Press, 532 pp., 1994. Krogstad, H. E. and Barstow, S. F.: Satellite wave measurements
for coastal engineering applications, Coastal Eng., 37, 283–307, 1999.
Kumar, V. S.: Variation of wave directional spread parameters along the Indian coast, Applied Ocean Res., 28, 98–103, 2006. Kumar, V. S. and Sajiv, C.: Variations in long term wind speed
dur-ing different decades in Arabian Sea and Bay of Bengal, J. Earth Syst. Sci., 119, 639–653, 2010.
Kumar, V. S., Kumar, K. A., and Anand, N. M.: Characteristics of waves off Goa, West coast of India, J. Coast. Res., 16, 782–789, 2000.
Kumar, V. S., Anand, N. M., Kumar, K. A., and Mandal, S.: Multi-peakedness and groupiness of shallow water waves along Indian coast, J. Coast. Res., 19, 1052–1065, 2003.
Kumar, V. S., Pathak, K. C., Pednekar, P., and Gowthaman, R.: Coastal processes along the Indian coastline, Current Sci., 91, 530–536, 2006.
Kumar, V. S., Glejin, J., Dora, G. U., Sajiv, C. P., Singh, J., and Ped-nekar, P.: Variations in nearshore waves along Karnataka, west coast of India, J. Earth Sys. Sci., 121, 393–403, 2012.
Kumar, V. S., Dubhashi, K. K., and Nair, T. M. B.: Wave spectral characteristics off Gangavaram, East coast of India, J. Oceanogr., 70, 307–321, doi:10.1007/s10872-014-0223-y, 2014.
Mann, H. B.: Nonparametric tests against trend, Econometrica, 13, 245–259, 1945.
McPhaden, M. J., Busalacchi, A. J., Cheney, R., Donguy, J. R., Gage, K. S., Halpern, D., Ji, M., Julian, P., Mayers, G., Mitchum, G. T., Niiler, P. P., Picaut, J., Reynolds, R. W., Smith, N., and Takeuchi, K.: The tropical ocean-global atmosphere (TOGA) ob-serving system: a decade of progress, J. Geophys. Res., 103, 14169–14240, 1998.
OceanSITES: User’s Manual, available at: http://www.oceansites.
org/docs/oceansites-user-manual.pdf, last access:
Decem-ber 2009.
Praveen, K. B., Vialard, J., Lengaigne, M., Murty, V. S. N.,
McPhaden, M. J., Cronin, M., Pinsard, F., and Gopala Reddy, K.: TropFlux wind stresses over the tropical oceans: evaluation and comparison with other products, Clim. Dyn., 40, 2049–2071, 2013.
Premkumar, K., Ravichandran, M., Kalsi, S. R., Sengupta, D., and Gadgil, S.: First results from a new observation system over the Indian Seas, Curr. Sci., 78, 323–330, 2000.
Ruggiero, P., Allan, J. C., and Komar, P. D.: Increasing wave heights and extreme-value projections: the wave climate of the U.S. Pa-cific Northwest, Coastal Eng., 57, 539–552, 2010.
Sajiv, P. C., Kumar, V. S., Glejin, J., Dora, G. U., and Vinayaraj, P.: Interannual and seasonal variations in near shore wave character-istics off Honnavar, west coast of India, Curr. Sci., 103, 286–292, 2012.
Sanil Kumar, V., Sajiv Philip, C., and Balakrishnan Nair, T. N.: Waves in shallow water off west coast of India during the onset of summer monsoon, Ann. Geophys., 28, 817–824, doi:10.5194/angeo-28-817-2010, 2010.
Schott, F. A., Xie, S. P., and McCreary Jr., J. P.: Indian Ocean circulation and climate variability, Rev. Geophys., 47, RG1002, doi:10.1029/2007RG000245, 2009.
Sen, P. K.: Estimates of the regression coefficient based on Kendall’s tau, J. Amer. Statist. Assoc., 63, 1379–1389, 1968. Shyamala, B. and Iyer, B. G.: Statistical study of cyclonic
dis-turbances in Arabian Sea, Proceedings of TROPMET-1996, Vishakhapatnam, 14–17 February, 1996.
Simon, B., Joshi, P. C., Thapliyal, P. K., Pal, P. K., Sarkar, A., Bha-tia, R. C., Jain, R. K., Singh, D., Mukherjee, S. K., and Gupta, H. V.: Monsoon onset-2000 monitored using multi-frequency mi-crowave radiometer on-board Oceansat-1, Curr. Sci., 81, 647– 651, 2001.
Singh, O. P.: Long term trends in the frequency of monsoonal cy-clonic disturbances over the North Indian Ocean, Mausam, 52, 655–658, 2001.
Soomere, T. and Räämet, A.: Long-term spatial variations in the Baltic Sea wave fields, Ocean Sci., 7, 141–150, doi:10.5194/os-7-141-2011, 2011.
Srivastava, A. K., Sinha Ray, K. C., and De, U. S.: Trends in the frequency of cyclonic disturbances and their intensification over Indian seas, Mausam, 51, 113–118, 2000.
Theil, H.: A rank-invariant method of linear and polynomial regres-sion analysis, I. Proceedings of the KoninklijkeNederlandseAka-demic van Wetenschappen Series A, 53, 386–392,1950. Tucker, M. J. and Pitt, E. G.: Waves in Ocean Engineering, Elsevier
ocean engineering book series vol. 5, Elsevier, Amsterdam, 521 pp., 2001.
Uppala, S. M., Kållberg, P. W., Simmons, A. J., Andrae, U., da Costa Bechtold, V., Fiorino, M., Gibson, J. K., Haseler, J., Her-nandez, A., Kelly, G. A., Li, X., Onogi, K., Saarinen, S., Sokka, N., Allan, R. P., Andersson, E., Arpe, K., Balmaseda, M. A., Beljaars, A. C. M., van de Berg, L., Bidlot, J., Bormann, N., Caires, S., Chevallier, F., Dethof, A., Dragosavac, M., Fisher, M., Fuentes, M., Hagemann, S., Hólm, E., Hoskins, B. J., Isaksen, L., Janssen, P. A. E. M., Jenne, R., McNally, A. P., Mahfouf, J.-F., Morcrette, J.-J., Rayner, N. A., Saunders, R. W., Simon, P., Sterl, A., Trenberth, K. E., Untch, A., Vasiljevic, D., Viterbo, P., and Woollen, J.: : The ERA-40 re-analysis, Q. J. Roy. Meteorol. Soc., 131, 2961–3012, doi:10.1256/qj.04.176, 2005.
Vanem, E. and Walker, S. E.: Identifying trends in the ocean wave climate by time series analyses of significant wave height data, Ocean Eng., 61, 148–160, 2013.
Young, I. R., Zieger, S., and Babanin, A.: Global trends in wind speed and wave height, Science, 332, 451–455, 2011.