Recovery of Leaf Hydraulic Conductance from Water
Stress in
Populus trichocarpa
Joan Laur*, Uwe G. Hacke
Department of Renewable Resources, University of Alberta, 442 Earth Sciences Building, Edmonton, Alberta, Canada
Abstract
Gas exchange is constrained by the whole-plant hydraulic conductance (Kplant). Leaves account for an important fraction of Kplantand may therefore represent a major determinant of plant productivity. Leaf hydraulic conductance (Kleaf) decreases
with increasing water stress, which is due to xylem embolism in leaf veins and/or the properties of the extra-xylary pathway. Water flow through living tissues is facilitated and regulated by water channel proteins called aquaporins (AQPs). Here we assessed changes in the hydraulic conductance ofPopulus trichocarpa leaves during a dehydration-rewatering episode. While leaves were highly sensitive to drought,Kleafrecovered only 2 hours after plants were rewatered. Recovery ofKleafwas
absent when excised leaves were bench-dried and subsequently xylem-perfused with a solution containing AQP inhibitors. We examined the expression patterns of 12 highly expressed AQP genes during a dehydration-rehydration episode to identify isoforms that may be involved in leaf hydraulic adjustments. Among the AQPs tested, several genes encoding tonoplast intrinsic proteins (TIPs) showed large increases in expression in rehydrated leaves, suggesting that TIPs contribute to reversing drought-induced reductions in Kleaf. TIPs were localized in xylem parenchyma, consistent with a role in
facilitating water exchange between xylem vessels and adjacent living cells. Dye uptake experiments suggested that reversible embolism formation in minor leaf veins contributed to the observed changes inKleaf.
Citation:Laur J, Hacke UG (2014) The Role of Water Channel Proteins in Facilitating Recovery of Leaf Hydraulic Conductance from Water Stress inPopulus trichocarpa. PLoS ONE 9(11): e111751. doi:10.1371/journal.pone.0111751
Editor:Silvia Mazzuca, Universita` della Calabria, Italy
ReceivedJune 15, 2014;AcceptedOctober 7, 2014;PublishedNovember 18, 2014
Copyright:ß2014 Laur, Hacke. This is an open-access article distributed under the terms of the Creative Commons Attribution License, which permits unrestricted use, distribution, and reproduction in any medium, provided the original author and source are credited.
Data Availability:The authors confirm that all data underlying the findings are fully available without restriction. All relevant data are within the paper and its Supporting Information files.
Funding:U. G. H. acknowledges funding from a Natural Sciences and Engineering Research Council (NSERC) Discovery grant, the Canada Foundation for Innovation and the Canada Research Chair program. The funders had no role in study design, data collection and analysis, decision to publish, or preparation of the manuscript.
Competing Interests:The authors have declared that no competing interests exist.
* Email: laur@ualberta.ca
Introduction
High gas exchange rates can only be sustained when leaves are kept well hydrated. This, in turn, depends on the properties of the xylem pipeline and on the way in which water moves through living cells in roots and leaves [1,2]. Leaf hydraulic conductance is emerging as an important component of whole-plant hydraulic conductance [3–7]. Like in roots and stems, the hydraulic conductance of leaves declines as the water potential becomes more negative. This loss of hydraulic conductance is due to embolism formation in leaf veins [8,9], cell shrinkage [10], collapse of xylem conduits [11], and/or to decline in the permeability of extra-xylary tissues [12]. Compared with stems, leaves [13] and roots [14] are often more vulnerable to hydraulic dysfunction. In some cases, however, the hydraulic conductance of these plant organs may also be able to quickly recover from the effects of drought [3,15].
This recovery of hydraulic function may be facilitated by the activity of aquaporin (AQP) water channels [16–20]. AQPs belong to the major intrinsic protein (MIP) superfamily, a family of protein pores present in the membranes of almost all biological cells to facilitate the diffusion of a wide range of small uncharged solutes. Plant MIPs form a particularly large family of proteins,
with 28 members in Vitis vinifera [21], $30 members in
Arabidopsis thaliana, Picea glauca and Oryza sativa [19,22,23], and.50 members inPopulus trichocarpa[24]. The plant-specific plasma membrane intrinsic proteins (PIPs), with their highly conserved phylogenetic subgroups PIP1 and PIP2, and tonoplast intrinsic proteins (TIPs) show significant water transport activity
in vitro and in planta [25–27]. Regulation of AQPs via transcription, translation, post-translational modifications or traf-ficking allows plant cells and organs to respond to hydraulic changes in their surrounding environment [28].
Materials and Methods
Plant material and growing conditions
All experiments were carried out with P. trichocarpa clone 664042 cuttings (mother tree planted in Lotbinie`re, Que´bec, Canada from a 1973 IUFRO progeny collection in Washougal, Oregon, USA). Rooted cuttings were produced and established in a greenhouse at the University of Alberta for 2 months in 3.8 L containers with sunshine mix 4 (Sun Gro Horticulture Canada Ltd.) under semi-controlled conditions (22/20uC day: night cycle, 18/6 h light: dark, watered daily, and fertilized (2g L-1 NPK15-30-15) once a week).
Leaf hydraulic conductance measurements
Leaf hydraulic conductance was measured using the evaporative flux method (29) on six plants per treatment. A filtered (0.2mm) 20 mM KCl+1 mM CaCl2solution (subsequently referred to as ‘artificial xylem sap’, AXS) was used for these measurements. Flow rate through leaves was measured with a balance (model CP 224S, Sartorius, Go¨ttingen, Germany), which logged data every 30 s to a computer. The air was well stirred by a fan as explained by Sack & Scoffoni [29]. Leaves were illuminated with,1000mmol m22s21 photosynthetically active radiation (PAR) at the leaf surface by an LED worklight (Husky, distributed by Home Depot, Atlanta, GA, USA). Leaf temperature was monitored by a thermocouple. Leaf water potential (Yleaf) was measured using a pressure chamber (PMS Instruments, Albany, OR, USA). For hydrated leaves, the
Kleaf was calculated as described previously [29] using the final
Yleaf(Yfinal), which was determined at the end of the measurement ofE, immediately after removing the leaf from the tubing system. TheKleafwas normalized by leaf area, which was determined with a scanner.
A leaf vulnerability curve was generated with plants experienc-ing different levels of water stress followexperienc-ing methods of Sack & Scoffoni [29].Kleafwas measured on leaves corresponding to leaf plastochron index (LPI) 9 [30]. The initial Yleaf (YO) was measured using a leaf immediately above or below the leaf that was subsequently connected to the tubing system. Once a leaf was connected to the tubing system, a stable flow rate (E) was usually reached in less than 20 minutes; this value ofEwas subsequently used for calculatingKleaf. Leaves that did not provide stable E within 20 min were discarded. When dehydrated leaves are measured with the EFM, their Yleaf may change because the petiole is connected to water at atmospheric pressure [3]. To test for this,Yfinal and YO were compared. In most cases,YO and
Yfinalwere similar and the more negative of these two values was used to calculateKleaf. WhenYOandYfinaldiffered by more than 0.2 MPa, the leaf was discarded andKleafwas not calculated. The leaf vulnerability curve (shown in Fig. 1) was fitted with a 3 parameter logistic function:Kleaf= a/[1+(Yleaf/x0)b]. The curve fit was done using SigmaPlot v. 13 (Systat Software, San Jose, CA, USA). The curve fit was used to calculate the maximum leaf hydraulic conductance as well as the leaf water potentials at 50% and 80% loss of hydraulic conductance.
Recovery of leaf hydraulic conductance after dehydration To study the recovery of Kleaf in intact plants, plants were randomly assigned to different watering regimes in the green-house. One group of plants was kept well watered (control). Another group of plants was subjected to a drought treatment. Water was withheld for several days until plants reached aYleafof
20.7760.05 MPa (mean6SE, n = 6). ThisYleafwas associated with a substantial reduction inKleaf. A subset of drought-stressed plants was then rewatered, andYleafandKleafwere re-measured 2 h and 26 h after rewatering.
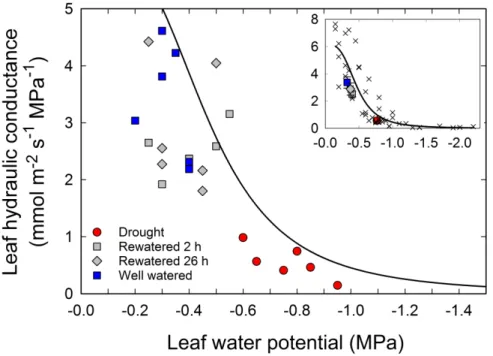
Figure 1. Effect of a change in water availability on leaf hydraulic conductance (Kleaf) inPopulus trichocarpasaplings.Kleafand the
associated leaf water potential (Yleaf) were measured in 6 well-watered control plants (blue squares), 6 drought-stressed plants (red circles), and
drought-stressed plants 2 and 26 h after rewatering (grey squares and diamonds, respectively). Each data point represents a single measurement of Kleaf. The solid line shows the previously established vulnerability curve for Kleaf. A 3 parameter logistic function was used for the curve fit: Kleaf= 6.154/[1+(Yleaf/0.469)3.337]. An overview of the complete vulnerability curve is shown in the upper right corner of the figure. Individual
To assess the effect of AQP inhibitors and abscisic acid (ABA) on the recovery ofKleaf, excised leaves were bench-dried for 1 h (Yleaf reached 21.0060.09 MPa (mean 6 SE, n = 6)) and then perfused for 2 h with AXS, AXS+0.2 mM HgCl2, AXS+50 mM
H2O2or AXS+50mM ABA. Solutions were introduced into the transpiring leaf by immersing the petiole inside 50 mL containers. Leaves were placed near a fan; light was provided at a light level of ,1,000mmol m22s21 PAR. Mercury chloride and H2O2 have Table 1.Transcript abundance of 12 aquaporin genes expressed in leaves of well-watered control plants.
Aquaporin name Expression (copiesmg21of total RNA)
PtPIP1;1 112,96069,067
PtPIP1;2 272,111632,575
PtPIP1;3 229,960644,252
PtPIP2;3 85,667615,402
PtPIP2;4 273,655633,728
PtPIP2;5 11,53661,738
PtTIP1;3 23,10562,540
PtTIP1;5 11,84061,675
PtTIP1;6 2,3306121
PtTIP2;1 153,689619,669
PtTIP2;2 24,86363,451
PtTIP4;1 51769
Values are the means6SE from three biological samples which were tested in triplicate. doi:10.1371/journal.pone.0111751.t001
Figure 2. Relative expression of aquaporin genes in leaves of plants exposed to a drying-rewatering cycle.Gene expression was measured in leaves of well-watered control plants (C), drought-stressed plants (D), and 3 h after drought-stressed plants were rewatered (RW). The geometric mean of the expression levels of four reference genes (ACT2,CYC063,TIP41-like,UBQ7) was used to normalize the results. Asterisks denote significant differences in expression level compared to control levels (one-way ANOVA, followed by Bonferroni’s post test, *P#0.05; **P#0.01***P#
been widely used as AQP inhibitors; ABA may also reduce AQP activity in leaves (reviewed in 28; 12). Control leaves were always kept hydrated and were perfused with pure AXS for 2 h. Immediately after perfusion with these solutions, Kleaf was determined as described above. All measurements were conducted at the same time of day (10:00–11:30 h).
After perfusion with the different solutions, stomatal pore aperture of leaves was measured as described in Laur & Hacke [31]. Images were recorded in six randomly selected fields of view of each leaf. Fields of view were located near the point of maximum leaf width on the abaxial leaf surface.
Dye uptake experiments
The extent of dye uptake in excised leaves was used as an additional method to assess xylem refilling in leaf veins during the rehydration phase. We also used the dye uptake experiments in an attempt to study how embolism reversal in leaf veins is impacted by mercury. Excised leaves were bench-dried for 1 h and rehydrated for 2 h by immersion of the petioles in filtered safranin solutions. Transpiration during dye uptake was promoted by placing leaves near a fan at a light level of,1,000mmol m22s21 PAR (i.e., conditions similar to the protocol used to measureKleaf). Dye (0.1% (w/v) safranin) was dissolved in pure AXS or AXS+
0.2 mM HgCl2. Control leaves were excised from well-watered plants and then perfused for 2 h with 0.1% safranin-containing AXS without prior dehydration treatment. Images were recorded in six randomly selected fields of view of each leaf. Fields of view were located near the point of maximum leaf width on the abaxial leaf surface.
Gene transcript measurements by quantitative real-time PCR
Fully expanded leaves corresponding to LPI 7–10 were collected, immediately frozen in liquid nitrogen and stored at2 80uC until analyzed. Samples were always collected between 10:00 h and 11:30 h to minimize any diurnal effect on AQP expression. Total RNA was extracted from 3 plants per treatment following the CTAB method of Pavy et al. [32]. RNA quality was assessed on an agarose gel and quantified with a spectrophotom-eter (Nanodrop ND-1000, Thermo Scientific, Wilmington, DE, USA). RNA was treated as previously described [19]. cDNA quality was checked by PCR with intron-spanning actin primers. Putative leaf-expressed AQP genes were selected [33–35], specific primers (Table S1) were designed according to Rutledge & Stewart [36] using the QuantPrime online tool [37]. PCR efficiency was 10067% for all primer pairs and specificity was checked using melting curves. Real-time qPCR was performed on a 7900 HT Fast Real-Time PCR system (Applied Biosystems, Foster City, CA, USA) as described previously [31]. Relative gene expression was measured according to Livak & Schmittgen [38] using the 2DDC(t) method. The expression values were normalized to the geometric mean of four housekeeping genes (actin (POPTR_0001s31700),
cyclophilin (POPTR_0005s26170), TIP4-like
(POPTR_0009s09620.1) and ubiquitin (POPTR_0005s09940)). Relative gene expression was determined as the fold change of an AQP isoform at a given condition relative to its expression under control conditions. Real-time PCR was carried out using three biological replicates each with three technical replicates.
Immunolocalization
Samples were fixed in formaldehyde-acetic acid and embedded in paraffin as described previously [39]. Transverse sections, Figure 3. Response of leaf hydraulic conductance (A) and stomatal aperture (B) to different perfusion solutions.Control conditions refer to theKleafthat was measured after leaves were xylem perfused with filtered (0.2mm) 20 mM KCl+1 mM CaCl2solution (subsequently referred
to as ‘artificial xylem sap’, AXS) for 2 h.Kleafwas also measured on leaves that were dried for 1 h (Dehydrated) and on leaves that were
bench-dried for 1 h and subsequently perfused for 2 h with AXS (RW AXS), AXS+0.2 mM HgCl2(RW HgCl2), AXS+50 mM H2O2(RW H2O2) or AXS+50mM ABA
10mm thick, were prepared with a microtome. Immunoreactions were performed following the protocol of Gong et al. [40]. Primary antibodies directed against the 42 N-terminal amino acids of AtPIP1;3 [41] and the conserved 10 amino acids of the C-terminal of PIP2s [19] were used. In addition, we applied a commercially available anti-TIP2 antibody (Sakurai et al. [42]); Agrisera AB, Sweden; alignment shown in Figure S1). AlexaFluo 488-conjugated goat anti-chicken, anti-mouse and anti-rabbit secondary antibodies (Life Technologies Inc., Burlington, ON, Canada) were applied respectively for 2 h at 37uC. Slides were mounted with Permount. Images were taken with a Zeiss LSM 700 confocal microscope (Carl Zeiss, Oberkochen, Germany).
Statistical analysis
All statistical analyses were carried out using SigmaPlot software. Differences due to the effect of physiological treatments were analyzed after testing for normality and equal variance by using a one-way ANOVA followed by a Tukey’s test. A one-way ANOVA followed by Bonferroni’s post test was used for the gene expression analysis. Differences were considered significant atP# 0.05.
Results and Discussion
Leaf hydraulic conductance is highly sensitive to drought To assess how Kleaf declines as a function of Yleaf, we first constructed a vulnerability curve. Water was withheld from plants in the greenhouse until plants reached different levels of water stress. Leaves were highly vulnerable with 50% and 80% loss of hydraulic conductance occurring atYleaf=20.47 MPa and20.71 MPa, respectively (Figure 1, insert). According to the curve fit in Figure 1 (insert), the maximum Kleaf measured during this experiment was 6.15 mmol m22s21 MPa21. The drought-induced loss in Kleaf shown in Figure 1 may have been due to xylem cavitation, reduced water permeability of cell membranes and/or other factors [6,7]. The water potentials at 50% and 80% loss of hydraulic conductance (P50andP80, respectively) are well within the range of water potentials that trees experience under natural conditions [43,44]. It therefore appears thatKleafis subject to substantial diurnal changes under natural conditions, similar to what has been observed in rice and other species [3,15,45,46]. Our data also indicates that leaf hydraulic conductance is more sensitive to decreasing water potentials than the hydraulic conductance of stems [43]. However, since we only worked with young greenhouse-grown plants, it remains to be seen whether leaves of field-grown trees are similar in their response to water stress.
Leaves of intact plants quickly recover from drought We next tested whether Kleaf would recover after a drought treatment when plants were left intact during the dehydration-rehydration episode. In this experiment, leaves of well-watered control plants had a Yleaf of 20.3360.03 MPa (6SE, n = 6), which was associated with aKleaf of 3.3760.41 mmol m22s21 MPa21 (
6SE, n = 6) (Figure 1, blue squares). The drought treatment resulted in a drop of Yleaf to 20.7760.05 MPa (6 SE, n = 6) and a six-fold drop ofKleafto 0.5560.12 mmol m22s21 MPa21(6SE, n = 6) (Figure 1, red circles). These values were in good agreement with the previously established vulnerability curve (Figure 1, insert). Only 2 h after rewatering (Figure 1, grey Figure 4. Typical images of transpiringP. trichocarpaleaves that
were allowed to take up safranin solution.(A) A control leaf was excised from a well-watered plant, and the petiole was immersed for 2 h in safranin solution. Transpiration during dye uptake was promoted by placing the leaf near a fan at,1,000mmol m22
s21
photosynthetic active radiation. Most leaf veins were stained indicating minimal xylem embolism. (B) Dye uptake in a bench-dried leaf that was subsequently perfused with safranin solution for 2 h. Minor veins exhibited incomplete staining indicating the presence of embolized xylem conduits in minor veins. (C) Dye uptake of a bench-dried leaf
subsequently perfused with safranin+HgCl2solution for 2 h. Mercury
is an aquaporin inhibitor. Staining remained even more incomplete than in (B).
squares), both Yleaf and Kleaf reached values that were not statistically different from well-watered control plants (t test,
P= 0.083 for Kleaf), indicating that leaves completely recovered their hydraulic function.
AQPexpression in leaves collected from intact plants To study the role of water channels in the recovery ofKleaf, AQP expression was measured in leaves at different stages during the dehydration-rehydration experiment. Three PIP1, three
PIP2, and six TIP candidate genes were selected for analysis. Among them, PtPIP1;1, PtPIP1;2, PtPIP1;3; PtPIP2;4 and
PtTIP2;1exhibited the highest total number of mRNA molecules in leaves of control plants (Table 1).
The drought treatment resulted in a significant reduction in the expression of all tested genes (Fig. 2). In leaves collected 2 h after rewatering, there were two patterns of expression between the 12 isoforms. One group of genes (among them allPIP1s) remained down-regulated while the expression of a second group of genes matched or exceeded the transcript levels measured in control leaves. With the exception of PtTIP2;1, all tested TIPs were significantly up-regulated after 2 h. Among the PIPs, only the expression level ofPtPIP2;3increased to match the control level.
Recovery ofKleafin detached leaves is impaired by
inhibitors
Another set of experiments was conducted on leaves that were excised from the plant prior to the dehydration-rehydration treatment. Working with detached leaves allowed us to study the effect of AQP inhibitors and ABA on the recovery ofKleaf. Control leaves exhibited a Kleaf of 8.4960.57 mmol m22s21 MPa21 (6SE, n = 6), which is higher than the values shown in Figure 1. One difference between the data shown in Figures 1 and 3 is that all data in Figure 1 was derived from leaves that were excised (petioles were cut under water) from transpiring plants immedi-ately before Kleaf was measured while the control leaves in Figure 3 were perfused with AXS for 2 h prior to measuringKleaf. Hence, the absoluteKleafvalues shown in Figures 1 and 3 are not readily comparable.
Bench-drying of leaves caused a ,10-fold decline in Kleaf relative to fully hydrated control leaves (Figure 3A). Dehydrated leaves that were subsequently xylem-perfused for 2 h with AXS exhibited a significant recovery to 50% of the hydraulic conductance measured in control leaves. The fact that recovery remained incomplete in detached leaves is consistent with an involvement of phloem transport in embolism repair [47,48]. Application of commonly used inhibitors allowed us to assess the impact of AQPs onKleafduring leaf rehydration. Leaves fed with HgCl2 and H2O2 did not exhibit any recovery of hydraulic
Figure 5. Relative expression of aquaporin genes in detached leaves during a dehydration-rehydration experiment.Data are from control leaves (C) after they were perfused with artificial xylem sap (AXS) for 2 h, leaves that were dehydrated on the bench top for 1 h (D), and leaves that were dehydrated on the bench top for 1 h and then perfused for 2 h with AXS (RW). The geometric mean of the expression levels of four reference genes (ACT2,CYC063, TIP41-like,UBQ7) was used to normalize the results. Asterisks denote significant differences in expression level compared to control levels (one-way ANOVA, followed by Bonferroni’s post test, *P#0.05; **P#0.01***P#0.001). Data are means6SE of three biological replicates.
conductance, indicating that AQPs were involved in the recovery ofKleafafter dehydration. A role of AQPs in embolism repair has also been proposed for other species and plant organs [18,19,49– 51].
We next asked whether differences inKleafwere associated with different degrees of stomatal closure. Stomatal apertures in fully hydrated control leaves were 9.560.1mm (6SE, n = 6), similar to the value of,10mm previously reported forP. trichocarpaleaves [52]. Schulte and Hinckley [52] found that stomatal aperture in this species was not affected by a wide range of epidermal water potentials. Our data supports these findings as we also did not observe complete stomatal closure in any of our experimental treatments (Figure 3B). Even in dehydrated leaves and in leaves that were perfused with AQP inhibitors and ABA, stomatal aperture remained at ,6mm. This value is similar to the maximum apertures found in P. deltoides and inP. trichocarpa
xdeltoideshybrids [31,52]. We conclude that the magnitude of the decline in Kleaf in dehydrated leaves and in leaves that were perfused with AQP inhibitors is greater than that of changes in stomatal aperture. Guyot et al. [53] also found a discrepancy between patterns of stomatal conductance and Kleaf, and they discuss possible reasons for a mechanistic independence of stomatal and leaf hydraulic conductance.
We used the dye uptake experiments in an attempt to study how embolism reversal in leaf veins is impacted by mercury. Nearly all veins of well-watered control leaves were stained and functional (Figure 4A). In leaves that were bench-dried and subsequently supplied with ASX+safranin for 2 h, many minor veins exhibited incomplete staining (Figure 4B). Staining was even less complete in leaves that were bench-dried and subsequently perfused with ASX
+safranin+HgCl2(Figure 4C).
These findings suggest that embolism formation in minor veins had a substantial impact on the dynamics ofKleaf. Studying water transport in rice leaves, Stiller et al. [8] reported that the leaf
xylem experienced high embolism levels, even in watered controls. Nardini et al. [54] found that minor veins ofCercis siliquastrum
leaves underwent extensive embolism at leaf water potentials,2 1.5 MPa, indicating that leaf vein embolism was closely related to
Kleaf changes. Recently, Johnson et al. [55] suggested that reductions inKleafare directly related to vein embolism. On the other hand, a recent study found that hydraulic decline during mild dehydration was associated with leaf shrinkage [10]. The changes in Kleaf we observed in this present study were likely caused by xylem and extra-xylem components; it is difficult to determine the relative importance of either component. In addition, both xylem refilling in leaf veins and the permeability of extra-xylem tissues may be impacted by AQP function.
AQPexpression in detached leaves
Aquaporin expression was measured in detached leaves undergoing a dehydration-rehydration cycle (Figure 5). Control leaves were perfused with AXS for 2 h before leaf tissue was sampled for the gene expression analysis. As previously seen in intact plants (Figure 2), water stress caused down-regulation of all testedAQPs (Figure 5). This agrees with several previous studies [19,56,57].
Notably, very similar degrees of down-regulation were found in bench-dried leaves and in dried leaves that were subsequently xylem-perfused with AXS+ ABA (Figure 6, r = 0.725,P,0.01). Genes that were strongly down-regulated by dehydration, such as
PtTIP1;6 also exhibited strong down-regulation after perfusion with ABA solution while the expression of other genes, such as
PtPIP2;4, changed less in response to either of these factors (Figure 6). Excluding PtPIP1;1 from the analysis shown in Figure 6 further increased the strength of the linear relationship (r = 0.89,P,0.001).
The lack of recovery in ABA-perfused leaves and down-regulation of AQPs in leaves supplied with AXS + ABA is Figure 6. Relative expression of 12 aquaporin genes in response to dehydration (y-axis) and dehydration+perfusion with abscisic acid (x-axis).Detached leaves were either dehydrated on the bench top for 1 h or dehydrated for 1 h and subsequently perfused for 1 h with 50mM abscisic solution (ABA). Data from fully hydrated detached leaves (perfused for 3 h with 20 mM KCl+1 mM CaCl2solution) were used as the
consistent with the model of Shatil-Cohen et al. [12]. Working with Arabidopsis, these authors also used a ‘detached leaf’ approach to feed ABA to the xylem via the petiole. Feeding the leaf with ABA decreased Kleaf by nearly 50%. In contrast, smearing ABA on the leaf surface, while reducing transpiration, had no effect onKleaf. Shatil-Cohen et al. [12] proposed that the membrane water permeability of bundle sheath cells is controlled by AQPs, and that the bundle sheath would act like a control center regulatingKleafin response to signals from the xylem. As the concentration of ABA increases in the xylem, AQP activity in the bundle sheath would be down-regulated, reducing water flow into the leaf mesophyll. Bundle sheath cells, and perhaps xylem parenchyma cells, seem to have a specific responsiveness to ABA, which likely explains the negative effects of this hormone onKleaf (for a recent review see 7). While our data is consistent with these observations, it is not clear yet which cells may perform the role of a ‘control center’ in P. trichocarpaleaves (Figure S2). While we previously observed prominent PIP1 and PIP2 labeling of the endodermis-like bundle sheath inPicea glauca needles [19], no such pattern was found in this present study.
In rehydrated leaves, four genes showed increased expression levels relative to control leaves (Figure 5). Three of these AQPs (PtTIP1;3, PtTIP2;2, and PtTIP4;1) were TIPs and were also found to be up-regulated when intact plants were rewatered after a
drought (compare Figures 2 and 5). While TIPs have rarely been studied in the context of water flow through tissues and embolism repair, a recent study on grapevine plants found a striking positive correlation between Kleaf and the transcript abundance of
VvTIP2;1 [58]. Our immunolocalization experiments indicate that TIP2 protein was present in xylem parenchyma cells (Figure 7). This agrees with the expression pattern of ZmTIP1
in leaves and stems of maize.In situlocalization revealed that this tonoplast AQP was highly expressed in parenchyma cells surrounding xylem vessels, in phloem companion cells, and between the phloem and the xylem strands [59]. Barrieu et al. [59] hypothesized that the high expression of the ZmTIP1 tonoplast AQP in xylem parenchyma cells would allow these cells to control water movement in and out of the xylem vessels. Daniels et al. [60] found that AtTIP2 expression in mature leaves was generally restricted to vascular tissues. In stem xylem of hybrid poplar, a TIP2 AQP was highly expressed in contact cells, suggesting a role in increasing water exchange between vessels and xylem rays [61].
In this present study, we also determined the cell- and tissue-level localization of PIP1 and PIP2 proteins (Figure 7). All sections were taken from leaves of well-watered plants. Strong PIP1 signals were present in the palisade parenchyma (Figure 7A). PIP1 antibody was also detected in vein cells, including phloem and Figure 7. Immunolocalization of AQP proteins in leaves of P. trichocarpasaplings.Confocal laser scanning micrographs showing the localization of PIP1, PIP2, TIP2 proteins in minor veins of leaf transverse sections (A, B, C respectively). Controls with no primary antibody indicate minimal background fluorescence (D, E, F respectively). Images were taken at an identical setting and were color-coded with an intensity look-up-table (LUT; displayed in A), in which black was used to encode background, and blue, green, yellow, red and white to encode increasing signal intensities. Ph, phloem; PP, palisade parenchyma; Xyl, xylem. Scale bars = 20mm.
xylem parenchyma. This labeling pattern is consistent with a dual role of PIP1s in influencing permeability to water and CO2[62]. PIP2 was mostly localized in the phloem, which agrees with previous studies [19,27,61,63,64]. Weaker PIP2 labelling was evident in palisade parenchyma cells (Figure 7B).
Conclusions
We studied how AQPs may be involved in the recovery of water stress-induced declines inKleaf. We examined howKleafresponds to known AQP inhibitors and xylem-fed ABA. We also examined the expression of 12 highly expressed AQP genes during dehydration-rehydration experiments. Hydraulic measurements and gene expression assays were complemented by dye uptake and immunolocalization experiments. This has revealed that, whileP. trichocarpa leaves are highly sensitive to dehydration, leaf hydraulic conductance can quickly recover when water becomes available again. Recovery ofKleafwas absent when excised leaves were xylem-perfused with AQP inhibitors, suggesting that the recovery of leaf hydraulic function is associated with AQP activity. Among the AQPs tested, severalTIPs showed large increases in expression in rehydrated leaves, suggesting that TIPs play an important role in reversing drought-induced reductions inKleaf.
Supporting Information
Figure S1 (a) Amino acid multiple sequence alignment of the N-terminal region of the Arabidopsis thaliana AtPIP1;3 and the
Populus trichocarpaPtPIP1s; (b) of the conserved the C-terminal region of PIP2s, and (c) TIP2s. Consensus amino acids are underlined in black.
(DOCX)
Figure S2 Transverse section of a Populus trichocarpa
leaf showing minor veins with (left) and without (right) bundle sheath cell extensions.Scale bar = 20mm.
(DOCX)
Table S1 Primer sequences used for the gene expres-sion study.
(DOCX)
Acknowledgments
We are grateful to Dr. Barb R. Thomas (University of Alberta - Alberta-Pacific Forest Industries, Canada) and Pierre Pe´rinet (Que´bec Ministry of Forests) for providing the plant material.
Author Contributions
Conceived and designed the experiments: JL UGH. Performed the experiments: JL UGH. Analyzed the data: JL UGH. Contributed reagents/materials/analysis tools: JL UGH. Contributed to the writing of the manuscript: JL UGH.
References
1. Sperry JS, Hacke UG, Oren R, Comstock JP (2002) Water deficits and hydraulic limits to leaf water supply. Plant, Cell Environ 25(2): 251–63.
2. Tyree MT, Sperry JS (1988) Do woody plants operate near the point of catastrophic xylem dysfunction caused by dynamic water stress? answers from a model. Plant Physiol (88): 574–80.
3. Scoffoni C, McKown AD, Rawls M, Sack L (2012) Dynamics of leaf hydraulic conductance with water status: quantification and analysis of species differences under steady state. J Exp Bot 63: 643–58.
4. Nardini A, Luglio J (2014) Leaf hydraulic capacity and drought vulnerability: possible trade-offs and correlations with climate across three major biomes. Funct Ecol 28(4): 810–818.
5. Brodribb TJ, Holbrook NM (2004) Stomatal protection against hydraulic failure: a comparison of coexisting ferns and angiosperms. New Phytol 162(3): 663–70. 6. Heinen RB, Ye Q, Chaumont F (2009) Role of aquaporins in leaf physiology.
J Exp Bot 60(11): 2971–85.
7. Prado K, Maurel C (2013) Regulation of leaf hydraulics: from molecular to whole plant levels. Front Plant Sci 4: 255.
8. Stiller V, Lafitte HR, Sperry JS (2003) Hydraulic properties of rice and the response of gas exchange to water stress. Plant Physiol 132: 1698–706. 9. Johnson DM, McCulloh KA, Meinzer FC, Woodruff DR, Eissenstat DM (2011)
Hydraulic patterns and safety margins, from stem to stomata, in three eastern U.S. tree species. Tree Physiol 31(6): 659–68.
10. Scoffoni C, Vuong C, Diep S, Cochard H, Sack L (2014) Leaf shrinkage with dehydration: coordination with hydraulic vulnerability and drought tolerance. Plant Physiol 164(4): 1772–88.
11. Brodribb TJ, Holbrook NM (2005) Water stress deforms tracheids peripheral to the leaf vein of a tropical conifer. Plant Physiol 137: 1139–46.
12. Shatil-Cohen A, Attia Z, Moshelion M (2011) Bundle-sheath cell regulation of xylem-mesophyll water transport via aquaporins under drought stress: a target of xylem-borne ABA? Plant J 67(1): 72–80.
13. Brodribb TJ, Holbrook NM, Edwards EJ, Gutie´rrez MV (2003) Relations between stomatal closure, leaf turgor and xylem vulnerability in eight tropical dry forest trees. Plant, Cell Environ 26: 443–50.
14. Hacke UG, Sperry JS, Ewers BE, Ellsworth DS, Scha¨fer KVR, et al. (2000) Influence of soil porosity on water use inPinus taeda. Oecologia 124(4): 495– 505.
15. Stiller V, Sperry JS, Lafitte R (2005) Embolized conduits of rice (Oryza sativa, Poaceae) refill despite negative xylem pressure. Am J Bot 92(12): 1970–4. 16. Galme´s J, Pou A, Alsina MM, Toma`s M, Medrano H, et al. (2007) Aquaporin
expression in response to different water stress intensities and recovery in Richter-110 (Vitissp.): relationship with ecophysiological status. Planta 226(3): 671–81.
17. Jang HY, Yang SW, Carlson JE, Ku YG, Ahn SJ (2013) Two aquaporins of
Jatropha are regulated differentially during drought stress and subsequent recovery. J Plant Physiol 170(11): 1028–38.
18. Martre P, Morillon R, Barrieu F, North GB, Nobel PS, et al. (2002) Plasma membrane aquaporins play a significant role during recovery from water deficit. Plant Physiol 130(4): 2101–10.
19. Laur J, Hacke UG (2014) ExploringPicea glaucaaquaporins in the context of needle water uptake and xylem refilling. New Phytol 203 (2): 388–400. 20. North GB, Martre P, Nobel PS (2004) Aquaporins account for variations in
hydraulic conductance for metabolically active root regions ofAgave desertiin wet, dry, and rewetted soil. Plant, Cell Environ 27(2): 219–28.
21. Fouquet R, Le´on C, Ollat N, Barrieu F (2008) Identification of grapevine aquaporins and expression analysis in developing berries. Plant Cell Rep 27(9): 1541–50.
22. Quigley F, Rosenberg JM, Shachar-Hill Y, Bohnert HJ (2002) From genome to function: the Arabidopsis aquaporins. Genome Biol 3(1): research0001.1– research0001.17.
23. Sakurai J, Ishikawa F, Yamaguchi T, Uemura M, Maeshima M (2005) Identification of 33 rice aquaporin genes and analysis of their expression and function. Plant Cell Physiol 46(9): 1568–77.
24. Gupta AB, Sankararamakrishnan R (2009) Genome-wide analysis of major intrinsic proteins in the tree plantPopulus trichocarpa: characterization of XIP subfamily of aquaporins from evolutionary perspective. BMC Plant Biol 9: 134. 25. Daniels MJ, Mirkov TE, Chrispeels MJ (1994) The plasma membrane of
Arabidopsis thalianacontains a mercury-insensitive aquaporin that is a homolog of the tonoplast water channel protein TIP. Plant Physiol 106(4): 1325–33. 26. Postaire O, Tournaire-Roux C, Grondin A, Boursiac Y, Morillon R, et al. (2010)
A PIP1 aquaporin contributes to hydrostatic pressure-induced water transport in both the root and rosette ofArabidopsis. Plant Physiol 152(3): 1418–30. 27. Vandeleur RK, Mayo G, Shelden MC, Gilliham M, Kaiser BN, et al. (2009)
The role of plasma membrane intrinsic protein aquaporins in water transport through roots: diurnal and drought stress responses reveal different strategies between isohydric and anisohydric cultivars of grapevine. Plant Physiol 149(1): 445–60.
28. Chaumont F, Tyerman SD (2014) Aquaporins: Highly regulated channels controlling plant water relations. Plant Physiol 164: 1600–18.
29. Sack L, Scoffoni C (2012) Measurement of leaf hydraulic conductance and stomatal conductance and their responses to irradiance and dehydration using the Evaporative Flux Method (EFM). J Vis Exp (70): 1–7.
30. Larson PR, Isebrands JG (1971) The plastochron index as applied to developmental studies of cottonwood. Can J For Res 1(1): 1–11.
31. Laur J, Hacke UG (2013) Transpirational demand affects aquaporin expression in poplar roots. J Exp Bot 64(8): 2283–93.
32. Pavy N, Boyle B, Nelson C, Paule C, Gigue`re I, et al. (2000) Identification of conserved core xylem gene sets: conifer cDNA microarray development, transcript profiling and computational analyses. New Phytol 180(4): 766–86. 33. Almeida-Rodriguez AM, Cooke JEK, Yeh F, Zwiazek JJ (2010) Functional
Populus simonii6balsamiferaclones with different drought resistance strategies. Physiol Plant 140(4): 321–33.
34. Wilkins O, Nahal H, Foong J, Provart NJ, Campbell MM (2009) Expansion and diversification of thePopulusR2R3-MYB family of transcription factors. Plant Physiol 149(2): 981–93.
35. Cohen D, Bogeat-Triboulot M-B, Vialet-Chabrand S, Merret R, Courty P-E, et al. (2013) Developmental and environmental regulation of aquaporin gene expression acrossPopulusspecies: Divergence or Redundancy? PLoS One 8(2): e55506.
36. Rutledge RG, Stewart D (2010) Assessing the performance capabilities of LRE-based assays for absolute quantitative real-time PCR. PLoS One 5(3): e9731. 37. Arvidsson S, Kwasniewski M, Rian˜o-Pacho´n DM, Mueller-Roeber B (2008)
QuantPrime–a flexible tool for reliable high-throughput primer design for quantitative PCR. BMC Bioinformatics 9: 465.
38. Livak KJ, Schmittgen TD (2001) Analysis of relative gene expression data using real-time quantitative PCR and the 22DDCT
method. Methods 25(4): 402–8. 39. Almeida-Rodriguez AM, Hacke UG, Laur J (2011) Influence of evaporative
demand on aquaporin expression and root hydraulics of hybrid poplar. Plant Cell Environ 34(8): 1318–31.
40. Gong H, Peng Y, Zou C, Wang D (2006) A simple treatment to significantly increase signal specificity in immunohistochemistry. Plant Mol Biol Report 24: 93–101.
41. Kammerloher W, Fischer U, Piechottka GP, Scha¨ffner AR (1994) Water channels in the plant plasma membrane cloned by immunoselection from a mammalian expression system. Plant J 6: 187–99.
42. Sakurai J, Ahamed A, Murai M, Maeshima M, Uemura M (2008) Tissue and cell-specific localization of rice aquaporins and their water transport activities. Plant Cell Physiol 49(1): 30–9.
43. Sparks JP, Black RA (1999) Regulation of water loss in populations ofPopulus trichocarpa: The role of stomatal control in preventing xylem cavitation. Tree Physiol 19: 453–9.
44. Pezeshki SR, Hinckley TM (1982) The stomatal response of red alder and black cottonwood to changing water status. Can J For Res 12(4): 761–71. 45. Trifilo` P, Gasco´ A, Raimondo F, Nardini A, Salleo S (2003) Kinetics of recovery
of leaf hydraulic conductance and vein functionality from cavitation-induced embolism in sunflower. J Exp Bot 54(391): 2323–30.
46. Martorell S, Diaz-Espejo A, Medrano H, Ball MC, Choat B (2014) Rapid hydraulic recovery inEucalyptus pauciflora after drought: linkages between stem hydraulics and leaf gas exchange. Plant Cell Environ 37(3): 617–26. 47. Nardini A, Lo Gullo MA, Salleo S (2011) Refilling embolized xylem conduits: is
it a matter of phloem unloading? Plant Sci 180(4): 604–11.
48. Christman MA, Sperry JS, Smith DD (2012) Rare pits, large vessels and extreme vulnerability to cavitation in a ring-porous tree species. New Phytol 193: 713–20.
49. Mayr S, Schmid P, Laur J, Rosner S, Charra-Vaskou K, et al. (2014) Uptake of water via branches helps timberline conifers refill embolized xylem in late winter. Plant Physiol 164(4): 1731–40.
50. Secchi F, Zwieniecki MA (2010) Patterns of PIP gene expression inPopulus trichocarpaduring recovery from xylem embolism suggest a major role for the PIP1 aquaporin subfamily as moderators of refilling process. Plant Cell Environ 33(8): 1285–97.
51. Chitarra W, Balestrini R, Vitali M, Pagliarani C, Perrone I, et al. (2014) Gene expression in vessel-associated cells upon xylem embolism repair inVitis vinifera
L. petioles. Planta 239: 887–99.
52. Schulte PJ, Hinckley TM (1987) The relationship between guard cell water potential and the aperture of stomata inPopulus. Plant Cell Environ 10: 313–8. 53. Guyot G, Scoffoni C, Sack L (2012) Combined impacts of irradiance and dehydration on leaf hydraulic conductance: insights into vulnerability and stomatal control. Plant Cell Environ 35(5): 857–71.
54. Nardini A, Salleo S, Raimondo F (2003) Changes in leaf hydraulic conductance correlate with leaf vein embolism inCercis siliquastrumL. Trees 17(6): 529–34. 55. Johnson DM, Mcculloh KA, Woodruff DR, Meinzer FC (2012) Evidence for xylem embolism as a primary factor in dehydration-induced declines in leaf hydraulic conductance. Plant, Cell Environ 35: 760–9.
56. Alexandersson E, Fraysse L, Sjo¨vall-Larsen S, Gustavsson S, Fellert M, et al. (2005) Whole gene family expression and drought stress regulation of aquaporins. Plant Mol Biol 59(3): 469–84.
57. Secchi F, Lovisolo C, Schubert A (2007) Expression of OePIP2.1 aquaporin gene and water relations ofOlea europaea twigs during drought stress and recovery. Ann Appl Biol 150(2): 163–7.
58. Pou A, Medrano H, Flexas J, Tyerman SD (2012) A putative role for TIP and PIP aquaporins in dynamics of leaf hydraulic and stomatal conductances in grapevine under water stress and re-watering. Plant Cell Environ 36(4): 828–43. 59. Barrieu F, Chaumont F, Chrispeels MJ (1998) High expression of the tonoplast aquaporin ZmTIP1 in epidermal and conducting tissues of maize. Plant Physiol 117(4): 1153–63.
60. Daniels MJ, Chaumont F, Mirkov TE, Chrispeels MJ (1996) Characterization of a new vacuolar membrane aquaporin sensitive to mercury at a unique Site. Plant Cell 8: 587–99.
61. Almeida-Rodriguez AM, Hacke UG (2012) Cellular localization of aquaporin mRNA in hybrid poplar stems. Am J Bot 99(7): 1249–54.
62. Secchi F, Zwieniecki MA (2013) The physiological response ofPopulus tremula
xalbaleaves to the down-regulation of PIP1 aquaporin gene expression under no water stress. Front Plant Sci 4: 507.
63. Kirch H, Vera-estrella R, Golldack D, Quigley F, Michalowski CB, et al. (2000) Expression of water channel proteins inMesembryanthemum crystallinum. Plant Physiol 123: 111–24.