Short Report
Printed in Brazil - ©2018 Sociedade Brasileira de QuímicaSimultaneous Multienzymatic Screening with Fluorogenic Probes
MariaL.S.O.Lima,aMichelR.B.Chaves,aRenatoM.C.doNascimento,a
CarolineC.S.GonçalvesbandAnitaJ.Marsaioli*,a
aDepartamento de Química Orgânica, Instituto de Química, Universidade Estadual de Campinas,
P.O. Box 6154, 13084-971 Campinas-SP, Brazil
bInstituto Latino-Americano de Ciências da Vida e da Natureza,
Universidade Federal da Integração Latino-Americana, Av. Tancredo Neves, 6731, Bl. 6, 85867-970 Foz do Iguaçú-PR, Brazil
The simultaneous screening of multiple enzyme activities in a single assay has numerous advantages over the traditional format, since it decreases sampling errors, allows savings in reagents and consumables and reduces the time and labor required to conduct the assays. In the present study, a direct and sensitive assay for the simultaneous detection of epoxide hydrolase and esterase (or lipase) activities was developed. Signal overlap is avoided by synthesizing fluorogenic probes with enzyme-specific alkyl linkers, connected to different fluorophores (resorfurin and umbelliferone), which exhibit emission spectra at different wavelengths. The simultaneous assays were conducted in microplate format with the fluorogenic probes monitored in the same well that uses microorganisms as enzyme source. Our results show that the fluorescent signal from each of the probes used here can be discriminated, allowing multiple enzyme activity detection and quantitation.
Keywords: multienzymatic screening, simultaneous detection, fluorogenic probes, hydrolases, cascade reaction
Introduction
Methodologies associated with fluorescent phenomena have led to the development of spectrophotometric techniques associated with sensors targeting biological applications.1-7 The fact that these techniques are based on the
monitoring of absorption/emission wavelengths enables the simultaneous monitoring of different phenomena occurring in the same system by detecting different wavelengths.8,9
As such, multiplex assays10-12 are developed and applied
to detect multiple transformations in a single experiment. They are often applied to high performance methodologies, where multiple analytes can be evaluated against a high number of samples.13 In the case of microplate assays, this
allows the simultaneous and parallel monitoring of different biomolecules in a single system, paving the way for different and wider applications within the current biological context, such as the discovery of new biocatalysts of interest with the use of specific fluorogenic/chromogenic probes.4,14-17
The inclusion of biocatalytic steps in predominantly
chemical processes is an excellent alternative to improve parameters such as reaction conversion and selectivity;15 or
even more complex cases, when it is aimed at obtaining a biocatalyst able to catalyze different substrates (enzymatic promiscuity).18,19 To that end, genetic engineering
techniques have been used to improve catalytic potential through directed evolution processes.20 These processes
can lead to chemical and structural modifications of enzymes,21 resulting in mutants with high or no specificity,
making it possible to obtain biocatalysts ranging from the most enantioselective to the most promiscuous.22 This
versatility contributes to their biotechnological application in industrial settings, where molecular engineering techniques, coupled with green chemistry processes, allow the production of high value-added inputs.23,24
As such, demand for these new biocatalysts requires rapid and sensitive methodologies to evaluate enzymatic activities,2,5,16,25 conversion, enantioselectivity (E)9,14,26
and enantiomeric excess (ee).3 Thus, spectrophotometric
methods that use chromogenic 27 or fluorogenic7,16,25
substrates as sensors are ideal for monitoring enzymatic activities. These methodologies are sensitive and require low concentrations of the substrate and biocatalyst, and *e-mail: [email protected]
are performed in miniaturized experiments (µL-scale) evaluating a large number of samples per unit of time.4,14
Since these tests monitor absorption (for chromophores) or emission (for fluorophores), more than one substrate can be evaluated at a time,9,28,29 provided that one wavelength
does not overlap the other. Thus, the development of simultaneous monitoring systems for enzymatic activities becomes quite promising, contributing not only to cost savings, but to optimizing test times.29,30
Similar strategies are widely applied in life science research and clinical diagnostics for multiplexed analyses of target biomarkers.31-33 Multiplex immunoassays enable
simultaneous analyses of different targets, requiring less sample and reagent than traditional enzyme-linked immunosorbent assays (ELISA), thereby simplifying and improving assay dynamics. This technology is applied to detect and quantify proteins, in addition to investigating cellular events and different diseases, such as cancer, ocular disorders and Kaposi’s sarcoma-associated herpesvirus.33-37
In this regard, the present study proposes a methodology capable of simultaneously detect two enzymatic activities (epoxide-hydrolase and esterase or epoxide-hydrolase and lipase) in the same microorganism, with a miniaturized process involving two fluorogenic substrates (probes) that differ in the functional group, and fluorophores, both producing vicinal diols as products and releasing the fluorophore by sharing the same chemical cascade. This methodology was denominated multienzymatic screening.
Experimental
General methods
All chemical reactions were conducted under an N2
atmosphere using reagent grade solvents. All the reagents were purchased from Sigma-Aldrich Co., Germany, and used without further purification. Fluorogenic probes 4a and 4c
were previously synthesized by our research group, according to Reymond’s methodology.14 Flash column chromatography
was performed using normal phase silica gel. The spots on analytical thin-layer chromatography (TLC) plates were visualized under ultraviolet light or visible light (it is not necessary to use chemical solutions because the resorufin derivatives are colored). 1H nuclear magnetic resonance
(NMR) spectra were recorded on Bruker spectrometers (400 or 500 MHz). Chemical shifts (d) are reported in parts per million (ppm) relative to the internal standard tetramethylsilane (Si(CH3)4 = 0.00 ppm) or residual solvent
peaks (CDCl3 or dimethyl sulfoxide (DMSO)). 1H NMR
coupling constants (J) are reported in hertz (Hz), and multiplicity is indicated as follows: s (singlet), d (doublet),
t (triplet), q (quartet), m (multiplet), s (singlet), dd (doublet of doublet), dq (doublet of quartet). 13C NMR spectra were
recorded at 100 or 125 MHz, and all chemical shift values are reported in ppm on the d scale, with an internal reference of CDCl3 or DMSO. Fluorescence spectra and the enzymatic
assays were recorded with a 2300 EnSpire Multimodal Reader (PerkinElmer). All microorganisms were obtained from CCT (Tropical Cultures Collection, André Tosello Foundation, Campinas, Brazil) or ATCC (American Type Culture Collection, Manassas, USA). All culture media used in this study were purchased from Oxoid (Brazil).
Enzymatic assays
All assays were performed in quadruplicate in 96-well microtitre plates (with 200 µL in each well) and incubated at 28 °C and 180 rpm for 24 h. The assays (enzymatic assays, negative controls and positive controls) were monitored simultaneously, according to umbeliferone (λex = 370 nm
and λem = 470 nm) and resorufin (λex = 570 nm and
λem = 590 nm) wavelengths.
Screening of microorganisms used in the assays
Enzymatic assay
Each well was added with NaIO4 (10 µL, 20 mmol L−1
in water), BSA (bovine serum albumin, 80 µL, 5.0 g L−1
in borate buffer, pH 7.8), fluorescent probe 3, 4a or 4b
(10 µL, 1 mmol L−1 in DMSO) and cell suspension (100 µL;
0.2 g L−1 for bacteria and yeast; 1.0 g L−1 for fungi) in borate
buffer, pH 7.8.
Negative control
Each well was added with NaIO4 (10 µL, 20 mmol L−1
in water), BSA (80 µL, 5.0 g L−1 in borate buffer, pH 7.8),
fluorescent probe 3, 4a or 4b (10 µL, 1 mmol L−1 in DMSO)
and borate buffer pH 7.8 (100 µL).
Positive control
Each well was added with NaIO4 (10 µL, 20 mmol L−1
in water), BSA (80 µL, 5.0 g L−1 in borate buffer, pH 7.8),
5 or diol 6 (10 µL, 1 mmol L−1 in DMSO) and cell
suspension (100 µL; 0.2 g L−1 for bacteria and yeast;
1.0 g L−1 for fungi) in borate buffer, pH 7.8.
Multienzymatic assay
in a 2300 EnSpireTM Multimodal Reader (PerkinElmer) for 10 h and monitored every 15 min in the umbelliferone (λex = 370 nm and λem = 470 nm) and resorufin (λex = 570 nm
and λem = 590 nm) wavelengths, simultaneously. The
2300 EnSpireTM Multimodal Reader (PerkinElmer) enables simultaneous monitoring of two different emission wavelengths in the same well.
Enzymatic assay
Each well was added with NaIO4 (10 µL, 20 mmol L−1
in water), BSA (70 µL, 5.7 g L−1, in borate buffer, pH 7.8),
fluorescent probe 3 and 4a or 4b (10 µL, 0.5 mmol L−1 in
DMSO) and cell suspension (100 µL; 0.2 g L−1 for bacteria
and yeast; 1.0 g L−1 for fungi) in borate buffer, pH 7.8.
Negative control
Each well was added with NaIO4 (10 µL, 20 mmol L−1
in water), BSA (70 µL, 5.7 g L−1 in borate buffer, pH 7.8),
fluorescent probe 3 and 4a or 4b (10 µL, 0.5 mmol L−1 in
DMSO) and borate buffer pH 7.8 (100 µL).
Positive control
Each well was added with NaIO4 (10 µL, 20 mmol L−1
in water), BSA (70 µL, 5.7 g L−1 in borate buffer, pH 7.8),
5 and 6 diol (10 µL, 0.5 mmol L−1 in DMSO) and cell
suspension (100 µL; 0.2 g L−1 for bacteria and yeast;
1.0 g L−1 for fungi) in borate buffer, pH 7.8.
Chemical synthesis
7-(But-3-en-1-yloxy)-3H-phenoxazin-3-one (7)1
K2CO3 (0.126 g, 0.9 mmol, 2.0 equiv.) and resorufin sodium
salt (0.96 g, 0.4 mmol, 1.0 equiv.) were added to a solution of 3-butene-1-(p-toluenesulfonate) (0.100 g, 0.44 mmol, 1.0 equiv.) in anhydrous DMF (dimethylformamide, 7.0 mL). The mixture reaction was refluxed at 110 °C for 1 h under N2.
After cooling, the mixture was diluted with CH2Cl2 (50 mL)
and washed with water (35 mL × 2) and brine (35 mL × 4), respectively. The organic layer was separated, dried over MgSO4 and the solvent was removed under reduced
pressure, resulting in the pure product (orange solid product) (0.119 g, 90.1%). 1H NMR (400 MHz, CDCl
3) d7.81 (1H,
d, J 8.0 Hz), 7.54 (1H, d, J 10.0 Hz), 7.06 (1H, dd, J 2.4 and 8.8 Hz), 6.95 (1H, dd, J 2.0 and 10.0 Hz), 6.92 (1H, d,
J 2.5 Hz), 6.43 (1H, d, J 2.0 Hz), 6.05 (1H, m), 5.35 (1H, dq,
J 1.6, 2.8 and 17.2 Hz), 5.29 (1H, dq, J 1.6, 2.8 and 8.8 Hz), 4.25 (2H, t, J 6.8 Hz), 2.75 (2H, m); 13C NMR (100 MHz,
CDCl3) d 186.5, 163.2, 150.0, 145.8, 145.6, 134.9, 134.3,
133.7, 131.7, 128.5, 117.9, 114.2, 106.9, 100.7, 68.4, 33.4. Electron impact-mass spectrometry (EI-MS, m/z) was calculated for C16H13NO3, 267.09; found, 267.30.
7-(2-(Oxiran-2-yl)ethoxy)-3H-phenoxazin-3-one (3)1
A solution of 7 (0.150 g, 0.6 mmol, 1 equiv.) in anhydrous CH2Cl2 (6 mL) was treated at 0 °C with 77%
m-CPBA (0.250 g, 1.12 mmol, 2 equiv.). After 16 h at 0 °C, the solution was washed with 10% aqueous Na2SO3
(10 mL × 3), 5% aqueous NaOH (10 mL × 3) and water (10 mL × 2), respectively. The organic layer was evaporated and the solid was purified by flash chromatography (CH2Cl2:acetone 1:19) to give 3 (0.708 g, 53%) as an orange
solid. 1H NMR (500 MHz, DMSO) d 7.77 (1H, d, J 9.0 Hz),
7.53 (1H, d, J 10.0 Hz), 7.14 (1H, d, J 2.5 Hz), 7.07 (1H, dd, J 2.5 and 9.0 Hz), 6.79 (1H, dd, J 2.0 and 9.5 Hz), 6.26 (1H, d, J 2.0 Hz), 4.26 (2H, t, J 6.5 Hz), 3.09 (1H, m), 2.74 (1H, t, J 4.5 Hz), 2.56 (H, dd, J 3.0 and 5.5 Hz), 2.03 (1H, m), 1.92 (1H, m); 13C NMR (125 MHz, DMSO) d 185.8,
163.0, 150.2, 145.8, 145.7, 135.4, 134.2, 131.8, 128.4, 114.6, 106.1, 101.3, 66.5, 49.5, 46.6, 32.0. EI-MS (m/z) calculated for C16H13NO4, 283.08; found, 283.30.
Results and Discussion
Multienzymatic screening assays consist of the simultaneous monitoring of two or more enzymatic activities in the same microorganism. These assays are recommended to rapidly assess the activity of a large number of samples, since more than one enzyme activity can be detected in a single assay. In this respect, fluorogenic probes derived from resorufin (1) and umbelliferone (2) (Figure 1) were used in a multicomponent assay that allowed the simultaneous detection of epoxide hydrolases (resorufin-based probe 3)37
and esterases (umbelliferone-based probes 4a and 4b) (Scheme 1).3,14 Signal independence for each target
enzyme was achieved because the fluorophores employed, resorufin (λex = 570 nm, λem = 590 nm) and umbelliferone
(λex = 370 nm, λem = 470 nm), have different excitation
and emission wavelengths, thereby avoiding interference with the simultaneous detection of the fluorescence signal corresponding to each enzyme activity (Figure 1).
The multicomponent assays to detect epoxide hydrolases and esterases were performed simultaneously in a single microplate well. In addition, the enzymatic hydrolysis products of probes 3, 4a and 4b are analogous (vicinal diols) and therefore participate in the same chemical cascade, triggered by specific enzymes. This chemo-enzymatic cascade model has been widely applied by our research group and was initially published by Reymond and co-workers in their research works.14,38 The
cascade involves oxidative cleavage of the diols (caused by the action of NaIO4) followed by in situβ-elimination
two enzymatic activities in the same microplate well (Scheme 1).
Microorganism screening with fluorogenic probes
Implementation of the multienzymatic screening methodology with microorganisms adhered to the following protocol: first, the experiments were performed with each of
the selected strains: 13 bacteria (Acinetobacter baumanni, CCT: 1432; Agrobacterium tumefaciens, CCT: 6515;
Bacillus cereus, CCT: 4060; Proteus mirabilis,
C C T : 1 4 7 3 ; P s e u d o m o n a s a e r u g i n o s a, CCT: 1987; Pseudomonas oleovorans, CCT:1969;
Serratia liquefaciens, CCT: 1479; Yersinia intermedia, CCT: 1600; Xanthomonas maltophilia, CCT: 1897;
Corynebacterium xerosis, ATCC: 373; Serratia plymuthica, CCT: 2023; Micrococcus luteus, CCT:2720 and
Bacillus subtilis, CCT: 89), 5 yeasts (Pichia stipites, CCT: 2617; Pachysolen tannophilus, CCT: 1891;
Rhodotorula glutinis, CCT: 2182; Saccharomyces cerevisiae, CCT: 771 and Kluyveromyces marxianus, CCT: 2393) and 8 fungi (Geotrichum candidum, CCT: 1205;
Rhizopus oryzae, CCT: 4964; Curvularia lunata,
CCT: 5628; Curvularia eragrostidis, CCT: 5634;
Emericella nidulans, CCT: 3119; Aspergillus fumigatus, CCT:1277; Mortierella isabelina, CCT: 3498 and
Beauveria bassiana, CCT: 4448) from André Tosello
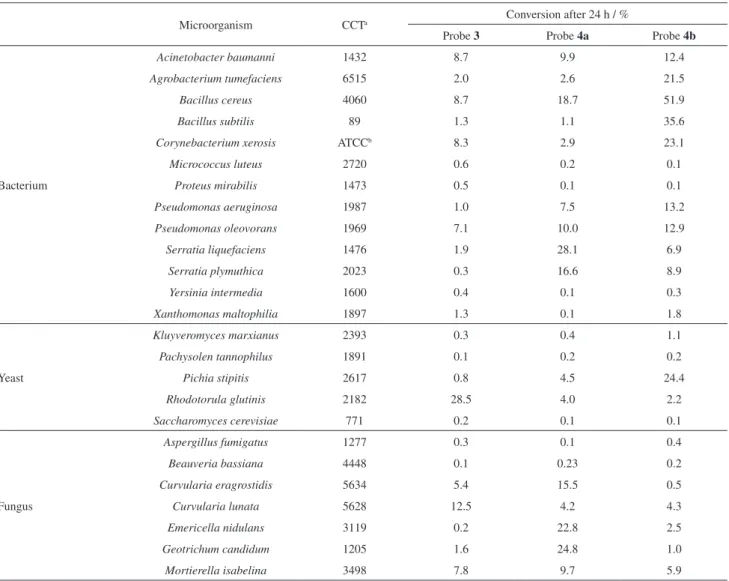
Foundation Tropical Cultures Collection (CCT), available at LaBioChem (Institute of Chemistry, UNICAMP). The strains were evaluated (3, 4a and 4b) individually (Table 1) to determine which ones showed activity for probes with different fluorophores (3 and 4a or 3 and 4b) (Scheme 1).
The assays were performed in 96-well microplates, with quadruplicates of the assays and duplicates of the negative and positive controls, and monitored for 24 h. The results were expressed as conversion in percentage (Table 1), where the fluorescent signal shows how much of the
Scheme1. Simultaneous chemo-enzymatic cascade reactions with fluorogenic probes 3 and 4.
substrate (probe) was converted into its respective product via chemo-enzymatic reaction (Scheme 1). Conversion percentages of the enzymatic reactions were calculated according to the equation 1:
(1)
where RFU of assays is the relative fluorescence unit corresponding to each well of the assayed microplate; RFU of negative controls represents the spontaneous hydrolysis of the probes used and RFU of positive controls represents a 100% conversion assay, i.e., the maximum fluorescence intensity. Based on the conversions observed after 24 h (Table 1), the bacterium Bacillus cereus (CCT: 4060), the yeast Rhodotorula glutinis (CCT: 2182) and the fungus
Curvularia lunata (CCT: 5628) were selected to test the multi-enzymatic screening methodology.
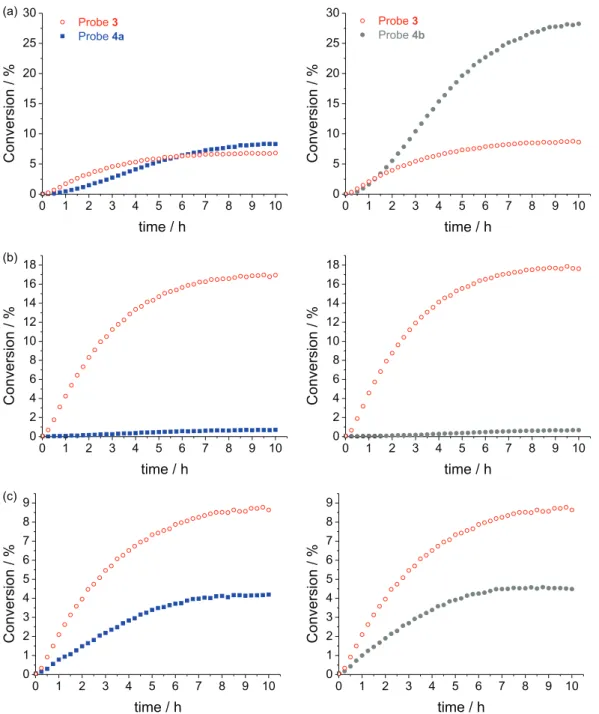
Multienzymatic screening assays
The multienzimatic screening assays were carried out with Bacillus cereus (CCT: 4060), Rhodotorula glutinis (CCT: 2182) and Curvularia lunata (CCT: 5628) using probes 3 and 4a (resorufin and umbelliferone-derived probes, respectively). The same assay monitored both hydrolytic activities over the same time interval (see Scheme 1 and Figure 2). The same procedure was adopted for the simultaneous monitoring assay of probes 3 and 4b.
Since resorufin is also detected in the visible region (Figure 1), in addition to fluorescence, a change is observed in the assay color when compared to the negative control Table1. Conversions of the enzymatic reactions with each probe after 24 h
Microorganism CCTa Conversion after 24 h / %
Probe 3 Probe 4a Probe 4b
Bacterium
Acinetobacter baumanni 1432 8.7 9.9 12.4
Agrobacterium tumefaciens 6515 2.0 2.6 21.5
Bacillus cereus 4060 8.7 18.7 51.9
Bacillus subtilis 89 1.3 1.1 35.6
Corynebacterium xerosis ATCCb 8.3 2.9 23.1
Micrococcus luteus 2720 0.6 0.2 0.1
Proteus mirabilis 1473 0.5 0.1 0.1
Pseudomonas aeruginosa 1987 1.0 7.5 13.2
Pseudomonas oleovorans 1969 7.1 10.0 12.9
Serratia liquefaciens 1476 1.9 28.1 6.9
Serratia plymuthica 2023 0.3 16.6 8.9
Yersinia intermedia 1600 0.4 0.1 0.3
Xanthomonas maltophilia 1897 1.3 0.1 1.8
Yeast
Kluyveromyces marxianus 2393 0.3 0.4 1.1
Pachysolen tannophilus 1891 0.1 0.2 0.2
Pichia stipitis 2617 0.8 4.5 24.4
Rhodotorula glutinis 2182 28.5 4.0 2.2
Saccharomyces cerevisiae 771 0.2 0.1 0.1
Fungus
Aspergillus fumigatus 1277 0.3 0.1 0.4
Beauveria bassiana 4448 0.1 0.23 0.2
Curvularia eragrostidis 5634 5.4 15.5 0.5
Curvularia lunata 5628 12.5 4.2 4.3
Emericella nidulans 3119 0.2 22.8 2.5
Geotrichum candidum 1205 1.6 24.8 1.0
Mortierella isabelina 3498 7.8 9.7 5.9
(Figure 3), indicating the liberation of resorufin (caused by chemo-enzymatic cascade) and, consequently, revealing the presence of the enzymatic activity investigated. Given that umbelliferone is excited at around 370 nm and therefore emits at about 470 nm (blue), it cannot be observed under visible light, requiring a 354 nm UV light lamp for visualization, as shown in Figure 3.
This assay reveals that the reaction is in progress by changing the color of the reaction medium. When the chemo-enzymatic cascade is in progress, the resorufin (purple color) and the substrate (3) mix-up producing the color depicted in the Figure 3. Therefore, this color
change can be taken as a visual qualitative evidence of the enzymatic reaction.
After monitoring, it was possible to simultaneously detect both enzymatic activities in the well, expressed by the same microorganism using fluorogenic probes 3 and 4a
or 3 and 4b, which confirmed the efficiency of the proposed methodology.
Conclusions
The proposed methodology is highly efficient, allowing the simultaneous monitoring of two hydrolytic activities in Figure2. Graphs of the simultaneous detections of probes 3 and 4a (left) and probes 3 and 4b (right) in the assays performed with (a) Bacillus cereus
the same experiment. Although the enzymatic-enzymatic cascade model is already known in the literature, the simultaneous detection of this fluorogenic probe model has never been employed. The results were quantitative (Figure 2) and qualitative (Figure 3), with the aid of visible and UV light at 354 nm. The methodology is a promising new tool in the screening of a large number of biological samples, such as collections of mutants and clones.
SupplementaryInformation
Supplementary information (NMR and EI-MS spectra) is available free of charge at http://jbcs.sbq.org.br as a PDF file.
Acknowledgments
The authors thank the CNPq (National Research Council, 140741/2013-5 and 307885/2013-5) and FAPESP-GSK (2014/50249-8) Brazil, for financial support.
References
1. Forchin, M. C.; Crotti, M.; Gatti, F. G.; Parmeggiani, F.; Brenna, E.; Monti, D.; ChemBioChem2015, 16, 1571; Zhang, Y.; Shi, W.; Li, X.; Ma, H.; Sci. Rep. 2013, 3, ID 2830, doi 10.1038/ srep02830; Shen, W.; Zhang, J.; Mao, G.; Jiang, K.; Zhu, Q.;
Biol. Pharm. Bull. 2009, 32, 1496.
2. Gonçalves, C. C. S.; Costa, B. Z.; Lima, M. L. S. O.; Fiorito, G. F.; Ruiz, A. L. T. G.; Oliveira, S. B. P.; Barbosa, G. O.; Carvalho, H. F.; Marsaioli, A. J.; Tetrahedron2016, 72, 7235.
3. Lima, M. L. S. O.; Gonçalves, C. C. S.; Barreiro, J. C.; Cass, Q. B.; Marsaioli, A. J.; J. Braz. Chem. Soc.2015, 26, 319. 4. Costa, B. Z.; Rodrigues, V. D.; Oliveira, V. M.; Ottoboni, L. M.
M.; Marsaioli, A. J.; Braz. J. Microbiol.2016, 47, 846.
Figure3. Multienzymatic monitoring for Bacillus cereus after 10 h. (a, b) Same assay with probes 3 and 4a, observed with visible and 354 nm UV light, respectively; (c, d) same assay with probes 3 and 4b observed under visible and 354 nm UV light, respectively.
5. Gonçalves, C. C. S.; Marsaioli, A. J.; Quim. Nova2013, 36, 1587.
6. Sheng, Y.; Liu, K.; Wu, Q.; Oi, N.; Chen, H.; Reddy, K.; Jiang, Y.; Yao, K.; Li, H.; Li, W.; Zhang, Y.; Saleem, M.; Ma, W.-Y.; Bode, A. M.; Dong, Z.; Dong, Z.; Oncotarget2014, 7, 30977. 7. Tallman, K. R.; Levine, S. R.; Beatty, K. E.; ACS Chem. Biol.
2016, 11, 1810.
8. Ladner, T.; Beckers, M.; Hitzmann, B.; Büchs, J.; Biotechnol. J.2016, 11, 1605.
9. Janes, L. E.; Kazlauskas, R. J.; J. Org. Chem.1997, 62, 4560.
10. Elshal, M. F.; McCoy, J. P.; Methods2006, 38, 317. 11. Hagan, S.; Tomlinson, A.; Ocul. Surf.2013, 11, 219.
12. Beloglazova, N. V.; Speranskaya, E. S.; Wu, A.; Wang, Z.; Sanders, M.; Goftman, V. V.; Zhang, D.; Goryacheva, I. Y.; De Saeger, S.; Biosens. Bioelectron.2014, 62, 59.
13. Purohit, S.; Sharma, A.; She, J.-X.; Biomed. Res. Int.2015,
2015, ID 326918.
14. Wahler, D.; Badalassi, F.; Crotti, P.; Reymond, J.-L.; Chem. - Eur. J. 2002, 8, 3211.
15. Tufvesson, P.; Lima-Ramos, J.; Haque, N. A.; Gernaey, K. V.; Woodley, J. M.; Org. Process Res. Dev. 2013, 17, 1233. 16. Zadlo-Dobrowolska, A.; Szczygiel, M.; Koszelewski, D.;
Paprocki, D.; Ostaszewski, R.; Org. Biomol. Chem.2016, 14, 9146.
17. Wodtke, R.; Schramm, G.; Pietzsch, J.; Pietsch, M.; Löser, R.;
ChemBioChem2016, 17, 1263.
18. Gupta, R. D.; Sustainable Chem. Processes2016, 4, 1. 19. Khersonsky, O.; Tawfik, D. S.; Annu. Rev. Biochem.2010, 79,
471.
20. Reetz, M. T.; Bocola, M.; Wang, L. W.; Sanchis, J.; Cronin, A.; Arand, M.; Zou, J.; Archelas, A.; Bottalla, A.-L.; Naworyta, A.; Mowbray, S. L.; J. Am. Chem. Soc.2009, 131, 7334. 21. Amrein, B. A.; Bauer, P.; Duarte, F.; Carlsson, A. J.; Naworyta,
22. Renata, H.; Wang, Z. J.; Arnold, F. H.; Angew. Chem., Int. Ed.
2015, 54, 3351.
23. Turner, N. J.; Nat. Chem. Biol.2009, 5, 567.
24. Bornscheuer, U. T.; Huisman, G. W.; Kazlauskas, R. J.; Lutz, S.; Moore, J. C.; Robins, K.; Nature2012, 485, 185.
25. Zadlo, A.; Koszelewski, D.; Borys, F.; Ostaszewski, R.;
ChemBioChem2016, 17, 71.
26. Mantovani, S. M.; Oliveira, L. G.; Marsaioli, A. J.; J. Mol. Catal. B: Enzym.2008, 52-53, 173.
27. Kračun, S. K.; Schückel, J.; Westereng, B.; Thygesen, L. G.; Monrad, R. N.; Eijsink, V. G. H.; Willats, W. G. T.; Biotechnol. Biofuels2015, 8, 70.
28. Priestman, M. A.; Wang, Q.; Jernigan, F. E.; Chowdhury, R.; Schmidt, M.; Lawrence, D. S.; ACS Chem. Biol.2015, 10, 433. 29. Wakata, A.; Lee, H. M.; Rommel, P.; Toutchkine, A.; Schmidt,
M.; Lawrence, D. S.; J. Am. Chem. Soc.2010, 132, 1578. 30. Johansson, M.; Tomankova, J.; Li, S.; Zamaratskaia, G.;
Interdiscip. Toxicol.2012, 5, 150.
31. Fu, Q.; Zhu, J.; van Eyk, J. E.; Clin. Chem.2010, 56, 314.
32. Valentin, M. A.; Ma, S.; Zhao, A.; Legay, F.; Avrameas, A.; J. Pharm. Biomed. Anal.2011, 55, 869.
33. Fu, Q.; Schoenhoff, F. S.; Savage, W. J.; Zhang, P.; van Eyk, J. E.; Proteomics: Clin. Appl.2010, 4, 271.
34. Ho, S.-L.; Xu, D.; Wong, M. S.; Li, H.-W.; Chem. Sci.2016, 7, 2695.
35. Jones, V. S.; Wu, J.; Zhu, S.-W.; Huang, R.-P.; Expert Rev. Mol. Med.2016, 18, e15.
36. Logan, C.; Todorof, K.; Fiorillo, S. P.; Campbell, T. B.; Elder, J. H.; Borok, M.; Gudza, I.; Gwanzura, L.; Ndemera, B.; Lochhead, M. J.; Benson, C. A.; Schooley, R. T.; PLoS One
2016, 11, e0163616.
37. Shen, W.; Zhang, J.; Mao, G.; Jiang, K.; Zhu, Q.; Biol. Pharm. Bull.2009, 32, 1496.
38. Bicalho, B.; Chen, L. S.; Grognux, J.; Reymond, J.-L.; Marsaioli, A. J.; J. Braz. Chem. Soc.2004, 15, 911.
Submitted: July 17, 2017
Published online: October 17, 2017