HESSD
12, 10921–10974, 2015Experimental evidence of condensation-driven
airflow
P. Bunyard et al.
Title Page
Abstract Introduction
Conclusions References
Tables Figures
◭ ◮
◭ ◮
Back Close
Full Screen / Esc
Printer-friendly Version Interactive Discussion
Discussion
P
a
per
|
Discussion
P
a
per
|
Discussion
P
a
per
|
Discussion
P
a
per
Hydrol. Earth Syst. Sci. Discuss., 12, 10921–10974, 2015 www.hydrol-earth-syst-sci-discuss.net/12/10921/2015/ doi:10.5194/hessd-12-10921-2015
© Author(s) 2015. CC Attribution 3.0 License.
This discussion paper is/has been under review for the journal Hydrology and Earth System Sciences (HESS). Please refer to the corresponding final paper in HESS if available.
Experimental evidence of
condensation-driven airflow
P. Bunyard1, M. Hodnett2,a, G. Poveda3, J. D. Burgos Salcedo4, and C. Peña5 1
IDEASA, Universidad Sergio Arboleda, Bogotá, Colombia
2
Centre for Ecology & Hydrology, Wallingford, UK
3
Department of Geosciences and Environment, Universidad Nacional de Colombia, Sede Medellín, Colombia
4
Corporación para la Investigación y la Innovación – CIINAS, Bogotá, Colombia
5
Facultad de Matemática, Universidad Sergio Arboleda, Bogotá, Colombia
a
retired
Received: 20 August 2015 – Accepted: 5 October 2015 – Published: 27 October 2015
Correspondence to: P. Bunyard ([email protected])
HESSD
12, 10921–10974, 2015Experimental evidence of condensation-driven
airflow
P. Bunyard et al.
Title Page
Abstract Introduction
Conclusions References
Tables Figures
◭ ◮
◭ ◮
Back Close
Full Screen / Esc
Printer-friendly Version Interactive Discussion
Discussion
P
a
per
|
Discussion
P
a
per
|
Discussion
P
a
per
|
Discussion
P
a
per
|
Abstract
The dominant “convection” model of atmospheric circulation is based on the premise that hot air expands and rises, to be replaced by colder air, thereby creating horizontal surface winds. A recent theory put forward by Makarieva and Gorshkov (2007, 2013) maintains that the primary motive force of atmospheric circulation derives from the
5
intense condensation and sharp pressure reduction that is associated with regions where a high rate of evapotranspiration from natural closed-canopy forests provides the “fuel” for cloud formation. The net result of the “biotic pump” theory is that moist air flows from ocean to land, drawn in by the pressure changes associated with a high rate of condensation.
10
To test the physics underpinning the biotic pump theory, namely that condensation of water vapour, at a sufficiently high rate, results in an uni-directional airflow, a 5 m tall
experimental apparatus was designed and built, in which a 20 m3body of atmospheric
air is enclosed inside an annular 14 m long space (a “square donut”) around which it can circulate freely, allowing for rotary air flows. One vertical side of the apparatus contains
15
some 17 m of copper refrigeration coils, which cause condensation. The apparatus contains a series of sensors measuring temperature, humidity and barometric pressure every five seconds, and air flow every second.
The laws of Newtonian physics are used in calculating the rate of condensation inside the apparatus. The results of more than one hundred experiments show a highly
20
significant correlation, withr2>0.9, of airflow and the rate of condensation. The rotary air flows created appear to be consistent both in direction and velocity with the biotic pump hypothesis, the critical factor being the rate change in the partial pressure of water vapour in the enclosed body of atmospheric air. Air density changes, in terms of kinetic energy, are found to be orders of magnitude smaller than the kinetic energy of
25
partial pressure change.
HESSD
12, 10921–10974, 2015Experimental evidence of condensation-driven
airflow
P. Bunyard et al.
Title Page
Abstract Introduction
Conclusions References
Tables Figures
◭ ◮
◭ ◮
Back Close
Full Screen / Esc
Printer-friendly Version Interactive Discussion
Discussion
P
a
per
|
Discussion
P
a
per
|
Discussion
P
a
per
|
Discussion
P
a
per
terms of predicting the consequences of widespread deforestation, but also for better understanding the atmospheric processes which lead to air mass convection.
1 Introduction
Atmospheric convection, which leads to air mass circulation, is generally considered to result from the lower atmosphere acting as a heat engine, with the kinetic energy for
5
convection deriving from differences in temperature, according to the general principle that hot air rises and cold air sinks. However, as Makarieva et al. (2013) point out, when hot air rises in the lower atmosphere it cools because of expansion and when the same, but now cooler, air sinks it heats up, such that the overall gain or loss in kinetic energy is zero. The same cooling and heating happens when air expands and forces
10
air elsewhere to compress; there is no net energy gain to do work. In other words, a strict application of the first law of thermodynamics to the atmosphere would yield a rate of kinetic energy generation equal to zero.
Instead, the same authors (2013) present the notion that the potential energy, derived from an outside source (the Sun), is stored in the evapotranspiration of water
15
which, on condensing, converts into kinetic energy, and so drives the process of air mass convection. During daylight hours closed-canopy forests pump more than double the quantity of water vapour per square metre of surface compared to the ocean in the same latitude, the net result being that condensation in cloud-forming over the forest causes surface air to flow upwards, thereby generating low pressure at the surface
20
which, in turn, establishes an ocean-to-land pressure gradient (Makarieva et al., 2013, 2014).
By means of evapotranspiration, rainforests, whether in the equatorial tropics or in boreal regions during summer months, feed the lower atmosphere with water vapour, up to some 3 % of atmospheric pressure, and thereby provide the source material
25
HESSD
12, 10921–10974, 2015Experimental evidence of condensation-driven
airflow
P. Bunyard et al.
Title Page
Abstract Introduction
Conclusions References
Tables Figures
◭ ◮
◭ ◮
Back Close
Full Screen / Esc
Printer-friendly Version Interactive Discussion
Discussion
P
a
per
|
Discussion
P
a
per
|
Discussion
P
a
per
|
Discussion
P
a
per
|
point of view, it is the hydrological cycle, including water evaporation and condensation, which drives convection and therefore the circulation of the air masses. That is in sharp contrast to the orthodox view of convection and air mass circulation, which explains the
movement of the air mass through latitudinal differences, helped on by the release of
latent heat.
5
The proposition that a high rate of evapotranspiration from forested regions is a prime mover of major air mass convection has remained contentious. Meesters et al. (2009) rejected the BPT on the grounds that the ascending air motions induced by the evaporative/condensation force would rapidly restore hydrostatic equilibrium and thereby become extinguished. In reply Makarieva et al. (2009) pointed out that
10
condensation removed water vapour molecules from the gas phase and reduced the weight of the air column. That removal must disturb hydrostatic equilibrium and make air circulate under the action of the evaporation/condensation force (Makarieva, 2009). The mass of an air column is equal to the number of air molecules in the column multiplied by their molecular masses. When the number of air molecules in the column
15
is preserved, its weight remains unchanged and independent of density. Hence, heating of the air column does not change its weight. In contrast, condensation changes the number of gas molecules in the air column and instantaneously reduces
the weight of the air column irrespective of the effects it might have on air density
(Makarieva, 2009). In effect, the BPT states that the major physical cause of
20
moisture fluxes is not the non-uniformity of atmospheric and surface heating, but that water vapour is invariably upward-directed as a result of the rarefaction of air from condensation (Makarieva, 2013).
The BPT, therefore, maintains that the air pressure sustains its disequilibrium because of the reduction in total weight of the air column as condensation occurs,
25
HESSD
12, 10921–10974, 2015Experimental evidence of condensation-driven
airflow
P. Bunyard et al.
Title Page
Abstract Introduction
Conclusions References
Tables Figures
◭ ◮
◭ ◮
Back Close
Full Screen / Esc
Printer-friendly Version Interactive Discussion
Discussion
P
a
per
|
Discussion
P
a
per
|
Discussion
P
a
per
|
Discussion
P
a
per
expanding and cooling moist air sustains the continuous process of condensation and does not allow the hydrostatic equilibrium of air as a whole to set in. The motion continues as long as there is water vapour in the rising air to sustain condensation (Makarieva, 2009). Within the concept of the biotic pump it is the physical mechanism of condensation which drives the upward airflow in the lower atmosphere by removing
5
molecules from the air column, and thus generates the surface horizontal winds, such as the Trade Winds.
Evidence in favour of the BPT has come from a number of different sources.
Makarieva et al. (2007, 2013) refer to data showing that precipitation over river basins which are covered in forest remains as high in the deep interior of the continent as at
10
the coast, whereas river basins without forest show an exponential decline in rainfall as one passes from the coast inland. Spracklen et al. (2012) have shown from their recent pan-tropical study of rainfall and land-cover, as indicated by the leaf area index (LAI), that satellite-derived rainfall measurements are positively correlated with the degree to which model-derived air trajectories have been exposed to forest cover. Even though
15
Makarieva and colleagues (2014) have some essential criticisms of the methodology used by Spracklen, they conclude that the Spracklen results confirm the influence of forest on regional rainfall patterns.
In a recent study, Poveda et al. (2014) provide evidence that when the low level jet streams pass over forested regions, precipitation levels stay high and constant,
20
whereas over regions which lack forest, precipitation levels decline exponentially, just as the BPT suggests should happen. Poveda and his colleagues look at the low level Chocó jet and comment that the change in direction of the Pacific Austral Trade Winds
from Easterlies to Westerlies just over the Equator at 4◦N, may owe their abrupt
switch in great part to the unsurpassed degree of evapotranspiration and subsequent
25
condensation over the Chocó rainforest in Colombia.
With more than 380 000 m3 per second of water vapour being brought in from the
Tropical Atlantic Ocean, (Salati, 1987) the Amazon Basin functions on a far grander
HESSD
12, 10921–10974, 2015Experimental evidence of condensation-driven
airflow
P. Bunyard et al.
Title Page
Abstract Introduction
Conclusions References
Tables Figures
◭ ◮
◭ ◮
Back Close
Full Screen / Esc
Printer-friendly Version Interactive Discussion
Discussion
P
a
per
|
Discussion
P
a
per
|
Discussion
P
a
per
|
Discussion
P
a
per
|
high over the rainforest to increase the volume of the Amazonian atmospheric river in the form of the South American Low Level Jet Stream as it approaches the western reaches of the Amazon Basin and is then deflected both upwards and southwards on encountering the Andes (Marengo, 2006; Poveda, 2014).
Builes-Jaramillo and Poveda (2015) have now extended their research to look
5
at possible correlations between the flow of the Northwest Trade winds and the
different seasons encountered over the Amazon Basin. They have found an inverse
correlation between sea surface temperatures (SSTs) in the North Tropical Atlantic and an increase in the seasonal index of precipitation minus evapotranspiration (P-E). Whereas the SST has a minimum in February, the P-E for the Amazon shows
10
a maximum in March. Vice versa the P-E has a minimum in August followed by an SST maximum in September. Sea surface temperatures are influenced by the velocity of the surface winds, the Northwest Trade Winds, and the evaporation of water. The rainy season over the rainforest in March is associated with dense clouds and condensation. On the basis of the BPT, intense condensation will lead to stronger surface winds
15
over the North Tropical Atlantic; hence their lower temperatures. The corollary is that reduced cloud formation over Amazonia will lead to reduced surface flow of the Trade Winds; hence higher SSTs. These findings have considerable implications for global climate, indicating that widespread deforestation could lead to warmer SSTs and therefore presumably to more extreme climatic events, including hurricanes, over
20
the tropical North Atlantic.
Overall, the evidence for the BPT is accumulating, but contention will remain until the physics underlying the convection model and the BPT can be clearly defined and distinguished. For that reason, this paper describes an attempt to study the physics in a laboratory setting.
HESSD
12, 10921–10974, 2015Experimental evidence of condensation-driven
airflow
P. Bunyard et al.
Title Page
Abstract Introduction
Conclusions References
Tables Figures
◭ ◮
◭ ◮
Back Close
Full Screen / Esc
Printer-friendly Version Interactive Discussion
Discussion
P
a
per
|
Discussion
P
a
per
|
Discussion
P
a
per
|
Discussion
P
a
per
2 Methodology
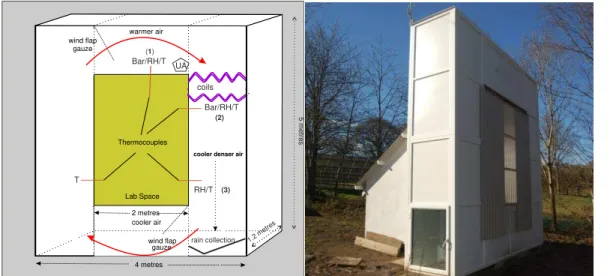
To test the underlying physics of the impact of condensation upon airflow, the idea was conceived of an enclosed structure which would allow a measurable air circulation to take place under conditions of controlled condensation. The structure (Fig. 1) consists of two columns, made of insulated PVC, 4.8 m high, with a cross-sectional area of
5
1.44 m2, connected at the top and bottom by “tunnels” 2.4 m long with the same
cross-sectional area of 1.44 m2. On account of small leaks some mixing of the enclosed air
with the external air may take place, but the dynamics of each experiment swamp the impact of any such exchanges, and to all intents and purposes the structure is leak-proof. However, despite the insulation, the structure is affected by external temperature
10
and by differential insolation. The effect of external insolation is measurable by means of directional airflow and is accounted for in determining the relationship between the rate of condensation and consequent airflow.
Access to each column is by means of an insulated PVC door, with double glazing to allow a view inside. A double-layer of copper refrigeration coils, 17 m in length and
15
12 mm in external diameter, are located 3.4 m up the right-hand column, approximately 20 cm down from the junction between the column and the upper tunnel. The total surface area of the coils, taking a 3.0 mm coating of ice into account, is 0.96 m2; they are connected to an industrial compressor located some 3 m away on the floor of the laboratory. The laboratory is contained within a lean-to. The right-hand column, as
20
viewed from within the laboratory, and as shown in Fig. 1, is likely to get more insolation, because of its easterly orientation, than the left-hand column which is shaded from the southerly sun by beech trees. That difference in orientation results in the “default” air movement being counter-clockwise, with air rising in the “right” column and sinking in the “left”.
25
HESSD
12, 10921–10974, 2015Experimental evidence of condensation-driven
airflow
P. Bunyard et al.
Title Page
Abstract Introduction
Conclusions References
Tables Figures
◭ ◮
◭ ◮
Back Close
Full Screen / Esc
Printer-friendly Version Interactive Discussion
Discussion
P
a
per
|
Discussion
P
a
per
|
Discussion
P
a
per
|
Discussion
P
a
per
|
and tunnels. The Gill 2-D ultrasonic anemometer (UA), measuring every second, is located 15 cm up from the floor of the upper tunnel and some 5 cm from the junction between the tunnel and the right-hand column. When the airflow in the upper tunnel is direct from the left-hand column to the right-hand column the directionality is given as 180◦
and is close to either 360 or 0◦
when the flow is reversed. (See Fig. 1).
5
Prior to the initiation of an experiment, the entrapped air, having been in contact with the external environment, displays similar characteristics as the air outside in terms of temperature, pressure and humidity. However, once the doors, located at the bottom of each column, are closed the structure remains sufficiently airtight to permit the changes to temperature, to humidity and to local pressure brought about during the course of
10
an experiment to be observed and recorded. The relative humidity can be reduced to 30 % in the enclosed air through the use of an industrial dehumidifier. The dehumidifier
is always switched off and any collected water taken away before an experiment is
begun.
Standard physics is applied to the results (Mcllveen, 2010), with separate
15
calculations for the top tunnel (1), the parcel of air affected per second at the cooling coils (2), and the lower section of the right hand column (3). To determine the partial pressure of water vapour at 5 s intervals, the standard Clausius–Clapeyron equation
is used. Since at an atmospheric pressure of 1013.25 hPa, p2, water boils at 373 K,
represented asT2it is possible to substitute forp2andT2, and at each temperature,T1,
20
to determine the saturated partial pressure of water, p1, for the three locations (1, 2
and 3). (See Fig. 1, Eqs. 1 and 2).
lnp2 p1 =
Q(T2−T1)
RT2T1 (1)
Or
logp2− Q(T2−T1)
RT2T1·2.303 =logp1 (2)
HESSD
12, 10921–10974, 2015Experimental evidence of condensation-driven
airflow
P. Bunyard et al.
Title Page
Abstract Introduction
Conclusions References
Tables Figures
◭ ◮
◭ ◮
Back Close
Full Screen / Esc
Printer-friendly Version Interactive Discussion
Discussion
P
a
per
|
Discussion
P
a
per
|
Discussion
P
a
per
|
Discussion
P
a
per
WhereQ, Latent heat of Evaporation,=40.65 kJ mol−1andR, the ideal gas constant, is
8.3 J K−1mol−1. The actual partial pressure of water vapour,p
1 in the three locations, is given by multiplying the result by the relative humidity, RH, as measured by the hygrometers, placed in all three locations (Fig. 1).
The air density, at that moment in time, is obtained through the use of the equation
5
of state for ideal gases, namely,
p= ρRT, (3)
where p is the barometric pressure (hPa), ρ is the air density in kg m−3, R is the
ideal gas constant, J K−1mol−1andT is the temperature in Kelvin. SinceR varies with
the degree of humidity in the air, the equation as below is applied, using the values
10
287 J K−1kg−1for dry air and 461 J K−1kg−1for water vapour:
R=(461·r)+(1−r)·287 (4)
r is the absolute humidity of water vapour in dry air, hence kg of water vapour per kg of
dry air. The value ofR, the ideal gas constant for moist air, as water vapour is added or removed, is shown to vary by as much as 1.5, for example, from 288.9 to 287.5 during
15
the course of an experiment.
To obtainr we need first to obtainq, the absolute humidity of water vapour kg per kg of moist air using (Mcllveen, 2010):
q= (0.622·pwv)
patmos−pwv, (5)
where 0.622 is the ratio of the effective molecular weights of water vapour and dry
20
air, hence 18/29;patmosis the barometric reading at that moment in time for the three
locations and pwv is the partial pressure of water vapour, as calculated at the same
time of reading. Then, to convertq, the absolute humidity for moist air, to the absolute humidity for dry air,r, the following formula is used:
r= q
1 q. (6)
HESSD
12, 10921–10974, 2015Experimental evidence of condensation-driven
airflow
P. Bunyard et al.
Title Page
Abstract Introduction
Conclusions References
Tables Figures
◭ ◮
◭ ◮
Back Close
Full Screen / Esc
Printer-friendly Version Interactive Discussion
Discussion
P
a
per
|
Discussion
P
a
per
|
Discussion
P
a
per
|
Discussion
P
a
per
|
To calculate the absolute humidity,h(water vapour in grams per cubic metre of moist
air), the values ofq andρ, (the air density in kg m−3
) are required, as are the values forR andT.
The air density, ρ, in kg m−3, is obtained using the ideal gas equation, where the
barometric pressure is given in Pascals:
5
p
RT = ρ (7)
Therefore the humidity in grams per cubic metre of moist air will be obtained from:
h=q ρ1000 (8)
In order to obtain the kinetic energy values changes in the partial pressure of water vapour and in air density the following relationship is applied:
10
J=kg·m 2
s2 =Nm=Pa·m
3
=Ws (9)
Whereby J is joules, N is Newtons, Pa is Pascals and W is Watts. Thereby, the Ws for both the partial pressure change in the condensing parcel of air and the change in air density can be calculated. The resulting quantity can then be converted into the velocity of the airflow (Boyle, 1998):
15
Ws=0.5·ρ·A·v3, (10)
where W is Ws,ρis the air density in kg m−3andv3is the cube of the velocity (m s−1).
The area, A, is taken as the surface area of the condensing coils, 0.963 m2. Good
correspondence is obtained graphically when the calculated airflow is compared with the actual measured airflow (see Fig. 26). Equation (10) gives the ideal relationship
20
HESSD
12, 10921–10974, 2015Experimental evidence of condensation-driven
airflow
P. Bunyard et al.
Title Page
Abstract Introduction
Conclusions References
Tables Figures
◭ ◮
◭ ◮
Back Close
Full Screen / Esc
Printer-friendly Version Interactive Discussion
Discussion
P
a
per
|
Discussion
P
a
per
|
Discussion
P
a
per
|
Discussion
P
a
per
the air depends precisely on the velocity and therefore adds length to the surface area when calculating the volume.
The three variables of temperature, barometric pressure and relative humidity are all that is required to calculate the partial pressure of water vapour, using the exponential equation of Clausius–Clapeyron, (Eqs. 1 and 2) and from that the absolute humidity
5
and air density, (Eqs. 7 and 8) at any moment in time. It is then a simple task to convert the change in partial pressure at various points in the structure to kinetic energy in terms of Watt-seconds (Eqs. 7 and 8). Equally, the changing air densities of the same parcels of air can be converted to kinetic energy, making direct comparisons possible between the potential forces (Eq. 9).
10
The physics used in the calculations presented here are encapsulated in the following flow chart, which serves the experimental data as well as the data from radio-soundings and surface meteorological stations (Bunyard, 2014; Bunyard et al., 2012).
3 Results
More than 100 experiments, each lasting approximately 50 min, demonstrate that
15
sudden changes in the partial pressure of water vapour at the point of cooling lead to a measurable, clockwise circulation of air, which increases and decreases according to the rate of change of the partial pressure. The relationship follows a power law
between the rate of change in the partial pressure of water vapour (hPa s−1) and the
airflow (m s−1
). It results in a circulation throughout the 14 m length of the experimental
20
structure as air is drawn from the top tunnel into the area of condensation and then downwards, passing in a clockwise direction from the right-hand column to the left column and upwards into the upper connecting tunnel (Fig. 1). In terms of power delivered (kinetic energy as Ws) the condensation of water vapour, in a chilled parcel of air with a volume some 430 times smaller than that of the total volume of enclosed air,
25
HESSD
12, 10921–10974, 2015Experimental evidence of condensation-driven
airflow
P. Bunyard et al.
Title Page
Abstract Introduction
Conclusions References
Tables Figures
◭ ◮
◭ ◮
Back Close
Full Screen / Esc
Printer-friendly Version Interactive Discussion
Discussion
P
a
per
|
Discussion
P
a
per
|
Discussion
P
a
per
|
Discussion
P
a
per
|
measured for the same parcel of air, the difference in magnitude corresponding to the
relative “dryness” of the air (see Fig. 3 and Eq. 9).
Through taking account of changes in temperature, relative humidity and barometric pressure from the strategically-placed sensors (Fig. 1, Eq. 2 to 9), the different forces which come into play can be distinguished, namely:
5
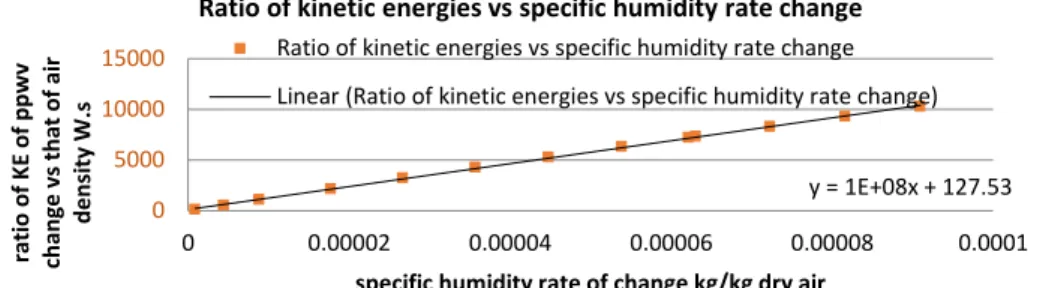
1. Changes in the partial pressure of water vapour through condensation, melting and re-evaporation (Experiments 1 to 4, Figs. 4, 6, 8, 10, and 25) and their correspondence to airflow;
2. Changes in the air density of the chilled parcel air, measured in Watts as it passes over the cooling coils with comparisons to the kinetic energy of partial pressure
10
change from condensation (Experiments 1 to 4, Figs. 15, 16, 17, and 18);
3. The ideal airflow (Eqs. 9 and 10, Figs. 26 and 27) and how the airflow caused by condensation overcomes the airflow in the counter direction caused by external differential heating of the two columns (Figs. 4, 5, and 25).
The airflow and condensation profiles for the four experiments shown result from
15
different internal conditions, including temperature, relative humidity and differential
heating, with the proviso that those internal conditions are affected over time by
external conditions. In particular, small air exchanges between the external and internal environment take place over the course of time between experiments, but without
impacting an experiment in course. The internal temperature is measurably affected
20
by the external temperature and will register differential heating if the sun happens to be shining on one side of the structure, while the other remains in shade.
In all experiments, without exception, once the compressor is on and refrigeration takes place the directionality is close to 180◦
and therefore the airflow is clockwise as seen from the viewpoint of the laboratory. The airflow velocity is determined by
25
HESSD
12, 10921–10974, 2015Experimental evidence of condensation-driven
airflow
P. Bunyard et al.
Title Page
Abstract Introduction
Conclusions References
Tables Figures
◭ ◮
◭ ◮
Back Close
Full Screen / Esc
Printer-friendly Version Interactive Discussion
Discussion
P
a
per
|
Discussion
P
a
per
|
Discussion
P
a
per
|
Discussion
P
a
per
rate of change in the absolute (specific) humidityr (Eq. 5 to 8, Figs. 11, 12, 13, and
14). When the initial airflow is counter-clockwise (Fig. 4 and 5), the airflow resulting from condensation takes over, and just as a cyclist battles against a headwind, so the condensation airflow is reduced from what it would be were there no “headwind”. Hence, accounting for headwind, the airspeed in experiment 1 would be>0.2 m s−1
.
5
The rate of change in specific humidity for the four experiments is seen in the following graphs (Figs. 11, 12, 13, and 14).
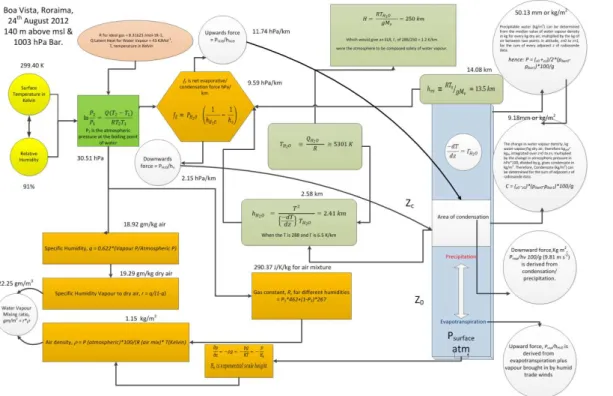
By means of applying the equations of state for water vapour and specifically Eq. (9), the kinetic energies of the rate of change in the partial pressure of water vapour from condensation and of the air density in the same parcel of cooled air can be calculated.
10
The resulting curves are shown in Figs. 15, 16, 17, and 18, and in each instance, at a particular moment in time, the ratio of air density change to that of partial pressure change can be determined.
With airflows of 0.15 m s−1, each parcel of air will take some 0.33 s to traverse the
0.05 m distance from the top to the bottom of the coils. Empirical evidence of the proper
15
application of physical laws for ideal gases (Clausius–Clapeyron) is apparent through comparing the weight of condensed water obtained from the capture of precipitated water, with that obtained from theoretical considerations of the change in partial pressure of water vapour and hence in absolute humidity. The “rain” is gathered by means of a sloping-plane, hard plastic sheet, with a gutter at its lowest end. Any drops
20
which fail to run into the gutter are mopped up with absorbent cloths and weighed.
By measuring (at location 2 in Fig. 1) the changes in humidityhper second taking
place in the parcels of air passing through the condenser, a profile of the changing water vapour content of the air is obtained (Eq. 8). The experiment of 8 February 2015,
when the initial temperature was−1.32◦C and the barometric pressure 1038.85 hPa,
25
HESSD
12, 10921–10974, 2015Experimental evidence of condensation-driven
airflow
P. Bunyard et al.
Title Page
Abstract Introduction
Conclusions References
Tables Figures
◭ ◮
◭ ◮
Back Close
Full Screen / Esc
Printer-friendly Version Interactive Discussion
Discussion
P
a
per
|
Discussion
P
a
per
|
Discussion
P
a
per
|
Discussion
P
a
per
|
In general, the compressor for the cooling coils is switched off15 min before the end of the experiment at 50 min. That period allows the temperature to increase throughout the structure, and in particular in the section with the coolant coils, such that the ice melts and the liquid water falls as rain (sometimes as hail) onto the collecting sheet which lies under the coils at the base of the right-hand column. Calculations of the
5
expected fallout of rain accord closely to that collected (Figs. 19, 20, and 21).
When the initial relative humidity is low, i.e. less than 40 %, the ice-condensate on the coils is found to ablate directly into water vapour and hence cannot be collected. Calculations of the expected fallout of rain from an experiment take account of the increase in absolute and relative humidity resulting from any such ablation. For
10
instance, for Experiment 4, when the initial relative humidity had been reduced to 31 %, the quantity of rain collected at the conclusion of the experiment at 50 min amounted to 2 grams and the calculation of the expected fallout from changes in the humidity of the enclosed air in the experimental structure was 1.2 grams (Fig. 21).
When the final relative humidity in the experimental structure is above 60 % then
15
ablation appears to be minimal and the ice on the coils falls as rain as seen in Figs. 19 and 20.
The experimental results make it clear that the key to airflow resides in the rate of partial pressure change. The latent heat release, of the same kinetic energy as that from negative pressure change, by warming the air and making it less dense, tends to
20
generate a counter flow to that from water vapour condensation. Taking gravitational considerations into account the air moves downwards to the cooling coils rather than upwards, thus generating a clockwise circulation.
Each experiment, under different initial conditions and, during the course of the
experiment generating its own particular conditions, follows the same pattern in
25
HESSD
12, 10921–10974, 2015Experimental evidence of condensation-driven
airflow
P. Bunyard et al.
Title Page
Abstract Introduction
Conclusions References
Tables Figures
◭ ◮
◭ ◮
Back Close
Full Screen / Esc
Printer-friendly Version Interactive Discussion
Discussion
P
a
per
|
Discussion
P
a
per
|
Discussion
P
a
per
|
Discussion
P
a
per
just beside the cooling coils (Fig. 1). That fall in pressure should be contrasted with the barometric readings from above the coils, in the upper tunnel at site No. 1 (Fig. 1). The fall in pressure at location 2, while the compressor is running, can be interpreted as signalling the proximate reduction in pressure as condensation occurs. The increase in barometric pressure above the condensation coils in location 1, Fig. 1, could be
5
registering the increase in air density from a simultaneous drop in temperature and in absolute humidity (Figs. 22 and 23).
If all the kinetic energy release from condensation and the reduction in partial pressure of water vapour were focussed into a single uni-directional flow, then the ideal flow would be given by Eq. (10), the straight line being determined by taking the log of
10
both axes (Fig. 24).
On account of the implosive pressure change as a result of condensation, the kinetic energy release will be from all angles. Nevertheless, flow tendencies will result because of other factors, such as gravity or, in the case of the atmosphere at large, the effect of the upper jet streams on the columns of air below. As a result, the ideal flow will
15
not be encountered in the experiment, nor indeed in the atmosphere at large. In the experiments, the actual uni-directional flow from condensation is found to approximate one-fifth of the ideal flow. (Figs. 25 and 26). In all experiments, despite the different initial conditions and the timing and duration of the period of refrigeration, the close association between the airflow and the rate of change in the partial pressure of water
20
vapour is to be seen, as shown in Figs. 4, 6, 8, 10, and 25.
From the data, the kinetic energy in Watt-seconds can be calculated: (1) derived from the partial pressure change in water vapour, (2) from the air density rate change at the point of cooling, (3) the latent heat release (Fig. 27). The results are uniform and unequivocal in that the kinetic energy release from the imploding parcel of air, subjected
25
to refrigeration, at an approximate rate of 0.33 s per parcel of volume 0.048 m3, when
the unidirectional clockwise velocity of air is 0.15 m s−1
HESSD
12, 10921–10974, 2015Experimental evidence of condensation-driven
airflow
P. Bunyard et al.
Title Page
Abstract Introduction
Conclusions References
Tables Figures
◭ ◮
◭ ◮
Back Close
Full Screen / Esc
Printer-friendly Version Interactive Discussion
Discussion
P
a
per
|
Discussion
P
a
per
|
Discussion
P
a
per
|
Discussion
P
a
per
|
over the same time period, the difference depending on the relative humidity at the start of each experiment (Figs. 3, 15, 16, 17, and 18).
The correspondence between the airflow (m s−1) and the partial pressure change
(hPa) becomes clear from more than one hundred experiments when analysed against the rate of change per second of the specific (absolute) humidity. The relationship
5
between the partial pressure change in water vapour and the change in specific humidity follows a straight line through the origin with anr2of 0.9956; the relationship of the airflow to the change in specific humidity follows a power law curve with anr2of 0.964 (Fig. 28).
Meanwhile the relationship between the airflow and the change in partial pressure of
10
water vapour follows a power law, as expected, with anr2 of 0.9761. The ideal curve
of the airflow from the kinetic energy of the partial pressure change closely follows the trajectory of the measured airflow (Fig. 29).
The chilled parcel of air not only has a kinetic energy equivalent to three orders of magnitude less than that of the change in the partial pressure of water vapour but the
15
correlation with the airflow is substantially weaker than is seen with either the change in absolute humidity or the partial pressure change (Fig. 30).
Finally, significant correlations are encountered when the changing rate of partial pressure as a result of condensation is matched against airflow, as seen in Figs. 31 and 32 for two different experiments.
20
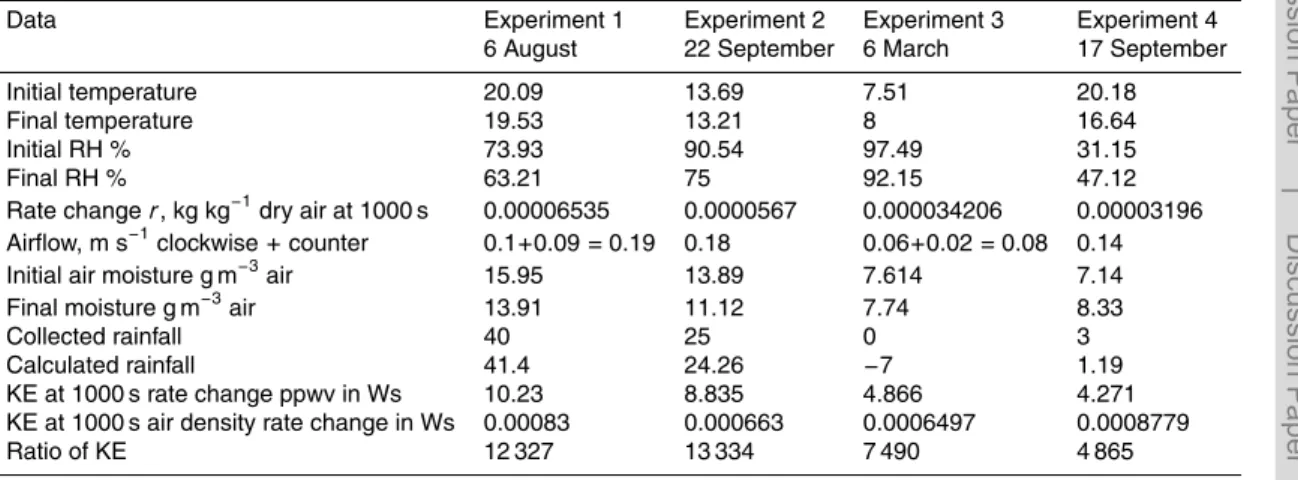
Table 1 displays data derived from the right-hand column of Experiments 1 to 4.
4 Discussion
The highly significant difference in the kinetic energy value of the observed partial
pressure change compared to that of the observed air density change in the same cooled parcel of air suggests that the notion of the fundamental importance of water
25
HESSD
12, 10921–10974, 2015Experimental evidence of condensation-driven
airflow
P. Bunyard et al.
Title Page
Abstract Introduction
Conclusions References
Tables Figures
◭ ◮
◭ ◮
Back Close
Full Screen / Esc
Printer-friendly Version Interactive Discussion
Discussion
P
a
per
|
Discussion
P
a
per
|
Discussion
P
a
per
|
Discussion
P
a
per
thermal radiation, and is ultimately lost to the environment. The latent heat release from condensation in terms of kinetic energy is equal to kinetic energy calculated for the partial pressure change resulting from the same condensation (Fig. 27). That confirms the physical relationship between partial pressure change and the energy involved in the phase transformation from vapour to liquid and ice, the latter being measurable after
5
it melts and falls, either as rain or hail. Even though the latent heat is dissipated to the surrounding air, thus offsetting the cooling from the refrigeration coils, and in principle tending to cause the air to rise rather than sink, in a counter-clockwise motion, the circulation still flows in a clockwise direction.
Given the ratio between the air density change and partial pressure change in the
10
same parcel of air, we conclude that theforce majeurein causing the circulation is the
partial pressure change. Meanwhile, the clockwise directionality in the experimental
structure is the result of the relative mass difference between the volume of air
above the cooling coils compared to that below; hence more than three times of air mass below compared to above. Given the experimental set-up, the net result of the
15
difference in air mass above and below the cooling coils is that the drawing in of air
as the partial pressure reduces will more easily be from above rather than below. Once the circulation is set in motion it is maintained preferentially by the flow of air from above which in its turn undergoes cooling and condensation. In general, at an airflow averaging 0.15 m s−1, three parcels of air of volume 0.048 m3should pass over
20
the coils per second. The cooler air below the coils will increase the likelihood of the flow during condensation being in the clockwise direction, although as pointed out, the energies involved are negligible compared to the energies liberated when water vapour condenses.
During some experiments, especially when the summer sun was differentially heating
25
HESSD
12, 10921–10974, 2015Experimental evidence of condensation-driven
airflow
P. Bunyard et al.
Title Page
Abstract Introduction
Conclusions References
Tables Figures
◭ ◮
◭ ◮
Back Close
Full Screen / Esc
Printer-friendly Version Interactive Discussion
Discussion
P
a
per
|
Discussion
P
a
per
|
Discussion
P
a
per
|
Discussion
P
a
per
|
sufficient to drive the airflow. That airflow, nonetheless, is generally weaker by one half or more than that obtained when cooling the coil-associated parcel of air, even though in volume it is 430 times smaller. That finding confirms that air density changes are considerably weaker in their impact on airflow than that of partial pressure change brought about through condensation.
5
Makarieva (2007) argues that the high rate of condensation over the tropical rainforest, fed by evapotranspiration, will lead to surface airflow as a result of the pressure change (1200-fold reduction in volume of each gram molecule of water vapour condensed). If so, then the experimental findings, described in the previous section, and all based on the fundamental physics of ideal gases, can be extrapolated to the
10
wider arena of the earth’s atmosphere inasmuch as the same physics should prevail during cloud formation and dissipation.
The energies in evapotranspiration from the rainforest and natural ecosystems
are enormous when totalled for the entire 6 million km2 of the Amazon Basin, being
equivalent in brute energetic terms to 15 atomic bombs every second, (each 15
15
kT of TNT) (Salati, 1987). Equally, the conventional reason for the reduction in the
environmental lapse rate (ELR) from 9.8 to 5◦C or less per kilometre altitude when
the air is humid refers to the release of latent heat on condensation, which warms the surrounding air. That is certainly true, but based on the biotic pump principle, could it be that the rate of cooling reduces per altitude because warm surface air is sucked
20
upwards at a rate faster than were it to be dry air which consequently does not undergo condensation? That being the case, the high rate of condensation over the rainforest will increase horizontal flow and, as a result, the transportation of more water vapour from the tropical Atlantic Ocean. The experimental results provide a clue as to the expected airflow from a given rate of condensation (Figs. 28 and 29).
HESSD
12, 10921–10974, 2015Experimental evidence of condensation-driven
airflow
P. Bunyard et al.
Title Page
Abstract Introduction
Conclusions References
Tables Figures
◭ ◮
◭ ◮
Back Close
Full Screen / Esc
Printer-friendly Version Interactive Discussion
Discussion
P
a
per
|
Discussion
P
a
per
|
Discussion
P
a
per
|
Discussion
P
a
per
5 Conclusion
This paper describes a series of experiments, in a specially-designed structure, to test the physics of condensation and its potential to cause airflows. The results have provided data for a careful analysis of the physics involved, showing that condensation and the subsequent release of kinetic energy from the partial pressure change do
5
indeed account for the observed airflow. The experimental results therefore provide evidence that condensation and not buoyancy is the major mechanism driving airflow, thus lending strong support to one of the main tenets of the BPT.
The results are significant and unambiguous. At least at the laboratory scale, using only conventional physics, such as is employed in climatological studies, the primary
10
force driving convection appears to be the kinetic energy released in the implosive
events which take place during condensation, with a sudden reduction –>1200-fold –
in the air volume of one gram-molecule of water vapour (18 g) as it transforms to liquid and ice. Air density changes are shown to be orders of magnitude less important in convection processes compared to partial pressure changes on condensation.
15
The macro-physics of the experiment is not fundamentally different from that in the
lower atmosphere at large. The same laws apply and are widely used by hydrologists, meteorologists and climatologists. Those opposed to the biotic pump theory should therefore re-consider their position and take into account that the physics underlying the theory may not only be correct, but that it operates in the atmosphere at large.
20
The general implications are that the great forests of the world play a fundamental role in air mass circulation through providing water vapour via evapotranspiration, and are therefore the “fuel” for a high rate of cloud condensation. Airflow circulation is the net result, bringing the rain to the deep interior of continents. The Biotic Pump theory suggests that the hydrological role of rainforests is by far their most important
25
HESSD
12, 10921–10974, 2015Experimental evidence of condensation-driven
airflow
P. Bunyard et al.
Title Page
Abstract Introduction
Conclusions References
Tables Figures
◭ ◮
◭ ◮
Back Close
Full Screen / Esc
Printer-friendly Version Interactive Discussion
Discussion
P
a
per
|
Discussion
P
a
per
|
Discussion
P
a
per
|
Discussion
P
a
per
|
or emitters of greenhouse gases is relatively insignificant compared to their hydrological role.
Acknowledgement. The experimental structure with its equipment and the actual
experimen-tation made possible through the bounteous support from the Good Energies Foundation, Switzerland. Thanks too to Jaymart Ltd for having provided the matting to cover the flooring
5
of the structure. We are extremely grateful to Jon Tinker for his comments and suggestions in the preparation of this manuscript and to Francis Dufort for his help designing the structure.
References
Boyle, G.: Renewable Energy: Power for a Sustainable Future, Open University & Oxford University Press, Oxford, UK, 1998.
10
Builes-Jaramillo, A. and Poveda, G.: Seasonal and Interannual Feedbacks between Tropical North Atlantic SST and Amazonian Hydroclimatology, in press, 2015.
Bunyard, P. P.: How the Biotic Pump links the hydrological cycle and the rainforest to climate: Is it for real? How can we prove it?, F. d. Publicaciones, Bogotá, Cundinamarca, Colombia, University of Sergio Arboleda, 2014.
15
Bunyard, P., Netchev, P., Peña, C., and Redondo, J.: The Barometric Tidal Wave, What is it? STAHY 3rd International Conference on Hydrology, Tunis, 1–2 October 2012.
Makarieva, A. M. and Gorshkov, V. G.: Biotic pump of atmospheric moisture as driver of the hydrological cycle on land, Hydrol. Earth Syst. Sci., 11, 1013–1033, doi:10.5194/hess-11-1013-2007, 2007.
20
Makarieva, A. M. and Gorshkov, V. G.: Reply to A. G. C. A. Meesters et al.’s comment on ”Biotic pump of atmospheric moisture as driver of the hydrological cycle on land”, Hydrol. Earth Syst. Sci., 13, 1307–1311, doi:10.5194/hess-13-1307-2009, 2009.
Makarieva, A. M., Gorshkov, V. G., and Li, B.-L.: The key physical parameters governing frictional dissipation in a precipitating atmosphere, J. Atmos. Sci., 70, 2916–2929, 2013.
25
HESSD
12, 10921–10974, 2015Experimental evidence of condensation-driven
airflow
P. Bunyard et al.
Title Page
Abstract Introduction
Conclusions References
Tables Figures
◭ ◮
◭ ◮
Back Close
Full Screen / Esc
Printer-friendly Version Interactive Discussion
Discussion
P
a
per
|
Discussion
P
a
per
|
Discussion
P
a
per
|
Discussion
P
a
per
Makarieva, A. M., Gorshkov, V. G., Sheil, D., Nobre, A. D., Bunyard, P. P., and Li, B.-L.: Why does air passage over forest yield more rain? Examining the coupling between rainfall, pressure and atmospheric moisture content, J. Hydrometeorol., 15, 411–426, 2014.
Marengo, J. A.: On the hydrological cycle of the Amazon Basin: A historical review and current state-of-the-art, Revista Brasileira de Meteorologia, 21, 1–19, 2006.
5
Mcllveen, R.: Fundamentals of Weather & Climate, 2nd Edn., Oxford University Press, Oxford, 2010.
Meesters, A. G.: Comment on “Biotic pump of atmospheric moisture as driver of the hydrological cycle on land” by A. M. Makarieva and V. G. Gorshkov, Hydrol. Earth Syst. Sci., 11, 1013– 1033, 2007,
10
http://www.hydrol-earth-syst-sci.net/11/1013/2007/., Hydrol.Earth Syst. Sci., 13, 1299–1305, 2009.
Poveda, G.: On the existence of Lloro (the rainiest locality on Earth): enhanced ocean–land– atmosphere interaction by a low-level jet, Geophys. Res. Lett., 27, 1675–1678, 2000. Poveda, G. L.: Seasonal precipitation patterns along pathways of South American low-level jets
15
and aerial rivers, Water Resour. Res., 50, 98–118, 2014.
Salati, E.: The forest and the hydrological cycle, in: Geophysiology of Amazonia, edited by: Dickinson, R., Wiley & Sons, New York, 273–296, 1987.
Spracklen, D. V., Arnold, S. R., and Taylor, C. M.: Observations of increased tropical rainfall preceded by air passage over forests, Nature, 489, 282–285, 2012.
HESSD
12, 10921–10974, 2015Experimental evidence of condensation-driven
airflow
P. Bunyard et al.
Title Page
Abstract Introduction
Conclusions References
Tables Figures
◭ ◮
◭ ◮
Back Close
Full Screen / Esc
Printer-friendly Version Interactive Discussion
Discussion
P
a
per
|
Discussion
P
a
per
|
Discussion
P
a
per
|
Discussion
P
a
per
|
Table 1.Data from Experiments 1 to 4.
Data Experiment 1 Experiment 2 Experiment 3 Experiment 4
6 August 22 September 6 March 17 September
Initial temperature 20.09 13.69 7.51 20.18
Final temperature 19.53 13.21 8 16.64
Initial RH % 73.93 90.54 97.49 31.15
Final RH % 63.21 75 92.15 47.12
Rate changer, kg kg−1dry air at 1000 s 0.00006535 0.0000567 0.000034206 0.00003196
Airflow, m s−1clockwise+counter 0.1+0.09=0.19 0.18 0.06+0.02=0.08 0.14
Initial air moisture g m−3air 15.95 13.89 7.614 7.14
Final moisture g m−3air 13.91 11.12 7.74 8.33
Collected rainfall 40 25 0 3
Calculated rainfall 41.4 24.26 −7 1.19
KE at 1000 s rate change ppwv in Ws 10.23 8.835 4.866 4.271
KE at 1000 s air density rate change in Ws 0.00083 0.000663 0.0006497 0.0008779
HESSD
12, 10921–10974, 2015Experimental evidence of condensation-driven
airflow
P. Bunyard et al.
Title Page
Abstract Introduction
Conclusions References
Tables Figures
◭ ◮
◭ ◮
Back Close
Full Screen / Esc
Printer-friendly Version Interactive Discussion
Discussion
P
a
per
|
Discussion
P
a
per
|
Discussion
P
a
per
|
Discussion
P
a
per
warmer air
cooler air Temperature gradient
Thermocouples
Lab Space
cooler denser air wind flap
gauze
wind flap gauze
5
m
e
tr
e
s
4 metres 2 metres
5
m
e
tr
e
s
1.2 m etres rain collection
UA
Bar/RH/T
T
RH/T coils Bar/RH/T
( )1
(2)
(3)
HESSD
12, 10921–10974, 2015Experimental evidence of condensation-driven
airflow
P. Bunyard et al.
Title Page
Abstract Introduction
Conclusions References
Tables Figures
◭ ◮
◭ ◮
Back Close
Full Screen / Esc
Printer-friendly Version Interactive Discussion
Discussion
P
a
per
|
Discussion
P
a
per
|
Discussion
P
a
per
|
Discussion
P
a
per
|
HESSD
12, 10921–10974, 2015Experimental evidence of condensation-driven
airflow
P. Bunyard et al.
Title Page
Abstract Introduction
Conclusions References
Tables Figures
◭ ◮
◭ ◮
Back Close
Full Screen / Esc
Printer-friendly Version Interactive Discussion
Discussion
P
a
per
|
Discussion
P
a
per
|
Discussion
P
a
per
|
Discussion
P
a
per
y = 1E+08x + 127.53 0
5000 10000 15000
0 0.00002 0.00004 0.00006 0.00008 0.0001
rat
io o
f
K
E
of
ppwv
change
v
s
that
of
a
ir
dens
it
y
W.s
specific humidity rate of change kg/kg dry air Ratio of kinetic energies vs specific humidity rate change
Ratio of kinetic energies vs specific humidity rate change
Linear (Ratio of kinetic energies vs specific humidity rate change)
HESSD
12, 10921–10974, 2015Experimental evidence of condensation-driven
airflow
P. Bunyard et al.
Title Page
Abstract Introduction
Conclusions References
Tables Figures
◭ ◮
◭ ◮
Back Close
Full Screen / Esc
Printer-friendly Version Interactive Discussion
Discussion
P
a
per
|
Discussion
P
a
per
|
Discussion
P
a
per
|
Discussion
P
a
per
|
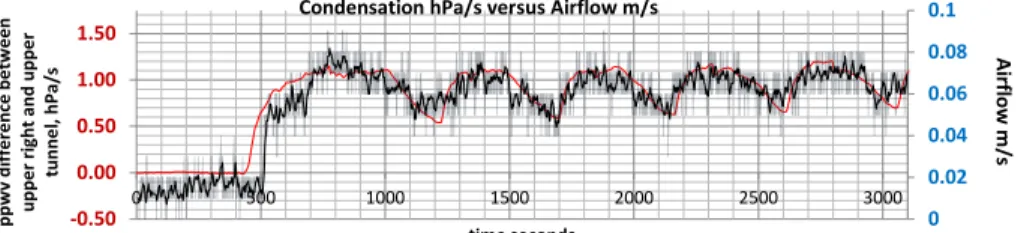
0 0.02 0.04 0.06 0.08 0.1
-0.25 0.75 1.75 2.75 3.75
0 500 1000 1500 2000 2500
ppwv
di
ff
e
re
nce
hP
a/s
fo
r
cool
e
d
parce
l of
a
ir
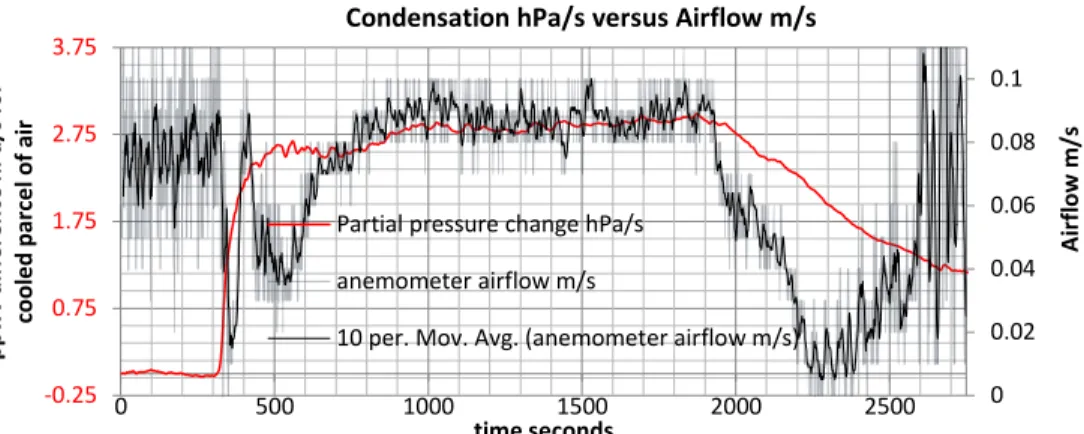
time seconds Partial pressure change hPa/s
anemometer airflow m/s
10 per. Mov. Avg. (anemometer airflow m/s) Condensation hPa/s versus Airflow m/s
A
ir
fl
ow m
/s
Figure 4.Experiment 1 (6 August 2015). Profile of condensate change hPa s−1 (red and left
HESSD
12, 10921–10974, 2015Experimental evidence of condensation-driven
airflow
P. Bunyard et al.
Title Page
Abstract Introduction
Conclusions References
Tables Figures
◭ ◮
◭ ◮
Back Close
Full Screen / Esc
Printer-friendly Version Interactive Discussion
Discussion
P
a
per
|
Discussion
P
a
per
|
Discussion
P
a
per
|
Discussion
P
a
per
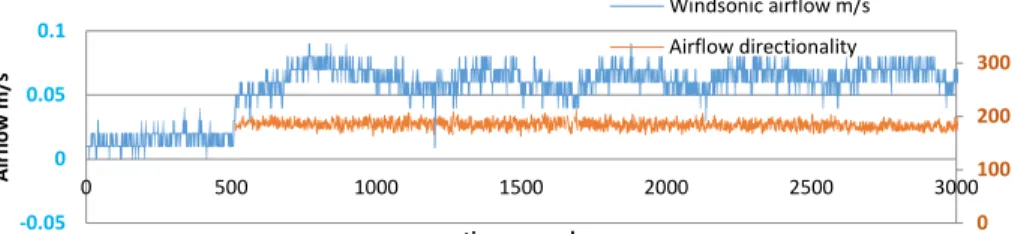
0 100 200 300
0 0.05 0.1
0 200 400 600 800 1000 1200 1400 1600 1800 2000 2200 2400 2600
A
ir
fl
ow m
/s
time seconds
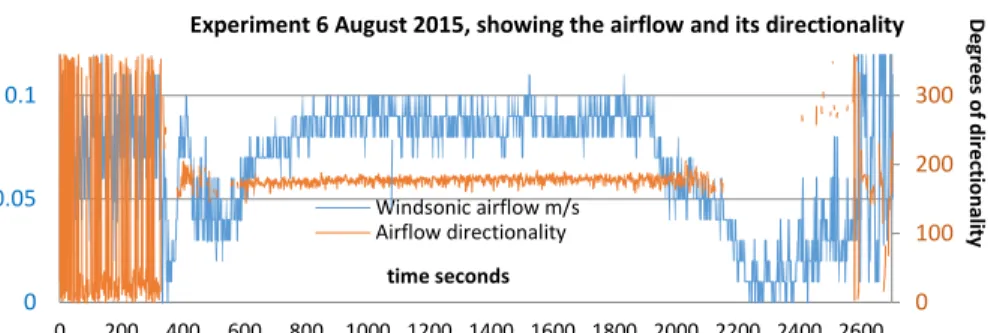
Experiment 6 August 2015, showing the airflow and its directionality
Windsonic airflow m/s Airflow directionality
D
e
g
re
e
s of
di
re
ct
ional
it
y
HESSD
12, 10921–10974, 2015Experimental evidence of condensation-driven
airflow
P. Bunyard et al.
Title Page
Abstract Introduction
Conclusions References
Tables Figures
◭ ◮
◭ ◮
Back Close
Full Screen / Esc
Printer-friendly Version Interactive Discussion
Discussion
P
a
per
|
Discussion
P
a
per
|
Discussion
P
a
per
|
Discussion
P
a
per
|
0 0.05 0.1 0.15 0.2
-0.5 0 0.5 1 1.5 2 2.5
0 500 1000 1500 2000 2500 3000
ppwv
di
ff
e
re
nce
hP
a/s
fo
r coo
le
d
parce
l of
a
ir
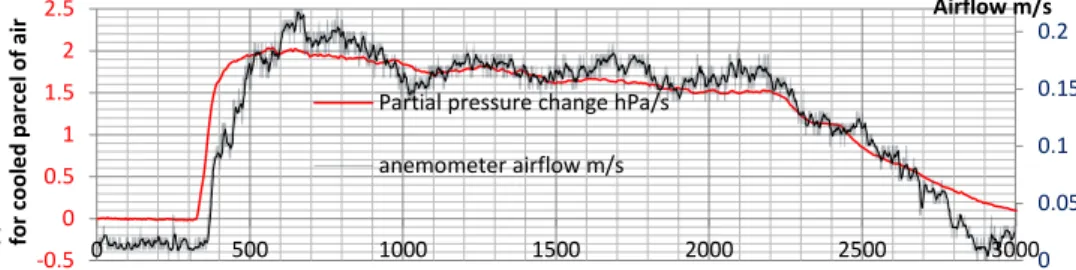
time seconds Partial pressure change hPa/s
anemometer airflow m/s
Airflow m/s
HESSD
12, 10921–10974, 2015Experimental evidence of condensation-driven
airflow
P. Bunyard et al.
Title Page
Abstract Introduction
Conclusions References
Tables Figures
◭ ◮
◭ ◮
Back Close
Full Screen / Esc
Printer-friendly Version Interactive Discussion
Discussion
P
a
per
|
Discussion
P
a
per
|
Discussion
P
a
per
|
Discussion
P
a
per
0 200
0 0.1 0.2
0 500 1000 1500 2000 2500 3000
A
ir
fl
o
w
m/
s
time seconds
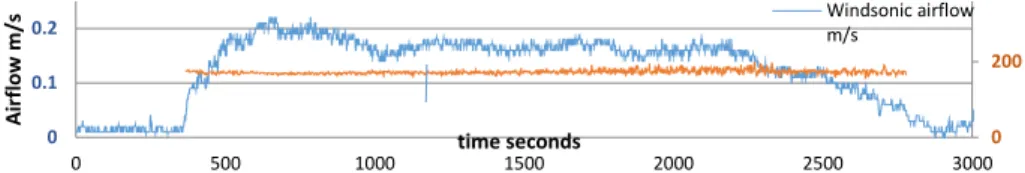
Windsonic airflow m/s
HESSD
12, 10921–10974, 2015Experimental evidence of condensation-driven
airflow
P. Bunyard et al.
Title Page
Abstract Introduction
Conclusions References
Tables Figures
◭ ◮
◭ ◮
Back Close
Full Screen / Esc
Printer-friendly Version Interactive Discussion
Discussion
P
a
per
|
Discussion
P
a
per
|
Discussion
P
a
per
|
Discussion
P
a
per
|
0 0.02 0.04 0.06 0.08 0.1
-0.50 0.00 0.50 1.00 1.50
0 500 1000 1500 2000 2500 3000
ppwv
di
ff
e
re
nce
be
twe
e
n
uppe
r
ri
g
ht
and upper
tunne
l,
hP
a/s
time seconds
A
ir
flo
w m/s
Condensation hPa/s versus Airflow m/s
HESSD
12, 10921–10974, 2015Experimental evidence of condensation-driven
airflow
P. Bunyard et al.
Title Page
Abstract Introduction
Conclusions References
Tables Figures
◭ ◮
◭ ◮
Back Close
Full Screen / Esc
Printer-friendly Version Interactive Discussion
Discussion
P
a
per
|
Discussion
P
a
per
|
Discussion
P
a
per
|
Discussion
P
a
per
0 100 200 300
-0.05 0 0.05 0.1
0 500 1000 1500 2000 2500 3000
A
ir
fl
ow m
/s
time seconds
Windsonic airflow m/s
Airflow directionality
HESSD
12, 10921–10974, 2015Experimental evidence of condensation-driven
airflow
P. Bunyard et al.
Title Page
Abstract Introduction
Conclusions References
Tables Figures
◭ ◮
◭ ◮
Back Close
Full Screen / Esc
Printer-friendly Version Interactive Discussion
Discussion
P
a
per
|
Discussion
P
a
per
|
Discussion
P
a
per
|
Discussion
P
a
per
|
0 0.05 0.1 0.15
-0.5 0 0.5 1 1.5
0 500 1000 1500 2000 2500 3000
ppwv
di
ff
e
re
nce
hP
a/s
fo
r coo
le
d
parce
l of
a
ir
time seconds
airflow m/s
HESSD
12, 10921–10974, 2015Experimental evidence of condensation-driven
airflow
P. Bunyard et al.
Title Page
Abstract Introduction
Conclusions References
Tables Figures
◭ ◮
◭ ◮
Back Close
Full Screen / Esc
Printer-friendly Version Interactive Discussion
Discussion
P
a
per
|
Discussion
P
a
per
|
Discussion
P
a
per
|
Discussion
P
a
per
-0.0001 -0.00005 0 0.00005
0 500 1000 1500 2000 2500 3000
spe
ci
fi
c hum
idi
ty
Time in seconds
Rate of change in specific humidity
specific humidity change
cond
HESSD
12, 10921–10974, 2015Experimental evidence of condensation-driven
airflow
P. Bunyard et al.
Title Page
Abstract Introduction
Conclusions References
Tables Figures
◭ ◮
◭ ◮
Back Close
Full Screen / Esc
Printer-friendly Version Interactive Discussion
Discussion
P
a
per
|
Discussion
P
a
per
|
Discussion
P
a
per
|
Discussion
P
a
per
|
-0.0001 -0.00005 0 0.00005
0 500 1000 1500 2000 2500 3000
spe
ci
fi
c hum
idi
ty
Time in seconds
Rate of change in specific humidity
specific humidity change
cond
HESSD
12, 10921–10974, 2015Experimental evidence of condensation-driven
airflow
P. Bunyard et al.
Title Page
Abstract Introduction
Conclusions References
Tables Figures
◭ ◮
◭ ◮
Back Close
Full Screen / Esc
Printer-friendly Version Interactive Discussion
Discussion
P
a
per
|
Discussion
P
a
per
|
Discussion
P
a
per
|
Discussion
P
a
per
-0.0001 -0.00005 0 0.00005
0 500 1000 1500 2000 2500 3000
spe
ci
fi
c hum
idi
ty
Time in seconds Rate of change in specific humidity
specific humidity change
cond
HESSD
12, 10921–10974, 2015Experimental evidence of condensation-driven
airflow
P. Bunyard et al.
Title Page
Abstract Introduction
Conclusions References
Tables Figures
◭ ◮
◭ ◮
Back Close
Full Screen / Esc
Printer-friendly Version Interactive Discussion
Discussion
P
a
per
|
Discussion
P
a
per
|
Discussion
P
a
per
|
Discussion
P
a
per
|
-0.00005 0 0.00005
0 500 1000 1500 2000 2500 3000
spe
ci
fi
c hum
idi
ty
Time in seconds
Rate of change in specific humidity
specific humidity change
cond
HESSD
12, 10921–10974, 2015Experimental evidence of condensation-driven
airflow
P. Bunyard et al.
Title Page
Abstract Introduction
Conclusions References
Tables Figures
◭ ◮
◭ ◮
Back Close
Full Screen / Esc
Printer-friendly Version Interactive Discussion
Discussion
P
a
per
|
Discussion
P
a
per
|
Discussion
P
a
per
|
Discussion
P
a
per
-10 -5 0 5 10 15
-0.0002 0 0.0002 0.0004 0.0006 0.0008 0.001
0 500 1000 1500 2000 2500 3000
condenser cool air change W.s
condenser ppwv change W.s
Rate of change ppwv W.s
Time, seconds
kinetic energies of partial pressure rate change and air density rate change
Rate change air density