Article
Spatio-temporal distribution of inhalable and respirable particulate matter in
rural atmosphere of Nigeria
T. F. Ediagbonya1, E. E. Ukpebor2, F. E. Okiemien2, G.E. Okungbowa3
1Department of Basic and Industrial Chemistry, College of Natural and Applied Science, Western Delta University, Oghara,
Nigeria
2
Department of Chemistry, University of Benin, Benin
3Department of Physics, University of Benin, Benin
E-mail: [email protected]
Abstract
A complete description of particle pollution of the air at a particular site encompasses the physical characterization of the aerosol, including the total size distribution and that with respect to chemical
composition as well as the variation of these quantities with respect to time. The particulate matter in this region was captured at five different locations using SKC Air Check XR 5000 High Volume Gravimetric
Sampler and a respirable foam using I.O.M. (Institute of Occupational Medicine) Edinburg Multi dust sampler. The study was done between the months of December 2008 - October 2009. The spatial variations were significant and remarkable. The correlation of the inhalable fraction and respirable was significantly high
(P<0.01).
Keywords seasonal variation; respirable particle; inhalable particle.
1 Introduction
Suspended particulate matter is a major air pollutant in Nigeria. In most of the cities the level of particulate
loading in ambient air have been above the permissible limits (Ukuo et al, 2002; Ukpebor et al, 2010; Obioh et al, 2005). Emphasis is being laid on the study of emission and dispersion of particulate matter in the atmosphere (Telesca and Lovallo, 2011).
The particulate matters behavior, size and their dispersed in the atmosphere is the same manner as gases. They are pernicious to health especially if they originate from urban source and hence contain a number of
toxic and carcinogenic chemicals.
The effect of seasonal phenomena on soil related fine (respirable and coarse (inhalable) particle has been reported from different regions around the world (Rodriquez et al, 2001; Quaerol, 1998; Pio et al, 1996;
Owega et al, 2004; Dorderic et al, 2004).
In order to comprehend the processes responsible for the spatial and temporal distribution of aerosols, in
depth analysis of local regional meteorology, specially wind speed, atmospheric stability, wind direction and turbulence are required (Zelenka, 1997; Hien et al, 2002; Laakso et al, 2003).
The purpose of this study is to determine the spatial and temporal variation of the particulate matter the Received 25 October 2012; Accepted 29 November 2012; Published online 1 March 2013
It has been demonstrated that the component in particulate matter can induce bulky DNA adducts and oxidative bases that may induce mutations. Indeed, a plethora of evidence have demonstrated that ambient
pollutants are able to induce DNA adducts, mutations and tumors in animals models (Ichinose et al, 1997; Reymao, et al, 1997).
Health effects of particulate matter are determined by their size distribution, bulk chemical microbiological
concentration and composition (Hetland et al, 2004; Griffin et al, 2001).
However plethora respirable particle (PM2.5) concentration have been shown to have insidious effect on the
respiratory and cardiac health of humans (Dockery et al, 1993; Gwyno et al, 2000; Pope et al, 2002) attenuate visibility and also affects the structural integrity of plant (Chameides et al, 1999; Bergin et al, 2001).
2 Materials and Methods 2.1 Sampling site
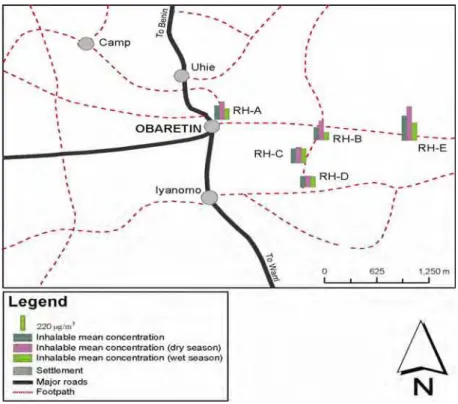
Sampling was done in Obaretin in Ikpoba-Okha L.G.A Edo State in Niger Delta region of Nigeria (Fig. 1; Table 1). The rural community is sparsely distributed with a population estimate of few thousand of inhabitant, the settlement is situated along the main road i.e Nodal Settlement. There are thick rubber plantations and
industrial farms all located behind the community.
The rural dwellers engage themselves in farming, hunting, rubber tapping and rural or intra-transportation
due to the accessibility of the community to the main road. Also the people engage in cassava processing, smoking of fishes, and their major way of waste disposal is by burning. The main road that led to the community is untarred. Other human activities in this locality include paving of roads and different artisans.
All these activities afore-mentioned are veritable generator of particulates to the environment.
The major human activities in this region that generate cumbersome pollution are the particulate generate
from bike, vehicular exhaust, bush burning and resuspended particle from the untarred road.
To
W To
Be
Obaretin Uhie Camp
Iyanomo
50 40E
50 36E
5040E 50 36E
50 08N
50 11N
50 08N
50 11N
2kM 1
0
SCALE
LEGEND
River Major roads
Sample locations Settlements Foot paths
NIGERIA
N
Table 1 Monitoring sites and their co-ordinates
S/N Site Code Co-Ordinates Site Descriptions
1 RHA N06009’ 43.3” E005O 38’ 49.2” Mud house detached, kitchen unceiled roof
2 RHB N06O 09’46.9” E005O 38’44.7” Mud house detached, kitchen unceiled roof
3 RHC N06o09’ 46.9” E005O 38’ 48.1” Mud house detached, kitchen unceiled roof
4 RHD N06O 09’ 40.0” E005O38’ 53.8” Mud house detached, kitchen unceiled roof
5 RHE N06O 09’ 35.8” E005O 38’30.4” Mud house detached, kitchen unceiled roof
2.2 Sampler and analytical procedure
In present study, we used the sampling tool, SKC Air Check XR 5000 high Volume Gravimetric Sampler Model 210-5000 serial No. 20537. This sampling unit consists of a gas pump with an in built flow rate meter
and a filter holder manifold connected to the sampling pump by a Teflon tube. Airborne particulate matter was collected on a Whatman glass fiber filter.
The inbuilt gas flow meter has a rating of 1000 to 5000 ml/mm of air samples. Before sampling, all
unloaded glass fiber filters were dried in a desiccators at room temperature and their initial weights were taken. The particulates were collected on the pre-weighed filter by pumping 2000ml/min (2 L/min) volume of air
through it for eight hours, after sampling, the loaded filters were again desiccated and re-weighed to determine the final weight.
The concentration of the total suspended particulates in the air was determined from the difference in
weight of the filter paper after and before sampling the duration of the sampling and the flow rate (Shaw, 1987; UNEP/WHO, 1994). The sampler was placed at heights of 1.5 m above ground level to reflect the breathing
zone of human.
Total suspended particulate (TSP) is calculated as
1000
(min)
period
sampling
min
/
m
rate
Flow
(mg)
weight
Initial
-(mg)
weight
Final
/
3 3
m
g
TSP
Because of the proximity of residential houses to the PM and human exposure. The probability of human effect exists. Thus toxicity potential (TP) are computed as
NAAQS
by
set
limit
e
Permissibl
ion
concentrat
dust
gross
observed
TP
3 Results and Discussion
This study was conducted to provide simultaneous information on the spatial and temporal variation of
inhalable suspended particulate matter and respirable suspended particulate matter in rural air in a selected location in Obaretin (rural area).
Table 2 and 3 showed that during wet season, the mean ambient temperature was in the range of 27.4 –
29.00 0C, the relative humidity was in the range of 70.20 – 84.25 % and the mean wind speed was in the range
of 0.10 – 0.30 m/s, while for dry season, the mean ambient temperature was in the range of 26.40 0C, the
relative humidity was in the range of 70.00-72.60 % and the mean wind speed was in the range of 0.13-0.34 m/s.
The wet season affects the inhalable fraction more than the respirable fraction; that is inhalable fraction washes away more than the respirable fraction. From the data generated, inhalable fraction showed a clear
seasonal pattern during the dry and wet season over the respirable suspended particulate matter.
The ratio of the dry to wet season inhalable fraction ranged from 1-3 while the ratio of the dry to wet season respirable fraction ranged from 1-2.
Table 4 and 5 show the toxicity potential from inhalable fraction for both wet and dry season. The toxicity potential ranged from 0.97-3.00 for dry season while for wet season ranged from 0.93-1.540. The toxicity
potential for inhalable fraction was higher than the toxicity potential for wet season. The exposure and the damaging effect of inhalable fraction is higher during the dry season when compare to the wet season.
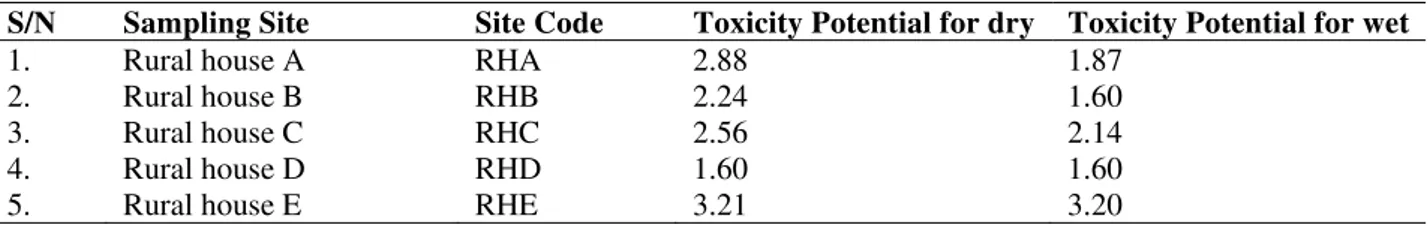
Table 6 and 7 show the toxicity potential for respirable fraction for both dry and wet season. The toxicity
potential for dry season ranged from 4.00 while the toxicity potential for wet season ranged from 1.60-3.20 the toxicity potential of respirable fraction is higher than of the toxicity potential of inhalable fraction. A
toxicity potential greater than unity is harmful to human; as seen from this work the toxicity potentials for both inhalable and respirable exceeded unity except for residential house (during wet season in Inhalable) which was lesser than unity.
The concentration of inhalable fraction during the dry ranged from 145.83-437.50 g/m3 while in wet
season it ranged from 104.17-225.67 g/m3. And the concentration of the respirable fraction during the dry
ranges from 104.17-208.33 g/m3 while the wet concentration range from 104.17.208.17 g/m3.
Table 8 and Table 9 show the spatial and temporal variation of the particulate matter captured. Table 8 shows the concentration of inhalable suspended matter for both dry and wet season. The permissible limits for
inhalable and respirable fractions are 150 µg/m3 and65 µg/m3 respectively. At the five monitoring site during
the dry season for both inhalable and respirable fraction were clearly exceeded excepts site D in inhalable
fraction while in wet season, the inhalable and respirable fraction exceeded the permissible limit set by (NAAQS) except in sites A, B and C for inhalable fraction which fall within the purview of the permissible limit.
Table 2 Ambient temperature relative humidity and wind speed between December 2008 and April 2009 for the various sampling locations in Obaretin
Ambient temperature
(OC)
Relative humidity (%) Wind Speed (m/s) S/NO Site Code Range Mean Range Mean Range Mean
1. RHA 27.10 – 35.20 30.10 59.14 – 70.00 68.40 0.0 – 0.3 0.20
2. RHB 28.10 – 33.10 30.00 66.20 – 72.60 69.20 0.0 – 0.4 0.25
3. RHC 25.10 – 29.70 26.40 68.10 – 71.20 70.20 0.0 – 0.5 0.34
4. RHD 25.00 – 28.00 26.50 66.40 – 70.00 69.80 0.0 – 0.6 0.30
5. RHE 28.10 – 34.50 30.20 50.10 – 70.00 67.20 0.0 – 0.2 0.13
Table 3 Range and mean of ambient temperature, relative humidity and wind speed in Obaretin during wet season
Ambient temperature (OC) Relative humidity (%) Wind Speed (m/s) S/NO Site
Code
Range Mean Range (%) Mean (%)
Range Mean
1. RHA 25.00 – 31.20 28.40 64.20 – 84.40 73.30 0.0 – 0.4 0.15
2. RHB 26.80 – 30.00 27.50 70.60 – 80.20 74.40 0.0 – 0.3 0.20
3. RHC 25.10 – 28.40 27.40 72.10 – 84.50 77.30 0.0 – 0.5 0.25
4. RHD 26.90 – 29.00 28.00 80.20 – 90.30 84.25 0.0 – 0.6 0.30
Table 4 Spatial variation of inhalable fraction measured in Obaretin
S/N Sampling Site Site Code Max Min Mean Standard Deviation
1. Rural house A RHA 416.67 104.17 179.93 105.11
2. Rural house B RHB 520.83 104.17 170.46 133.99
3. Rural house C RHC 208.33 104.17 189.39 42.13
4. Rural house D RHD 208.33 104.17 142.05 52.55
5. Rural house E RHE 520.83 208.23 321.95 127.21
Table 5 Temporal variations of the measured inhalable fraction
S/N Sampling Site Site Code
Dry Season Mean (µg/m3)
Wet Season Mean (µg/m3)
Dry/Wet Season Ratio
Regulatory
Limit by NAAQS
1. Rural house A RHA 229.17 138.89 1.65 150g/m3
2. Rural house B RHB 250.00 104.17 2.40
3. Rural house C RHC 208.33 190.97 1.09
4. Rural house D RHD 145.83 138.89 1.05
5. Rural house E RHE 437.50 225.67 1.94
Table 6 Spatial variation of respirable fraction measured in Obaretin (g/m3)
S/N Sampling Site Site Code Max Min Mean Standard Deviation
1. Rural house A RHA 208.33 104.17 151.52 54.40
2. Rural house B RHB 208.33 104.17 123.11 42.13
3. Rural house C RHC 208.33 104.17 132.57 48.65
4. Rural house D RHD 104.17 104.17 104.17 1.49
5. Rural house E RHE 312.5 104.17 208.33 46.58
Table 7 Temporal variations of the measured respirable fraction
S/N Sampling Site Site Code
Dry Season Mean (µg/m3)
Wet Season Mean (µg/m3)
Dry/Wet Season Ratio
Regulatory
Limit by NAAQS
1. Rural house A RHA 187.50 121.53 1.54 65g/m3
2. Rural house B RHB 145.83 104.17 1.40
3. Rural house C RHC 166.67 138.89 1.20
4. Rural house D RHD 104.17 104.17 1.00
5. Rural house E RHE 208.33 208.17 1.00
Table 8 The toxicity potential in suspended particulate matter for inhalable
S/N Sampling Site Site Code Toxicity Potential for dry
Toxicity Potential for wet
1. Rural house A RHA 1.53 0.93
2. Rural house B RHB 1.67 0.69
3. Rural house C RHC 1.39 1.27
4. Rural house D RHD 0.97 0.93
Table 9 The toxicity potential in suspended particulate matter for respirable
S/N Sampling Site Site Code Toxicity Potential for dry Toxicity Potential for wet
1. Rural house A RHA 2.88 1.87
2. Rural house B RHB 2.24 1.60
3. Rural house C RHC 2.56 2.14
4. Rural house D RHD 1.60 1.60
5. Rural house E RHE 3.21 3.20
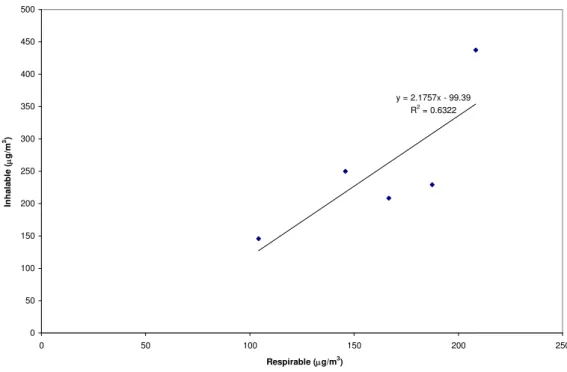
Fig. 2 and 3 show the correlation of inhalable and respirable during wet and dry season. The linear relationship model showed that there was a strong positive linear relationship between inhalable and respirable.
Fig. 4 shows the seasonal trend from December 2008 to October 2009. From December 2008 to May 2009, there was a decrease in the mean concentration of inhalable and respirable fractions, while October had the
lowest the concentration, this was as a result of torrential downpour during this month.
Fig. 5 and 6 are the GIS maps for inhalable and respirable respectively showing the concentration for the spatial and temporal variations.
The poor air quality in Obaretin is strongly associated with biomass burning, bush burning as preplanting operation traffic related emission and incinerate of waste. The spatial distribution was significant and
remarkable (P<0.05).
Fig. 3 The correlation of mean inhalable with mean respirable for obaretin dry season.
Fig. 4 Monthly concentration of mean concentration of inhalable and respirable. y = 2.1757x - 99.39
R2 = 0.6322
0 50 100 150 200 250 300 350 400 450 500
0 50 100 150 200 250
Respirable (g/m3)
In
ha
la
ble
(
g/m
3)
0.00 50.00 100.00 150.00 200.00 250.00 300.00 350.00 400.00 450.00
Dec_08 Jan_09 Feb_09 Mar_09 Apr_09 May_09 Jun_09 Jul_09 Aug_09 Sep_09 Oct_09 Months
M
ean
C
o
n
cen
tr
a
ti
o
n
(
g/
m
3)
Fig. 5 GIS map for inhalable particle in obaretin.
4 Conclusion
The air-borne particulate matter is a serious problem in Nigeria. This study has measured simultaneously the
inhalable and respirable atmospheric particulate matter. The results show that the captured particulate matter exceeded set standard by (NAAQS).
The ratio of dry season to wet season inhalable particulate matter varied from 1.05 to 1.94 while respirable
dry to wet varied from 1.00 to 1.54. The temporal variations are mainly due to meteorological factors such as, precipitation, wind speed, relative humidity and temperature.
The major sources of particulate matter are vehicular related emission, incineration of solid waste and gas flaring biomass burning and resuspended dust. The spatial distribution were significant and remarkable (P<0.05).
However, the since then has been a minute information on this subject matter it is hoped that the data generated will offer a sublime information for policy maker and other regulatory bodies in the country.
Acknowledgement
We gratefully acknowledge the support of Mr. Ufuoma Asagba, Mr. Magnus Legmah, Mrs. Justina Ukpebor, Mr. Eddy Olumese, Mr. Obozakhai, Mr. Ezeh Joseph Onuwa and Mr. Ogaga Tebehaevu for their
immeasurable assistance.
References
Bergin M, Greenwald R, Xu J, et al. 2001. Influence of aerosol dry deposition on photosynthetically active
radiation available to plants a case study in the Yangtze delta region of China. Geophysical Research Letters, 28(18): 3605-3608
Bouble RW, et al. 1992. Fundamentals of Air Pollution (3rd edition). Academic Press, USA, 351-357
Chameldes WL, Yu H, Liu SC, et al. 1999. Case study of the effect of atmospheric aerosols and regional haze on agriculture: an opportunity to enhance crop yields in China through emission controls? Proceedings of
the National Academy of Sciences of USA, 96: 13626-13633
Dockery DW, Pope III CA, Xu X, et al. 1993. An association between air pollution and mortality in six US
cities. New England Journal of Medicine, 329: 1753-1759
Dordevic D, Vukmirrovic Z, Tosic M. 2004. Contribution of dust transport and resuspension to particulate matter levels in the Mediterranean atmosphere. Atmospheric Environment, 38: 3637-3645
Griffin DW, Garrison VH, Herman JR, et al. 2001. African desert dust in the Caribbean atmosphere: Microbiology and public health. Aerobiologia, 17: 203-213
Gwynn CR, Burnett RT, Thurston GD. 2000. A time series analysis of acidic particulate matter and daily mortality and morbidity in the Buffale, NEW York region. Environmental Health Perspectives, 108: 123-133
Hetland RB, Cassee FR, Refsnes M, et al. 2004. Release of Informatory Cytokines, cell toxicity and apoptosis in epithelial lung cells after exposure to ambient air particles of different size fractions. Toxicology in Vitro,
18: 203-212
Hien D, Bac I, Tham C, et al. 2002. Influence of meteorological conditions on PM2.5 and PM2.5−10
concentration during the monsoon season in Hanoi,Vietnam. Atmospheric Environment, 36(21): 3473-3484
Laakso L, Hussein T, Aarnio P, et al. 2003. Diurnal and annual characteristic of particle mass and number concentrations in urban, rural and arctic environments in Finland. Atmospheric Environment, 37(19):
2629-2641
Zelenka MP. 1997. An analysis of the metrological parameters affecting ambient concentrations of acid aerosols in union town, Pennsylvania. Atmospheric Enviroment, 31(6): 869-878
National Air Quality and Emissions Trends Report. 1999. EPA, USA
Obioh IB, Olise FS, Owoadi OK, et al. 2005. Chemical Characterization of suspended particulate along air
corridors of motor ways in two Nigeria cities Journal of Applied Science, 5(2): 347-350
Okuo JM, Ndiokwere CI. 2005. Elemental Characterization and Source apportionment of air particulate matter in two constructions industrial area in Nigeria. Journal of Applied Science, 5(10): 1797-1801
Owega S, Evans GJ, Jervis RE, et al. 2004. Long-range sources of Toronto Particulate matter (PM2.5) Identified by Aerosol Laser Ablation Mass Spectrometry (LAMS) Atmospheric Environment, 38:
5545-5553
Pio CA, Castro LM, Cerqueria MA, et al. 1996. Source assessment of particulate air pollutants measured at the Southwest European coast. Atmospheric Environment, 30: 3309-3320
Pope CA, Burnett RT, Thun ML, et al. 2002. Lung Cancer Cardiopumary Mortality and Long-term Exposure to fine Particulate air pollution. Journal of the American Medical Association, 287(9): 1132-1141
Querol X, Alastuey A, Puicercus JA, et al. 1998. Seasonal evolution of suspended particles around a large coal fired power station: Particulate levels and sources. Atmospheric Environment, 32: 1963-1978
Reymao MS, Cury PM, Lichtenfels AJ, et al. 1997. Urban air pollution enhance the formation of unthane- induced lung tumors in mice. Environmental Research, 74: 150-158
Rodriquez S, Querol X, Alastuey A, et al. 2001. Saharan dust contribution to PM10 and TSP levels in Southern
and Eastern Spain. Atmospheric Environment, 35: 2433-2447
Stern CA, et al. 1994. Fundamental of Air Pollution. Academic Press, San Diego, California, USA
Telesca L, Lovallo M. 2011. Complexity analysis in particulate matter measurements. Computational Ecology
and Software, 1(3): 146-152
Ukpebor EE, Ukpebor JE, Efebomo G. 2004. Assessment of the effect of medical waste incinerator on the