Article
Spatial distribution of respirable and inhalable particulate matter
concentration in sawmills of South-South Region of Nigeria
T.F. Ediagbonya1, A. E. Tobin2, E. E. Olumese3, U.E. Asagba3, I. E. Uwidia4, O.P. Osarumwensee3 1
Department of Basic and Industrial Chemistry,College of Natural and Applied Science,Western Delta University,Oghara,Delta State, Nigeria
2
Institute of Lassa Fever Research and Control, Irrua Specialist Teaching Hospital, Irrua, Nigeria 3
Chemistry Department, University of Benin, Benin City, Nigeria 4
Department of Chemistry, College of Education,Warri, Delta State, Nigeria E-mail: [email protected]
Received 25 October 2012; Accepted 29 November 2012; Published online 1 June 2013
Abstract
Dust particles in the air that can be respired into the nose or mouth during normal breathing are known as inhalable particle. Inhalation decreases gradually with increasing particle diameter. The respirable and
inhalable sawdust were collected from nine different sawmills in Benin City from November 2009 to February 2010 using portable programmable SKC Air Check XR5000 High Volume Gravimetric Sampler Model
210-5000 Serial No. 20537 and I.O.M (Institute Occupational Medicine Edinburg) Multi dust sampler, Batch No. 221442/1. The objective of this study is to know the concentration of inhalable suspended particulate matter fraction and the respirable suspended particulate matter fraction in sawmill particulate. The mean
concentration range of the respirable suspended particulate matter was 173.61-520.83g/m3 and the inhalable suspended particulate matter was in a range of 555.56-2,013.98g/m3. A strong positive correlation existed for inhalable suspended particulate matter and respirable suspended particulate matter. And the spatial variation was significant and remarkable.
Keywords respirable particle; inhalable particle; sawmill and South-South spatial variation; toxicity potential.
1 Introduction
In Nigeria, information on environmental pollution by particulate matter and their impacts on human health are largely minuet where available, they are usually focused on larger industries and vehicular emissions
(Akeredolu et al., 1994; Asubiojo et al.,1991;Ndiokwere, 1984; Oyedele et al., 1994).
Over 99% of inhaled particulate matter is rather exhaled or trapped in upper areas of the respiratory system and expelled. The balance enters the wind pipe and lungs where some particulate known as inhalable
particulates cling to protective mucous and are removed, other mechanisms such as coughing, also filter out or Environmental Skeptics and Critics
ISSN 22244263
URL: http://www.iaees.org/publications/journals/environsc/onlineversion.asp RSS: http://www.iaees.org/publications/journals/environsc/rss.xml
Email: [email protected] EditorinChief: WenJun Zhang
remove particles.
Collectively, these “Pulmonary Clearance” mechanisms protect the lungs from the majority of inhalable
particles (Hatch, 1961; Hilding, 1965; Nadel, 1965).
Some of the smallest particles called respirable (PM2.5) particulates lodge in the lung capillaries and alveoli causing the following effects slowing down the exchange of oxygen and carbon dioxide in the blood,
causing shortness of breath and straining the heart, because it must work harder to compensate for oxygen loss. The people most sensitive to these conditions include those with heart problems or respiratory disease like
emphysema, bronchitis and asthma. The elderly and children are very sensitive (Ediagbonya and Tobin, 2012). The adverse health effects from particulate matter exposure are often not immediately noticed (Prajapati, 2012). Particulates can accumulate in the lungs after repeated long-term exposure causing respiratory distress
and other health problems (Columbia Encyclopedia, 2006; Miroslav et al., 1999).
Some particles themselves may be poisonous if inhaled or absorbed and can damaged remote organs like
the kidneys or liver, swallowed mucous laden with poisonous particulate matter may also damaged the gastrointestinal system. Irritating odours are often associated with particulates.
Epidemiological studies have long recognized increased mortality and morbidity in susceptible populations
during high air pollution episodes (Stipharious et al., 1993; Chebbi et al., 1996).
The finding suggests a strong relationship between particulate matter and impairment of Cardiopulmonary
function (Schauer et al., 2001)
Airborne particulate matter represents a complex mixture of organic and inorganic substances. It is also a
mixture of solid, liquid or solid and liquid particles suspended in air (Yu et al., 2006; Yang et al., 2005; Dockery et al., 1997; Telesca and Lovallo, 2011).
Particulate matter of thoracic size may be emitted from a number of sources, some of them are natural (e.g.
volcanoes and dust storms) and many others that are more widespread and more important to public health (e.g. power plants and industrial processes vehicular traffic or motor vehicle exhaust fossil fuel, biomass burning,
industrial and municipal waste incinerators). The majority of these man-made source are concentrated in limited area, that is, urbanized area, where population are also concentrated (Proceeding of the symposium on Biological Test, 1983; Chauer et al., 2002; Mayol-Bracero et al., 2002; Pio et al. 2005; Ukpebor et al., 2004;
He et al. 2001; Dan et al., 2004; Ediagbonya et al., 2013a).
Particulate matter is what most people see and feed when they experience “dirty air” particulate can
Corrode metals and Masonry (Hudson, 1943; Report of Committee on Corrosion, 1952; Galagar et al., 1961; Whitby, 1933; Esterow, 1964; Winkler, 1965).
2 Materials and Method 2.1 Area of study
The study was conducted in Benin City the capital of Edo State (Fig. 1). This ancient City is located in the Southern part of Nigeria and has a population of about 1,147,188 (NPC 2005/2006). It is a commercial City with few petroleum and allied industries. Sawmills are found in every nook and cranny of the city. During
production, very small pieces of wood that fall as powder when wood is cut with a saw are emitted into the atmosphere. From Monday to Saturday the workmen saw wood from 9:00am to 6:00pm. Sawmill factory is a
major factory in Benin City of Edo State. However, the climate is tropical with two distinct seasons wet and dry.
2.2 Sampler and analytical procedure
The sampling device includes a sampling train which embodies an air mover, a flow measuring device, a sample collection mechanism. The air mover creates a flow of air that will allow the contaminants in the air to
be captured in the sample collection mechanism for analysis. The collection mechanism consist of the cassette cover front plate, two-o-rings, cassette rear cassette front and the sampler body which is connected to the vacuum pump with a Teflon tube. The inbuilt flow meter has a rating of 1000ml/min to 5000ml/min of air
samples. Before sampling, the unit was carefully calibrated against a standard meter to determine the quantity of air flows and all unloaded glass fiber filter and the foam were dried in the desiccators at room temperature.
The Respirable foam for I.O.M (institute of occupation medicine Edinburgh) multi fraction dust sampler with batch No. 221442/l uses 25mm diameter filter for inhalable dust sampling it is a flexible sample head which can be with foam to give a respirable measurement.
7
1
2
9
5 4
Ekehuan
3
6
Oluku
EKOSODIN Ekosodin Road
Ri ve r Ik po ba O kh or o R oa d D Mi ssi on R oa d D
Benin Auchi RoadD
Benin Aasaba RoadD Siloko RoadD
Us el u la go s R oa d D Be ni n Sa pe le R oa d D
Sakpoba RoadD Sakpoba RoadD
Air Po rt R oa d D
Air Port 8
Ekosodin Road
Sample Locations Major Roads Minor Roads River 50
32E 50 41E
60
28N
60 15N 50
32E 50
41E
LEGEND
N
StudyArea
N
Fig. 1 Map of Benin City showing the sampled locations.
The filter and cassette rear was pre-weighed to determine the initial respirable dust, while the filter, foam
and whole cassette together was pre-weighed to determine the initial inhalable. After sampling, the filter, foam, and the whole cassette together were re-weighed to determine the inhalable fractions. Then, the whole cassette
was split, in order to weigh the cassette rear and filter only to determine the final weight of the respirable fractions the particles were collected at a flow rate of 2l/min for eight hours and the sampler was placed between height of 1.5-2m of man.
The difference between the final weight and the initial weight is the amount of respirable and inhalable dust collected. (Shaw, 1987; UNEP / WHO, 1994)
The Concentration in μg/m3 was calculated by
1000
(min)
Period
Sampling
min
/
m
rate
Flow
(mg)
weight
initial
-(mg)
weight
final
3
For a quantitative estimate of the possible impact of the airborne particulate on the health of those exposed,
Ambient Air Quality standard level concentration of 150 and 65μg/m3 for inhalable and respirable particle.
2.3 Data analysis
The data captured were subjected to statistical analysis using the Statistical Package for Social Sciences (SPSS version 16.0 for windows). The following statistics were done to achieve the aim of this work: descriptive statistics, Pearson correlation, one-sample t-test, one-way Analysis of Variance (ANOVA) and Cluster analysis.
3 Results and Discussion
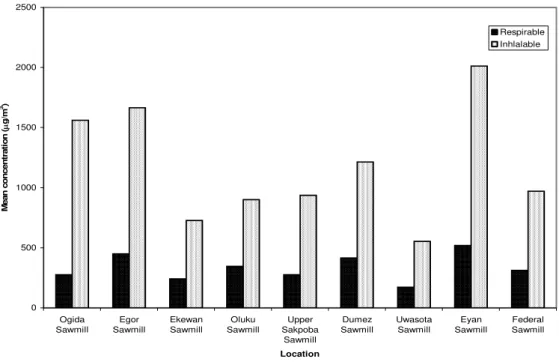
After sampling, the mean concentration of the inhalable and respirable particulate matters of the nine (9) different sawmills were compared for spatial variation. The mean measurement of inhalable and respirable particulate matters in the nine locations of Sawmill in Benin is presented in Fig. 2. The ANOVA showed that
there is a significant difference (P<0.05) in the spatial distribution of both inhalable (F=17.10, df = 8) and respirable (F=5.998, df = 8) particulate matters. The highest mean concentration was observed in site
8(2,013.89g/m3) while the lowest mean was observed in site 3 (729.16g/m3). Tables 1 and 2 also show the
mean comparison of the different sites visited and the t-test was used to test the true means from the Standard from National Ambient Air Quality Standard for respirable and inhalable particulate matter. For Inhalable
particulate matter, the data generated in all the sites significantly (P<0.05) exceeded the Standard (150µg/m3);
while for Respirable particulate matter, the data generated in all the sites also significantly (P<0.05) exceeded
the standard (65 µg/m3), except for Uwasota sawmill and Federal Sawmill. For Inhalable, the Toxicity
potential was in the range of 3-13, while the Toxicity potential for respirable was in the range of 2-9 as seen in Table 3. However, the concentration of inhalable and respirable particles obtained can also be compared to the
one in rural area (Ediagbonya et al., 2013b).
0 500 1000 1500 2000 2500
Ogida Sawmill
Egor Sawmill
Ekewan Sawmill
Oluku Sawmill
Upper Sakpoba
Sawmill
Dumez Sawmill
Uwasota Sawmill
Eyan Sawmill
Federal Sawmill
Location
M
ean
c
o
ncent
rat
ion (
g/
m
3)
Respirable Inhlalable
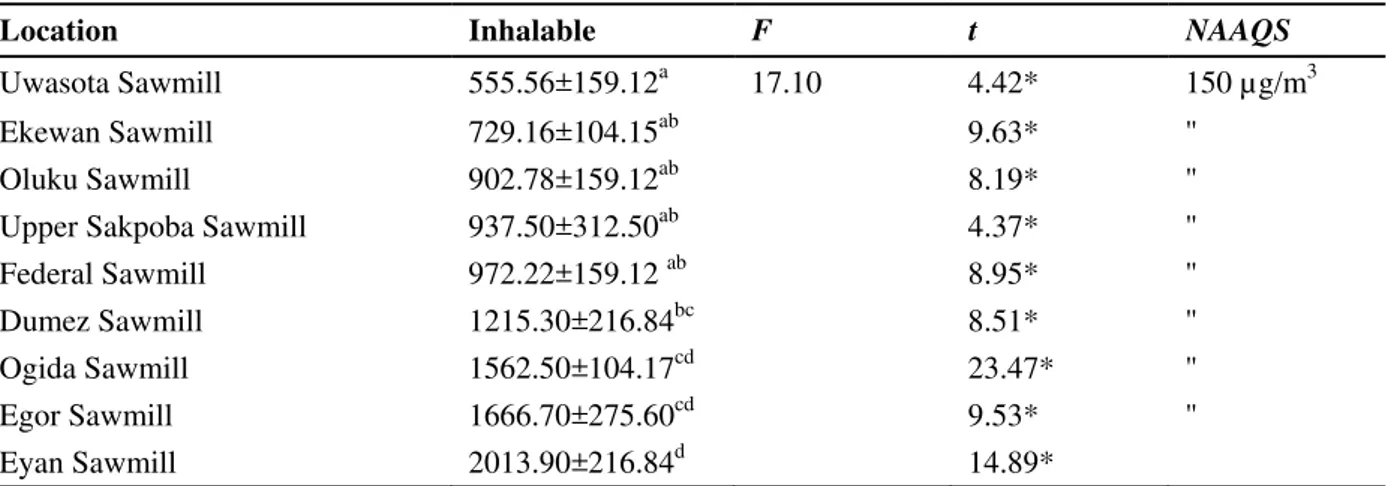
Table 1 Mean comparison (Duncan Multiple Range Test) and t-test of inhalable particulate matter with standard.
Location Inhalable F t NAAQS
Uwasota Sawmill 555.56±159.12a 17.10 4.42* 150 µg/m3
Ekewan Sawmill 729.16±104.15ab 9.63* "
Oluku Sawmill 902.78±159.12ab 8.19* "
Upper Sakpoba Sawmill 937.50±312.50ab 4.37* "
Federal Sawmill 972.22±159.12 ab 8.95* "
Dumez Sawmill 1215.30±216.84bc 8.51* "
Ogida Sawmill 1562.50±104.17cd 23.47* "
Egor Sawmill 1666.70±275.60cd 9.53* "
Eyan Sawmill 2013.90±216.84d 14.89*
Note: Mean (±S.D) with different letters are significantly different (P<0.05). *Significant at P<0.05, when compared with NAAQS standard.
Table 2 Mean comparison (Duncan Multiple Range Test) and t-test of respirable particulate matter with standard
Location Respirable F t NAAQS
Uwasota Sawmill 173.61±60.14a 5.998 3.13 65 µg/m3
Ekewan Sawmill 243.05±60.14ab 5.13* "
Oluku Sawmill 347.22±60.14abc 8.13* "
Upper Sakpoba Sawmill 277.78±60.14ab 6.13* "
Federal Sawmill 312.50±104.17abc 4.115 "
Dumez Sawmill 416.67±104.17bc 5.85* "
Ogida Sawmill 277.87±60.25ab 6.12* "
Egor Sawmill 451.40±60.13bc 11.13* "
Eyan Sawmill 520.83±104.17c 7.58*
Note: Mean (±S.D) with different letters are significantly different (P<0.05). *Significant at P<0.05, when compared with NAAQS standard
There was a strong positive correlation (r = 0.82) between the inhalable fraction and the respirable fraction.
From Fig. 2, we can see that 68.6% (R2) of the mean inhalable accounted for the mean respirable, that is, we
have a 68.6% confidence that there is a linear relationship between them.
Table 3 Toxicity potentials for the different location sites.
S/N. SITES Respirable Inhalable
1. Ogida Sawmill 4.27 10.08
2. Egor Sawmill 6.94 10.75
3. Ekewan Sawmill 3.74 4.70
4. Oluku Sawmill 5.34 5.82
5. Upper Sakpoba Sawmill 4.27 6.05
6. Dumez Sawmill 6.41 7.84
7. Uwasota Sawmill 2.67 3.58
8. Eyan Sawmill 8.01 12.99
y = 0.1891x + 113.88 R2 = 0.6864
0 100 200 300 400 500 600
0 500 1000 1500 2000 2500
Mean Inhalable (g/m3)
M
ean
Resp
ir
ab
le (
g/m
3)
Fig. 3 Correlation of inhalable fraction with respirable fraction.
Table 4 Comparison of the respirable and inhalable suspended particulate matter result of this study with others.
Site/location Rang/mean of respirable particle (µg/m3)
Ranges of inhalable particle (µg/m3)
Sources
Current study 173.61-520.83 555.56-2,013.98 Present study
Urban/China 106-145 67-203 L.Y. Chan et al (2002)
Urban/Hong Kong, China - 44-112 Chan et al (2002)
London/ UK 39 - Adams et al (2001)
Munch Germany 110-165.39 Praml and Schier (2002)
Birmingham, UK 33 - Pfelfor et al (1999)
Urban/China 151-519 - Lu and Wang (2007)
Urban/Seoul 86.9 215.1 Kim et al (2007)
Urban/Ile-Ife 11-238 18-599 IB.Obioh et al (2005)
Urban/ Belgrade 61 77 M.Tabic et al (2006)
Urban/Milan 66(W) 43 (S)
103(W) 68 (S)
G. maroazzan et al (2001)
Urban/Madrid 34 48 E. manoli et al (2002)
Urban/Berlin 30 38 X. Querol et al (2001)
Urban/Rome - 60 P.enschow et al (2001)
Lucknow, India - 370.3-450 Awasthi et al (1996)
Dehi, India - 378 – 1714 Cropper et al (1997)
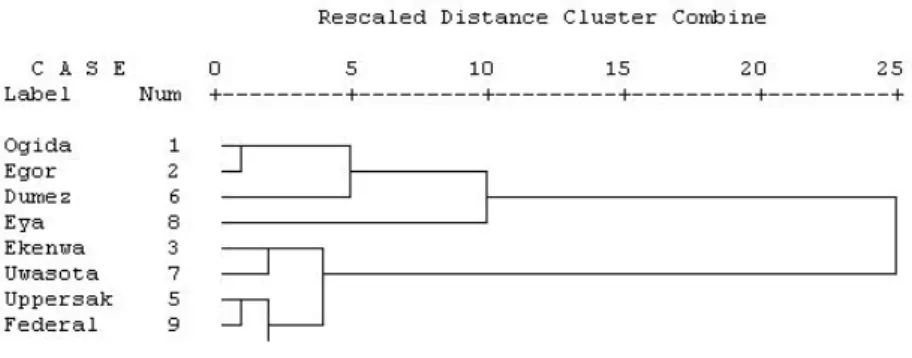
Fig. 4 Dengrogram showing clusters based on inhalable particulate matter.
The cluster analysis test of proximity of sawmills revealed 2 major clusters of the nine locations visited in
terms of their Inhalable particulate matter concentration. Cluster 1 consists of Sawmills in Ogida, Egor, Dumez and Eya, while cluster 2 consists of sawmills in Ekenwan, Uwasota, Upper Sakponba and Federal as shown in Fig. 4.
Fig. 5 Dengrogram showing clusters based on resirable particulate matter.
The cluster analysis test of proximity of sawmills revealed 2 major clusters of the nine locations visited in terms of their respirable particulate matter concentration. Cluster 1 consists of Sawmills in Ekenwan, Upper Sakponba, Ogida, Federal and Oluku, while cluster 2 consists of sawmills in Uwasota, Egor and Eya as shown
4 Conclusion
The respirable and the inhalable fraction were captured using a portable, programmable SKC Air Check
Sampler and I.O.M. (Institute of Occupational Medicine Edinburgh). The spatial variation of inhalable and respirable fraction was significant and remarkable. In all the sites, the Respirable and Inhalable fraction clearly exceeded the limit set by the National Ambient Air Quality Standard implying high health implication to
residents around these areas.
Acknowledgement
We acknowledge the contribution of Mr. Magnus Legmah, Mrs. Justina Ukpebor and Mr. Obozakhai, Mr. Ogaga Tebehavue and Mr. Ezeh Joseph Onuwa for their immeasurable assistance.
References
Adams HS, Nieuwnhuijsen MJ, Colville RN, et al. 2001. Fine particle (PM2.5) personal exposure in levels in
transport micro environments, London, U.K. The Science of the Total Environment, 279: 29-44
Akeredolu FA, Olaniyi HB, Adejumo JA, et al. 1994. Determination of elemental composition of TSP from cement industries in Nigeria using EDXRF technique. Nuclear Instruments and Methods in Physics
Research A., 353: 542-545
Asubiojo JO, Aina OO, Oluwole AF, et al. 1991. Effect of cement production on the elemental composition of soils in the neighbourhood. Water, Air and Soil Pollution, 57-58: 819-829
Awasthi S, Glick HA, Fletcher RH, et al. 1996. Ambient air pollution and respiratory systems complex in preschool children. Indian Journal of Medical Research, 104: 257-262
Chan LY, Lau WL, Chan CY, et al. 2002. Commuter exposure to particulate matter in public transportation modes in Hong Kong Atmosphere Environment, 36: 3363-3373
Chan LY, Lau WL, Zou SC, et al. 2002. Exposure level of carbon monoxide and repairable suspended particle
in particulate in public transportation modes while community in urban area of Guangzhou, China. Atmosphere Environment, 36: 5831-5840
Chebbi A, Carlier P. 1996. Caroxylic acids in troposphere, occurrence source and sinks: a review. Atmospheric Environment, 30: 4233-4249
Columbian Encyclopedia. 2006. Sixth Edition. Columbia University Press, USA
Cropper ML, Simon NB, Alberiru A, et al. 1997. The health effects of air pollution in Delhi India World Bank PRD working paper # 1860
Dan MO, Zhuang GS, Li XX, et al. 2004. The characteristics of carbonaceous species and their sources in PM2.5 in Beijing. Atmospheric Environment, 38: 3443-3452
Dockery DW, Pope CA. 1997. III Outdoor air / particulates. In: Ttropics in Environmental Epidemiology
(Steen K, Savitz DA, eds). Oxford University Press, Oxford, UK Esterow M. 1964. New York Times. April 13, 1964
EdiagbonyaTF, Tobin AE. 2012. Air pollution and respiratory morbidity in an urban area of Nigeria. Journal of Environmental Management and Public Safety, 1(1): 1-6
EdiagbonyaTF, Tobin AE, Ukpebor EE. 2013a. The Level of Suspended Particulate Matter in Wood
Industry(Sawmills)in Benin City, Nigeria. Journal of Environmental Chemistry and Ecotoxicology, 5(1): 1-6
20-29
Galegar WC, McCaldin RO. 1961. Air pollution as determined by corrosion rates in test materials. American
Industrial Hygiene Association Journal, 22: 187-191
Hatch TF. 1961. The air we Breathe (Farber SM, Wilson RHC, eds). Thomas, Springfield, Illinois, USA He KB, Yang FM, Ma YL, et al. 2001. The characteristics of PM2.5 in Beijing, China. Atomospheric
Environment, 35: 4959-4970
Hilding AC. 1965. Med. Thorac 22, 231. http://cc. msn cache com/cache aspx? q exposunet levels + of +
carbon + monoxide + respirable
Hudson JD. 1943. Journal of Iron and Steel Institute, 148: 161
Kothai P, Saradhi IV, Prathibha P, et al. 2008. Source Apportionment of coarse and fine particulate matter at
Navi Mumbai, India. Aerosol and Air Quality Research, 8(4): 423-436
Lenschow P, Abraham H, Kutzner K, et al. 2001. Some idea about the source of PM10. Atmospheric
Environment, 35: 523-533
Tasic M, Rajsic S, Novakcvic V, et al. 2006. Atmospheric aerosols and their influence on air quality in urban areas. Facta Universitatis - series Physics, Chemistry and Technology, 4(1): 83-91
Manoli E, Voutsa D, Samara C. 2002. Chemical characterization and source identification/apportionment of fine and coarse air particles in Thessaloniki Greece. Atmosphere Environment, 36: 949-961
Marcazzan G, Baccaro S, Valli G, et al. 2001. Characterization of PM10 and PM2.5 particulate matter in the
ambient air of Milan (Italy). Atmospheric Environment, 35: 4639-4650
Mayol-Bracero L, Guyon P, Graham B, et al. 2002. Water-soluble organic compound in biomass burning
aerosols over Amazonia 2. Apportionment of the chemical composition and importance of the polyocidic fraction. Journal of Geophysical Research: Atmospheres (1984-2012), 107(D20), 8091 (doi 10:
1029/200/JD 000522)
Miroslav R, Vladimir NB. 1999. Practical Environmental Analysis. The Royal Society of Chemistry, UK Nadel JA. 1965. Med. Thorac 22, 231.
Ndiokwere CL. 1983. Analysis of Nigerian petroleum for trace elements by neutron activation. Radiochem. Radioanal. Letters, 59: 201-212
NPC. 2005/2006. National Population Commission Census. Nigeria
Obioh IB, Olise FS, Owoade OK, et al. 2005. Chemical characterization of suspends particulates along air corridors of motor ways in two Nigeria cities. Journal of Applied Sciences, 5: 347-350
Oyedele DJ, Obioh IB, Adejumo TA, et al. 1995. Lead Contamination of Soil and Vegetation in the Vicinity of a lead smelter in Nigeria.The Science of the Total Environment, 172: 189-195
Parml G, Shierl R. 2000 Dust exposure in Munich Public transportation: a comprehensive 4 year survey 1 buses and trams. International Archives of Occupation and Environmental Health, 73: 209-214
Pfeifer GD, Harrison RM, Lynam DR. 1999. Personal exposure to airborne metals in London taxi drivers and
office workers in 1995 and 1996. The Science of the Total Environment, 235: 253-260
Pio CA, Silva PA, Cerqueira MA, et al. 2005. Diurnal and seasonal emissions of volative organic compounds
from cork Oak (Quercus Suber) trees. Atmospheric Environment, 39: 1817-1822
Proceedings of the Symposium on Biological Tests in Evaluation of Mutagenicity and Carcinogenicity of Air
Pollutants with Special Reference to Motor Exhaust, and Coal Combustion Products. 1983. Environmental Health Perspectives, 47: 1-324
Prajapati SK. 2012. Ecological effect of airborne particulate matter on plants. Environmental Skeptics and
Critics, 1(1): 12-22
6407-6417
Reports of Committee A.S. on Commission of Iron and Steel. 1952. AM Soc. Testing Mater Proc., 52: 106
Schauer JJ, Kleeman MJ, Cass GR, et al. 2001. Measurement of emissions from air pollution sources 3(-1-(-29) organic compounds from fire place combustion of wood. Environmental Science and Technology, 35: 1716-1728
Schauer JJ, Kleeman MJ, et al. 2002. Measurement of emissions from air pollution sources 4(-1-c-29) organic compounds from cooking with seed oils. Environmental Science and Technology, 36: 567-575
Shaw RW. 1987. Air polllution by particles. Scientific American, 257: 96-103
Stephanou EG, Stratigakis N. 1993. Oxocarbonoxylic and X, W-dicarboxylic acids: Photoxidation products of biogenic unsaturated fatty acids present in Urban aerosols. Environmental Science and Technology, 27:
1403-1407
Telesca L, Lovallo M. 2011. Complexity analysis in particulate matter measurements. Computational Ecology
and Software, 1(3): 146-152
Ukpebor EE, Ukpebor JE, Efebomo G. 2004. Assessment of the effect of a medical waste incinerator on the
ambient dose of TSP and NO2. Internation Journal of Chemistry, 14(2): 111-117
UNEP/WHO. 1994. GEMS/Air Methodology Reviews Measurement of Suspended Particulate Matter in Ambient Air. WHO/EOS/94.3/UNEP/GEMS/94, UNEP, Nairobi, Kenya
Lu WZ, Wang XK. 2008. Investigation of respirable suspended particulate trend and relevant environmental in Hong Kong down town areas. Chemosphere, 71: 561-567
Winkler EM. 1965. Science, 147: 459
Yang F, He K, Ye K, et al. 2005. One year record of organic and elemental carbon in fine particles in downtown Beijing and Shanghai. Atmospheric Chemistry and Physics, 5: 1449-1457
Kim YS, Roh YM, Lee CM, et al. 2007. Exposure level of particle matter materials and CO2 in sublunary
carriages in Seoul. The 6th International Conference on Indoor Air Quality, Ventilation & Energy Conservation in Buildings IAQVEC 2007. Sendai, Japan