www.atmos-chem-phys.net/17/1543/2017/ doi:10.5194/acp-17-1543-2017
© Author(s) 2017. CC Attribution 3.0 License.
Technical note: Coordination and harmonization of the multi-scale,
multi-model activities HTAP2, AQMEII3, and MICS-Asia3:
simulations, emission inventories, boundary conditions, and
model output formats
Stefano Galmarini1, Brigitte Koffi1, Efisio Solazzo1, Terry Keating2, Christian Hogrefe3, Michael Schulz4, Anna Benedictow4, Jan Jurgen Griesfeller4, Greet Janssens-Maenhout1, Greg Carmichael5, Joshua Fu6, and Frank Dentener1
1European Commission, Joint Research Centre, Ispra, Italy
2Environmental Protection Agency, Applied Science and Education Division, National Center for Environmental Research,
Office of Research and Development, Headquarters, Federal Triangle, Washington, DC 20460, USA
3Environmental Protection Agency, Computational Exposure Division, National Exposure Research Laboratory,
Office of Research and Development, Research Triangle Park, NC 27711, USA
4Norwegian Meteorological Institute, Oslo, Norway
5Center for Global and Regional Environmental Research, University of Iowa, Iowa City, IA 52242, USA 6Department of Civil & Environmental Engineering, University of Tennessee, Knoxville, TN 37996, USA
Correspondence to:Stefano Galmarini ([email protected])
Received: 16 September 2016 – Published in Atmos. Chem. Phys. Discuss.: 18 October 2016 Revised: 14 December 2016 – Accepted: 3 January 2017 – Published: 31 January 2017
Abstract.We present an overview of the coordinated global numerical modelling experiments performed during 2012– 2016 by the Task Force on Hemispheric Transport of Air Pollution (TF HTAP), the regional experiments by the Air Quality Model Evaluation International Initiative (AQMEII) over Europe and North America, and the Model Intercom-parison Study for Asia (MICS-Asia). To improve model es-timates of the impacts of intercontinental transport of air pollution on climate, ecosystems, and human health and to answer a set of policy-relevant questions, these three ini-tiatives performed emission perturbation modelling experi-ments consistent across the global, hemispheric, and conti-nental/regional scales. In all three initiatives, model results are extensively compared against monitoring data for a range of variables (meteorological, trace gas concentrations, and aerosol mass and composition) from different measurement platforms (ground measurements, vertical profiles, airborne measurements) collected from a number of sources. Ap-proximately 10 to 25 modelling groups have contributed to each initiative, and model results have been managed cen-trally through three data hubs maintained by each initiative.
Given the organizational complexity of bringing together these three initiatives to address a common set of policy-relevant questions, this publication provides the motivation for the modelling activity, the rationale for specific choices made in the model experiments, and an overview of the orga-nizational structures for both the modelling and the measure-ments used and analysed in a number of modelling studies in this special issue.
1 Introduction
transport and formation of air pollution; its impacts on cli-mate, ecosystems, and human health; and the potential miti-gation opportunities.
In 2010, TF HTAP produced the first comprehensive as-sessment of the intercontinental transport of air pollution in the Northern Hemisphere (TF HTAP, 2010a, b). A series of four reports addressed issues around emissions, transport, and impacts of particulate matter and ozone, mercury, and persistent organic pollutants (POPs), as well as their rele-vance for policy. The HTAP Phase 1 (HTAP1) joint mod-elling experiments, in which more than 20 global models participated, focussed on the meteorological year 2001. In 2012, the TF HTAP launched a new phase of cooperative multi-model experiments and analyses to provide up-to-date information to CLRTAP (e.g. Maas and Grenfellt, 2016) and other multi-lateral cooperative efforts, as well as national ac-tions to decrease air pollution and its impacts.
The objectives of the HTAP Phase 2 (HTAP2) activity are summarized as follows:
– to estimate relative contributions of regional and extra-regional sources of air pollution in different regions of the world, by refining the source–receptor relationships derived from the HTAP Phase 1 simulations;
– to provide a basis for model evaluation and process studies to characterize the uncertainty in the estimates of regional and extra-regional contributions and under-stand the differences between models;
– to give input to assessments of the impacts of con-trol strategies on the contribution of regional and extra-regional emissions sources to the exceedance of air quality standards and to impacts on human health, ecosystems, and climate.
The major advances of HTAP2 over the earlier HTAP1 ex-periments were the following:
– A focus on more recent years as a basis for extrap-olation (2008–2010), including an updated collection of emission inventories for 2008 and 2010 (Janssens-Maenhout et al., 2015) that is utilized across all model experiments. In HTAP1 the year of interest was 2001, and in contrast to HTAP2, the anthropogenic emissions used by the different modelling groups were expected to be loosely representative for the beginning of the 2000s but were not prescribed, resulting in a large diversity of baseline emissions.
– An expanded number of more refined source/receptor regions: the original set of four rectangular (in latitude– longitude coordinates) source regions (North America, Europe, south Asia, and east Asia) identified in HTAP1 have been refined to align with geo-political borders, and additional regions have been added, dividing the world into 16 potential source regions and 60 receptor regions.
– The use of regional models and consistent boundary conditions from selected global models for Europe, North America, and Asia to provide high-resolution es-timates of the impacts on health, vegetation, and cli-mate, in addition to the global models’ worldwide cov-erage.
The most innovative aspect of the modelling work, per-formed in 2013–2016, is the consistent coupling of global and regional model experiments using existing modelling frameworks. The regional counterparts of the HTAP2 activity are the AQMEII (Air Quality Model Evaluation International Initiative) and MICS-Asia (Model Intercomparison Study for Asia) activities.
The AQMEII project was launched in 2008 in an attempt to bring together modellers from both sides of the Atlantic Ocean to perform joint regional model experiments using common boundary conditions, emissions, and model evalua-tion frameworks with a specific focus on regional modelling domains over Europe and North America (Rao et al., 2012). The first two AQMEII activities focused on the develop-ment of general model-to-model and model-to-observation evaluation methodologies (phase 1; Galmarini et al., 2012a) and the simulation of aerosol–climate feedbacks with on-line coupled modelling systems (phase 2; Galmarini et al., 2015). AQMEII Phase 3 (AQMEII3) is devoted to perform-ing joint modellperform-ing experiments with HTAP2. The AQMEII modelling community (Table 5) includes almost all of the major existing modelling systems for regional-scale chemi-cal transport simulation in research and regulatory applica-tions on both continents. Most of the groups participating are part of modelling initiatives in the individual European mem-ber states, and some of these groups utilize models developed in North America, thus providing the opportunity of assess-ing the application of these models outside of their conven-tional modelling context.
The MICS-Asia Phase III (MICS3) project is an activity building on work performed in phase I (1998–2000; sulfur transport and deposition) and phase II (2004–2009; sulfur, nitrogen, ozone, and aerosols; see Fu et al., 2008). MICS3 is organized as a multi-national consortium of institutions and brings together modellers from China, Japan, Korea, south-east Asia, and the United States (Table 6). The overall scope of MICS3 includes evaluation of the ability of models to re-produce pollutant concentrations under highly polluted con-ditions, dry and wet deposition fluxes, and the quantification of the effects of uncertainties due to process representation (emissions, chemical mechanisms, transport and deposition) and model resolution on simulated air quality. The joint eval-uation with HTAP2 focuses on the evaleval-uation of the role of long-range transport of air pollution both within and to/from east Asia on air quality and impacts on climate, ecosystems and human health.
observa-tions and models; Schulz et al., 2009; Myhre et al., 2013), and dedicated experiments on long-range transport were designed and performed in collaboration with HTAP as part of AeroCom phase 3 (see https://wiki.met.no/aerocom/ phase3-experiments), with an additional focus on long-range transport of dust and fire-derived aerosol. The data storage and evaluation platform for global models was shared be-tween AeroCom and HTAP2 (see Sect. 2.5).
Presently these three activities involve 23 global-scale models (Table 3) and approximately 30 regional-scale mod-elling groups performing model simulations in the North American, European, and east Asian domains, probably making the HTAP2–AQMEII3–MICS3 exercise the largest multi-scale/multi-model activity ever performed in atmo-spheric chemical modelling. The scale and multi-regional modelling exercise required three independent or-ganizations to manage and engage their respective communi-ties and an overarching coordination effort as well as a high level of harmonization of the model simulations aiming at comparability, usability, and interoperability of the model sults at the various scales. Specific decisions were made re-garding the simulation period, lower air boundary conditions (emission inventory), volatile organic compound (VOC) spe-ciation, methane concentrations, emission perturbation runs, source region perturbations, lateral and upper air boundary conditions for regional simulations, variables expected for the analysis, file naming conventions, type and location of monitoring sites where model results were output, data sub-mission procedures, and the development and use of interop-erable data archiving and visualization servers.
The scope of this note is to provide information on the modelling activity harmonization and coordination adopted to guarantee the maximum level of coherence between the global and regional simulations. It provides specific de-tails on the organization of the global HTAP2 and the re-gional AQMEII3 activities, but only general information on the MICS3 experiments is provided. Additional details regarding HTAP2 are summarized at http://iek8wikis.iek. fz-juelich.de/HTAPWiki/ and are available in the report by Koffi et al. (2016) and for AQMEII3 at http://ensemble2.jrc. ec.europa.eu/aqmeii/.
This note provides coherent information on the simula-tions performed and their characteristics to support the anal-ysis articles presented in this special issue.
2 The HTAP2, AQMEII3, and MICS3 modelling exercises set-up
The following aspects were harmonized in the organization of this multi-scale, multi-chemical-transport-model activity:
– Simulation periods and meteorology to be used. – Emission inventories for global and regional models.
– Boundary conditions for regional-scale air quality mod-els.
– Harmonization of global and regional model output and interoperability of data repositories to facilitate the ex-change and analysis of model outputs.
– Monitoring data locations and methods for comparing models with observations.
– Documentation of individual model set-up and con-struction of ensemble averages.
2.1 Simulation period and meteorology used
The simulation period of interest 2008–2010 was chosen on the basis of the availability of emissions data and intensive observations. The models were requested to run the 3-year period with a priority given to the year 2010, followed by 2008 and then 2009. Global models can use meteorological data representative of the respective year, e.g. driven or con-strained by one of the global analysis products that were most convenient to the modelling group. Regional-scale modellers also were free to use the meteorological model of their choice based on compatibility with their chemical transport model. Sets of chemical boundary conditions for the regional models were provided by a limited set of global models participating in the global modelling experiments (see Sect. 2.4)
2.2 Emission data
The anthropogenic emission data were harmonized across the regional and global modelling experiments. The Joint Research Centre’s (JRC) EDGAR (Emission Database for Global Atmospheric Research) team – in collaboration with regional emission experts from the US Environmental Pro-tection Agency (EPA), EMEP (European Monitoring and Evaluation Programme), CEIP (Centre on Emission Inven-tories and Projections), TNO (Netherlands Organisation for Applied Research), the MICS-Asia scientific community, and REAS (Regional Emission Activity Asia) – has compiled a composite of regional emission inventories with monthly grid maps that include EDGARv4.3 gap filling for regions and/or sectors that were not provided by the regional inven-tories.
The HTAP_v2.2 database (Janssens-Maenhout et al., 2015), used in the global modelling experiments, has the fol-lowing characteristics:
– years 2008 and 2010, yearly and monthly time resolu-tions;
– components: SO2, NOx, non-methane VOC (NMVOC),
CH4, CO, NH3, PM10, PM2.5, BC, and OC at
sector-specific level;
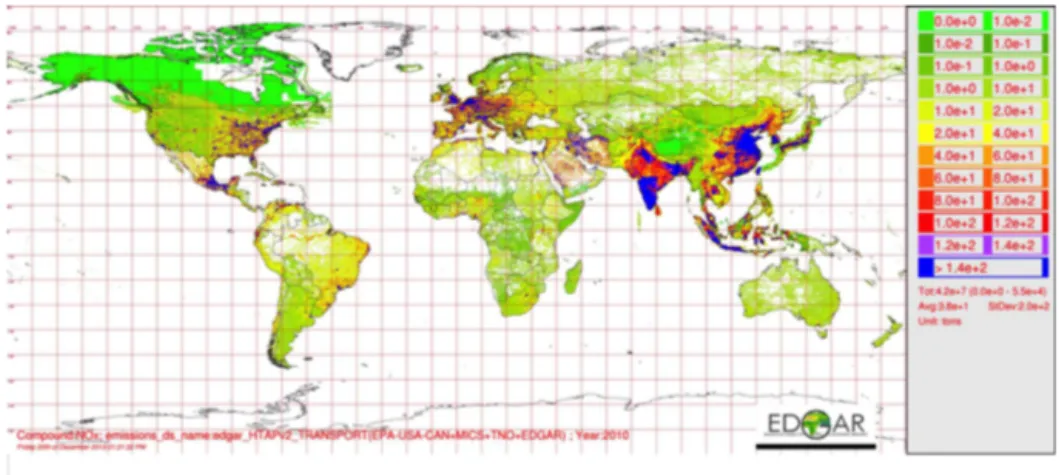
Figure 1.Example of HTAP_v2.2 emission mosaics for NOxin the transport sector.
– global coverage with spatial resolution of 0.1◦×0.1◦longitude and latitude, to serve the needs of both global and regional model activities.
Annual gridded emission data (http://edgar.jrc.ec.europa. eu/htap_v2) are delivered for each pollutant and emission sector. Monthly gridded values are provided for some sec-tors (energy, industry, transport, and residential), where in-formation was available to disaggregate annual emissions. For 2009 no emissions were provided, leaving the choice to the modelling group to either interpolate the 2008 and 2010 data or leave them constant.
The regional emissions for the North American and Euro-pean regional-scale simulations of AQMEII3 are described in Pouliot et al. (2015), were used earlier for AQMEII2 (Gal-marini et al., 2015), and are embedded into the HTAP_v2.2 inventory. The Asian inventory MIX (Li et al., 2015) was developed for MICS3 and HTAP2 simulations on a 0.25◦
×0.25◦resolution and converted by raster resampling
to 0.1◦
×0.1◦resolution for use in HTAP2. These regional
inventories have been combined to form a global mosaic (Fig. 1) that is consistent with inventories used at the re-gional scale in Europe, North America, and Asia. However, we note that these emission estimates stemming from differ-ent data sources for differdiffer-ent regions of the world are not necessarily consistent with each other; for example different fuel statistics or emission factors may have been used for dif-ferent regions. Details on the recommended VOC speciation and other specific emission information can be found in Koffi et al. (2016), Janssens Maenhout (2015), Li et al. (2015), and Pouliot et al. (2015).
Biomass burning emissions have not been prescribed for the global modelling groups, but it is recommended that groups use Global Fire Emission Database version 3 (GFED3) data, which are available at daily and 3 h inter-vals (see http://globalfiredata.org/). For the regional mod-elling groups participating in AQMEII3, fire emissions were included in the inventories distributed to the
par-ticipants (Pouliot et al., 2015; Soares et al., 2015). Bio-genic NMVOCs, soil and lightning NOx, dust, and sea salt
emissions have not been prescribed for either the global or regional modelling groups; modelling groups are en-couraged to use the best information that they have avail-able, except that the AQMEII3 regional modelling groups were advised not to include lightning NOx in their
sim-ulations since not all modelling groups had a mechanism for including them. For wind-driven DMS (dimethyl sul-fide) emissions from oceans, the climatology of ocean sur-face concentrations described in Lana et al. (2011) was recommended in conjunction with the model’s meteorol-ogy and emission parameterization for the global models. The regional models participating in AQMEII3 did not con-sider DMS emissions. For volcanic emissions, it was rec-ommended that global groups use the estimates developed for 2008–2010 for AeroCom as an update of the volcanic SO2inventory of Diehl et al. (2012) and accessible at http://
aerocom.met.no/download/emissions/HTAP/. As in the case of lightning NOx emissions, the AQMEII3 regional
mod-elling groups were advised not to include volcanic emis-sions in their simulations since not all modelling groups had a mechanism for including them. Modelling groups were asked to document the source of all of their emissions data and assumptions, especially if it deviated from the recom-mended parameterizations. For mercury, the Arctic Mon-itoring and Assessment Programme (AMAP)/United Na-tions Environmental Programme (UNEP) global emissions inventory for 2010 was recommended (http://www.amap.no/ mercury-emissions). None of the regional models participat-ing in AQMEII3 considered mercury in their simulations. 2.3 Emission perturbation
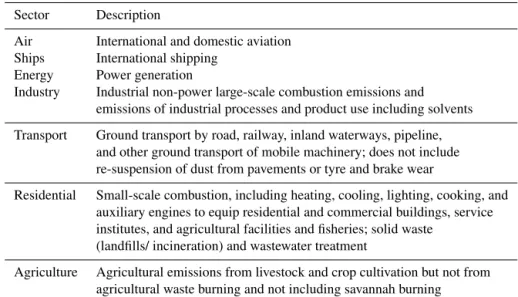
de-Table 1.Emission sectors in HTAP_v2.2 database.
Sector Description
Air International and domestic aviation Ships International shipping
Energy Power generation
Industry Industrial non-power large-scale combustion emissions and emissions of industrial processes and product use including solvents
Transport Ground transport by road, railway, inland waterways, pipeline, and other ground transport of mobile machinery; does not include re-suspension of dust from pavements or tyre and brake wear
Residential Small-scale combustion, including heating, cooling, lighting, cooking, and auxiliary engines to equip residential and commercial buildings, service institutes, and agricultural facilities and fisheries; solid waste
(landfills/ incineration) and wastewater treatment
Agriculture Agricultural emissions from livestock and crop cultivation but not from agricultural waste burning and not including savannah burning
Table 2.BASE and methane perturbation runs.
Simulation Global CH4 Representative of
concentration (ppbv)
BASE 1798 2010 based on IPCC (2013) CH4INC 2121 2030 under RCP 8.5 CH4DEC 1562 2030 under RCP2.6
rived impacts to regional and extra-regional sources; and to be used for scenario evaluations including uncertainties. Fig. 2 lists a large number of possible perturbation experi-ments; all except the methane perturbation experiments in-volve a 20 % decrease in anthropogenic emissions similar to HTAP1. The choice of 20 % was motivated by the consider-ation that the perturbconsider-ation would be large enough to produce a sizeable impact (i.e. more than numerical noise) even at long distances while small enough to be in the near-linear at-mospheric chemistry regime, assumptions which are subject to further analysis. The emission decreases are specified for combinations of pollutants, regions, and sectors.
To capture the impact of changing methane emissions in a single-year simulation, it is necessary to perturb the methane concentration instead of the emissions. The recommended perturbations (Table 2) are intended to cover the range of CH4concentration changes associated with the
Representa-tive Concentration Pathway (RCP) scenarios used for the In-tergovernmental Panel on Climate Change (IPCC) Fifth As-sessment Report (AR5) (IPCC, 2013) for 2030. The highest priority was assigned to an increase of global CH4
concen-trations to 2121 ppbv (representative of RCP8.5). The next priority is assigned to a decrease of global CH4
concentra-tions to 1562 ppbv (representative of RCP2.6).
The combination of global (all regions and sources) and regional perturbation experiments provides the necessary in-formation to calculate the so-called RERER (response to extra-regional emission reductions) metric, using the infor-mation on the contribution of foreign emission perturbations relative to all worldwide emission perturbation to a change in regioni.
RERERi=
6Rforeign
6Rall =
Rglobal−Rregion,i
Rglobal , (1) whereRglobal is the global response of a quantity (e.g. sur-face O3concentration) in the global 20 % perturbation
simu-lation (GLO) minus the value in the unperturbed simusimu-lation (BASE) and Rregion is the regional response of that quan-tity in the regional 20 % emission perturbation simulation minus its value in BASE. The metric can be applied to a range of quantities, including surface concentrations, column amounts, and derived parameters.
A low (i.e. near 0) RERER value means that the sig-nal within a region is not very sensitive to extra-regiosig-nal emission reductions and that local concentrations (or column amounts, etc.) depend more on local emission reductions given the current distribution of anthropogenic and biogenic emissions. A high RERER value (i.e. near 1) suggests that lo-cal conditions are strongly influenced by emissions changes outside the region. In some circumstances, when emission re-ductions correspond to increasing concentrations (e.g. ozone titration by NO emissions), RERER can be larger than 1. 2.4 Boundary conditions for regional simulations
Figure 2.HTAP2 emission perturbation experiments; dark green colour with 1 are highest priority experiments, light green next prior-ity, and white lower priority. ALL refers to perturbation of all anthropogenic components and sectors; sectors are TRN (transportation), PIN (power+industry), RES (residential), OTH (Other), FIR (fire), and DST (mineral dust).
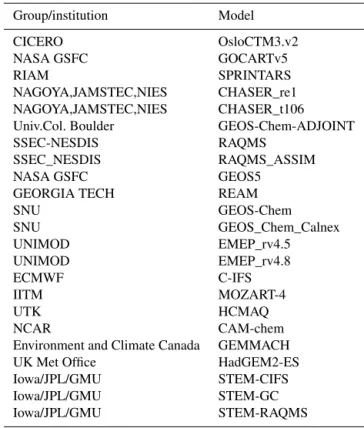
Table 3.Global models and institutions participating in HTAP2.
Group/institution Model
CICERO OsloCTM3.v2 NASA GSFC GOCARTv5
RIAM SPRINTARS
NAGOYA,JAMSTEC,NIES CHASER_re1 NAGOYA,JAMSTEC,NIES CHASER_t106 Univ.Col. Boulder GEOS-Chem-ADJOINT SSEC-NESDIS RAQMS
SSEC_NESDIS RAQMS_ASSIM NASA GSFC GEOS5
GEORGIA TECH REAM
SNU GEOS-Chem
SNU GEOS_Chem_Calnex UNIMOD EMEP_rv4.5 UNIMOD EMEP_rv4.8
ECMWF C-IFS
IITM MOZART-4
UTK HCMAQ
NCAR CAM-chem
Environment and Climate Canada GEMMACH UK Met Office HadGEM2-ES Iowa/JPL/GMU STEM-CIFS Iowa/JPL/GMU STEM-GC Iowa/JPL/GMU STEM-RAQMS
of (a) finer spatial and temporal resolution of regional models and (b) different processes represented in global and regional models.
In order to “nest” the regional within the global simula-tions, computational results from one or more global models
Figure 3. Domains of the regional model simulations and source/receptor areas.
are needed as boundary conditions for the regional models’ domains (Fig. 3), typically provided as a set of time-varying concentrations of medium-to-long-lived components in a 3-D box over the respective regional model domains at typical time resolutions of 3 to 6 h.
Figure 4.Example set of experiments, with both a global and regional model (in this case a regional model over east Asia, red box), where the regional source perturbation is east Asia (blue shading) and is wholly within the regional model domain. Note that the magnitude of the emission perturbation in the region of consideration is identical between the global and regional model.
example where the HTAP2 source region (in this case, east Asia) is wholly within the regional model domain. The in-clusion of the global perturbation simulation (GLO scenario for all pollutants: GLOALL) allows consistent evaluation of the RERER metric for the 20 % reductions of all emissions in both global and regional models (see Sect. 2.3).
Regional models were free to use as boundary conditions one or more models as long as they were selected from the set of global models participating in HTAP2, but in practice the AQMEII3 community focused its effort on C-IFS(CB05) (Flemming et al., 2015) calculations. Geophysical Fluid Dy-namic Laboratory/Atmospheric Model 3 (GFDL/AM3; Lin et al., 2012a, b) and the Global Earth Observing System Chemistry model (GEOS-Chem; Park et al., 2004; Bey et al., 2001) were additionally used in some North American simu-lations. GEOS-Chem and CHASER (Sudo et al., 2002; Sudo and Akimoto, 2007; Watanabe et al., 2011; Sekiya and Sudo, 2014) were the preferred models for the MICS3 consortium. 2.5 Specification of the global- and regional-scale
model outputs
Careful consideration was given to the organization of the model output, given the large number of models,
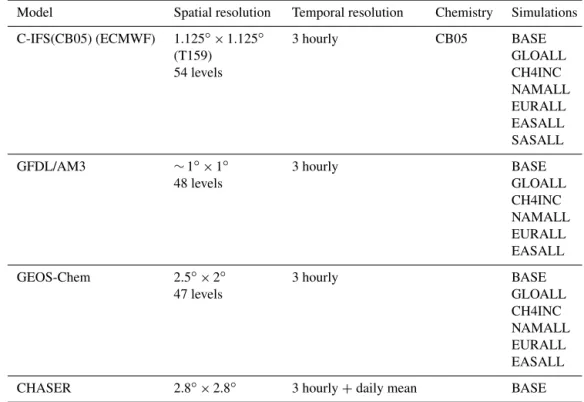
Table 4.2008, 2009, and 2010 HTAP2 global runs for regional boundary conditions.
Model Spatial resolution Temporal resolution Chemistry Simulations
C-IFS(CB05) (ECMWF) 1.125◦×1.125◦ (T159)
54 levels
3 hourly CB05 BASE GLOALL CH4INC NAMALL EURALL EASALL SASALL
GFDL/AM3 ∼1◦×1◦ 48 levels
3 hourly BASE
GLOALL CH4INC NAMALL EURALL EASALL
GEOS-Chem 2.5◦×2◦ 47 levels
3 hourly BASE
GLOALL CH4INC NAMALL EURALL EASALL
CHASER 2.8◦×2.8◦ 3 hourly+daily mean BASE
ENSEMBLE (Galmarini et al., 2014) platforms. Data for MICS3 modelling community were handled and analysed at the Joint International Center on Air Quality Modeling Stud-ies (JICAM) in Beijing, China, a joint cooperation between the Institute of Atmospheric Physics (IAP) of the Chinese Academy of Sciences and the Asia Center for Air Pollution Research (ACAP) in Niigata, Japan. These facilities allow not only the organization of the data produced by various sources around the world but also their consultation through web interfaces and the matching of the model results with the available measured data and the statistical comparison of these two pieces of information. A connection and au-tomatic data conversion protocol between the ENSEMBLE and AeroCom platforms was also pioneered to allow the bi-directional transfer of model data and a consistent compari-son of global and regional model results with a common set of observations.
Global model data from this study can be accessed via the AeroCom data server at MetNo. Data are organized such that the HTAP2 model version, experiment, period, and variable name can be identified readily from directory and file names. Model output providers have to register at the database provider MetNo and are provided with access to a Linux server via ssh (see further details at https://wiki.met. no/aerocom/user-server). This server also provides essential and standard data inspection, analysis, and extraction tools for netCDF files (ncdump, ncview, python, nco, cdo, etc.). Users may utilize these tools to retrieve files or subsets of them for further analysis. All incoming files are processed
with the AeroCom visualization tools to generate “quick-look” images for initial inspection. All variables are plotted as fields for major regions, each month and season. Where available, comparisons are made to surface observations, mainly those from the EBAS database maintained by the Norwegian Institute for Air Research (NILU, ebas.nilu.no) and from Aeronet (http://aeronet.gsfc.nasa.gov). The quick-look images are publicly available via the web interface at http://aerocom.met.no/cgi-bin/aerocom/surfobs_annualrs. pl?PROJECT=HTAP&MODELLIST=HTAP-phaseII-ALL.
To facilitate the comparability of model results with mea-sured data, the former were requested as time series at sur-face locations, or vertical profiles, mostly located in Eu-rope and North America, enabling the comparison of the AQMEII3 and HTAP2 experiments. Model results were re-quested in various forms. Specifically, 4128 surface stations were identified for the comparison of gas phase species, 2068 surface stations were identified for the comparison of aerosol species, and 240 stations were identified for the evaluation of vertical profiles. These locations are a mixture of stations of global and regional significance and spatial representative-ness (Fig. 5). Details of the data requests for HTAP2 can be found in Koffi et al. (2016).
Table 5.Institutions and models involved in AQMEII.
Operated by RCM Emission Horiz. Res. Lat x lon
Global Met Chem Mod
Finnish Meteorological Institute
ECMWF-SILAM_H, SILAM_M
EDGAR-HTAP; TNO-MACC
0.25×0.25◦ ECMWF CBM-IV
Netherlands Organisation for Applied Scientific Research
ECMWF-L.-EUROS
TNO-MACC 0.5×0.25◦ Interpolation from ECMWF
CBM-IV
INERIS/CIEMAT ECMWF-Chimere_H Chimere_M
EDGAR-HTAP; TNO-MACC
0.25×0.25◦ Interpolation from ECMWF
MELCHIOR2
University of L’Aquila WRF-WRF/Chem1
TNO-MACC 23 km ECMWF RACM-ESRL
University of Murcia WRF-WRF/Chem2
TNO-MACC 23 km×23 km ECMWF RADM2
Ricerca Sistema Energetico WRF-CAMx TNO-MACC 23 km×23 km ECMWF CB05
University of Aarhus WRF-DEHM EDGAR HTAP 50 km×50 km ECMWF Brandt et al. (2012) Istanbul Technical
University
WRF-CMAQ1 TNO-MACC 30 km×30 km NCEP CB05
Kings College WRF-CMAQ4 TNO-MACC 15 km×15 km NCEP CB05 Ricardo E&E WRF-CMAQ2 TNO-MACC 30 km×30 km NCEP CB05-TUCL Helmholtz-Zentrum
Geesthacht
CCLM-CMAQ EDGAR-HTAP 24 km×24 km NCEP CB05-TUCL
University of Hertfordshire WRF-CMAQ3 TNO-MACC 18 km×18 km ECMWF CB05-TUCL Helmholtz-Zentrum
Geesthacht
CCLM-CMAQ SMOKE 24 km×24 km NCEP CB05-TUCL
Environmental Protection Agency of the USA
WRF-CMAQ SMOKE 12 km×12 km NCEP (nudging) CB05-TUCL
RAMBOLL Environ WRF-CAMx SMOKE 12 km×12 km NCEP CB05 University of Aarhus WRF-DEHM EDGAR-HTAP 50 km×50 km interpolation
from ECMWF
Brandt et al. (2012)
Table 6.Institutions and models involved in MICS-Asia.
Group/institution Models
National Institute for Environmental Studies, Japan CMAQv4.7.1 Central Research Institute of Electric Power Industry, Japan CMAQv4.7.1
Kobe University, Japan CMAQv4.7.1
The University of Tennessee, Knoxville, USA CMAQv5.0.2 Sun Yat-Sen University, China (SYSU) CMAQv5.0.2 Institute of Atmospheric Physics, Chinese Academy of Sciences, China GEOS-Chem Institute of Atmospheric Physics, Chinese Academy of Sciences, China NAQPMS Meteorological Research Institute, Japan NHM-Chem Pusan National University, Korea (not in the analyses) WRF-Chem Academia Sinica, Taiwan (not in the analyses) WRF-Chem Institute of Atmospheric Physics, Chinese Academy of Sciences, China RAMSCMAQ Institute of Atmospheric Physics, Chinese Academy of Sciences, China (not in the analyses) WRF-Chem
protocol established for phase 1 and 2 of AQMEII (Galmarini and Rao, 2011).
MICS3 output includes monthly averaged hourly surface data for O3, NO, NO2, HNO3, and HONO; surface VOC
species consistent with the CB05, CBMZ, RADM2, and
SAPRC99 mechanisms; and wet/dry depositions of sulfur and nitrogen components.
Figure 5.Location of the stations where surface gas (top), surface aerosol (middle), and vertical profile (bottom) model outputs are requested.
should be emitted in the same quantity as total anthropogenic CO emissions (not including fires) and decay exponentially with uniform fixed mean lifetimes (or e-folding times) of 25 and 50 days, respectively, as in the Chemistry-Climate Mod-elling Initiative (CCMI).
3 Conclusions
This technical note provides details about the set-up of the joint regional-global chemistry–transport emission
health; and the potential mitigation opportunities. The major advances of HTAP2 with respect to previous HTAP1 activity are
– a focus on more recent years as a basis for extrapolation (2008–2010);
– a larger number of source/receptor regions;
– in collaboration with the existing regional-scale mod-elling initiatives AQMEII and MICS-ASIA, the use of regional models and consistent boundary conditions from selected global models for Europe, North Amer-ica, and Asia to provide higher-resolution estimates of the impacts of hemispheric transport of air pollution on health, ecosystems, and climate.
The multi-model, multi-scale, and multi-pollutant character of the activities performed in HTAP2 required a consider-able level of harmonization of the information used to run the models at different scales and of the results produced. Such harmonization considerably facilitates the interpretation of model results and inter-model differences. Particular atten-tion was given to providing coherent emissions and boundary conditions to the global- and regional-scale models, and har-monizing monitoring data collected to evaluate the model re-sults. To our knowledge such an attempt is unprecedented in the field and constitutes an important starting point for future multiple-scale modelling activities. A considerable effort has been made for the harmonization of data formats and web-based data hubs, allowing consultation of model and mea-surement data by the participants as well as possible exter-nal data users with simplicity and having a few “one-stop shops”, where all information is collected, geo-referenced, and ready to be used. As independently demonstrated in the past, by the ENSEMBLE and AeroCom experiences, such an approach effectively takes away the burden on individual modelling groups of collecting scattered measurement data and organizing these data sets for comparison with models. Moreover, this approach effectively provides benchmark data sets for objective comparisons across models.
While first steps towards fuller integration of protocols, re-quested outputs, and analysis methods were shared across the three communities, a fully interoperable and harmonized set of global and regional outputs was not yet obtained due to different requirements of the communities. Data can now be converted into two of the three formats available very easily (HTAP⇔AQMEII), and therefore the most important step to allow a full consultability of the data by the two com-munities has been made. The technical aspect of making the systems AeroCom and ENSEMBLE be mirrored into one an-other will also be explored in conjunction with available re-sources. All relevant elements are in place to make such steps possible. Such steps will also be performed possibly with the MICS-Asia data and information. At this stage, the availabil-ity of global and regional model outputs and observations at
a common set of monitors permits a first analysis of global-regional model performance in the North American, Euro-pean, and Asian domains and represents a significant step forward for both communities.
Many of the analyses presented in this special issue draw upon this unique collection of data and tools, which is open and available for further analysis. We encourage the scien-tific community to continue to explore these data to generate scientific and policy-relevant insights and to engage in the fu-ture development of the TF HTAP, AQMEII, and MICS-Asia activities.
4 Data availability
The data generated for the HTAP and AQMEII MICs-ASIA exercise are accessible through the data platforms described above upon contact with the managing organizations.
Competing interests. The authors declare that they have no conflict
of interest.
Acknowledgements. The AeroCom database at MetNo
re-ceived support from the CLRTAP under the EMEP programme, through the service contract to the European commission no. 07.0307/2011/605671/SER/C3, and benefitted from the Re-search Council of Norway project no. 229796 (AeroCom-P3). JRC received support for this work via Administrative Arrangement AMITO and AMITO2 from the European Commission DG Environment. TF HTAP, AeroCom, AQMEII, and MICS-Asia exist due to the relentless contributions of numerous excellent scientists actively engaged in the individual activities as well as in the wider TF programme. Although this work has been reviewed and approved for publication by the US Environmental Protection Agency, it does not necessarily reflect the views and policies of the agency. We thank Mian Chin for her support in designing and promoting the HTAP-AEROCOM experiments.
Edited by: B. R. D. Denby
Reviewed by: D. S. Stevenson and one anonymous referee
References
Bey, I., Jacob, D. J., Yantosca, R. M., Logan, J. A., Field, B. D., Fiore, A. M., Li, Q., Liu, H. Y., Mickley, L. J., and Schultz, M. G.: Global modeling of tropospheric chemistry with assim-ilated meteorology: model description and evaluation, J. Geo-phys. Res.-Atmos., 106, 23073–23095, 2001.
Diehl, T., Heil, A., Chin, M., Pan, X., Streets, D., Schultz, M., and Kinne, S.: Anthropogenic, biomass burning, and volcanic emissions of black carbon, organic carbon, and SO2from 1980
to 2010 for hindcast model experiments, Atmos. Chem. Phys. Discuss., 12, 24895–24954, doi:10.5194/acpd-12-24895-2012, 2012.
Flemming, J., Huijnen, V., Arteta, J., Bechtold, P., Beljaars, A., Blechschmidt, A.-M., Diamantakis, M., Engelen, R. J., Gaudel, A., Inness, A., Jones, L., Josse, B., Katragkou, E., Marecal, V., Peuch, V.-H., Richter, A., Schultz, M. G., Stein, O., and Tsikerdekis, A.: Tropospheric chemistry in the Integrated Fore-casting System of ECMWF, Geosci. Model Dev., 8, 975–1003, doi:10.5194/gmd-8-975-2015, 2015.
Fu, J. S., Jang, C. J., Streets, D. G., Li, Z., Kwok, R., Park, R., and Han, Z.: MICS-Asia II: Modeling gaseous pollutants and evalu-ating an advanced modeling system over East Asia, Atmos. Env-iron., 42 3571–3583, 2008.
Galmarini, S. and Rao, S. T.: The AQMEII two-continent Regional Air Quality Model evaluation study: Fueling ideas with unprecedented data, Atmos. Environ., 45, 2464, doi:10.1016/j.atmosenv.2011.03.025, 2011.
Galmarini S., Rao, S. T., and Steyn, D. G.: Preface to the AQMEII p1 Special issue, Atmos. Environ, 53, 1–3, 2012a.
Galmarini, S., Bianconi, R., Appel, W., Solazzo, E., Mosca, S., Grossi, P., Moran, M., Schere, K., and Rao, S. T.: ENSEMBLE and AMET: Two systems and approaches to a harmonized, sim-plified and efficient facility for air quality models development and evaluation, Atmos. Environ., 53, 51–59, 2012b.
Galmarini S., Hogrefe, C., Brunner, D., Makar, P., and Baklanov, A.: Preface to the AQMEII p2 Special issue, Atmos. Environ., 115, 340–344, 2015.
IPCC, Climate Change 2013: The Physical Science Basis. Con-tribution of Working Group I to the Fifth Assessment Report of the Intergovernmental Panel on Climate Change, edited by: Stocker, T. F., Qin, D., Plattner, G.-K., Tignor, M., Allen, S. K., Boschung, J., Nauels, A., Xia, Y., Bex, V., and Midgley, P. M., Cambridge University Press, Cambridge, UK and New York, NY, USA, 1535 pp., 2013.
Janssens-Maenhout, G., Crippa, M., Guizzardi, D., Dentener, F., Muntean, M., Pouliot, G., Keating, T., Zhang, Q., Kurokawa, J., Wankmüller, R., Denier van der Gon, H., Kuenen, J. J. P., Klimont, Z., Frost, G., Darras, S., Koffi, B., and Li, M.: HTAP_v2.2: a mosaic of regional and global emission grid maps for 2008 and 2010 to study hemispheric transport of air pollu-tion, Atmos. Chem. Phys., 15, 11411–11432, doi:10.5194/acp-15-11411-2015, 2015.
Koffi B., Dentener, F., Janssens-Maenhout, G., Guizzardi, D., Crippa, M., Diehl, T., Galmarini, S., and Solazzo, E.: Hemi-spheric Transport Air Pollution (HTAP): Specification of the HTAP2 experiments – Ensuring harmonized modelling, EUR 28255 EN – Scientific and Technical Research Reports, doi:10.2788/725244, 2016.
Lana, A., Bell, T. G., Simó, R., Vallina, S. M., Ballabrera-Poy, J., Kettle, A. J., Dachs, J., Bopp, L., Saltzman, E. S., Ste-fels, J., Johnson, J. E., and Liss, P. S.: An updated climatology of surface dimethylsulfide concentrations and emission fluxes in the global ocean, Global Biogeochem. Cy., 25, GB1004, doi:10.1029/2010GB003850, 2011.
Li, M., Zhang, Q., Kurokawa, J., Woo, J.-H., He, K. B., Lu, Z., Ohara, T., Song, Y., Streets, D. G., Carmichael, G. R., Cheng, Y. F., Hong, C. P., Huo, H., Jiang, X. J., Kang, S. C., Liu, F., Su, H., and Zheng, B., MIX: a mosaic Asian anthropogenic emis-sion inventory for the MICS-Asia and the HTAP projects, Atmos. Chem. Phys. Discuss., 15, 34813–34869, doi:10.5194/acpd-15-34813-2015, 2015.
Lin, M. Y., Fiore, M., Horowitz, L. W., Cooper, O. R., Naik, V., Holloway, J., Johnson, B. J., Middlebrook, A. M., Oltmans, S. J., Pollack, I. B., Ryerson, T. B., Warner, J. X., Wiedinmyer, C., Wilson, J., and Wyman, B.: Transport of Asian ozone pollution into surface air over the western United States in spring, J. Geo-phys. Res.-Atmos., 117, D00V07, 2012a.
Lin, M., Fiore, A. M., Cooper, O. R., Horowitz, L. W., Langford, A. O., Levy II, H., Johnson, B. J., Naik, V., Oltmans, S. J., and Senff, C. J.: Springtime high surface ozone events over the western United States: Quantifying the role of stratospheric intrusions, J. Geophys. Res., 117, D00V22, doi:10.1029/2012JD018151, 2012b.
Maas, R. and Grennfelt P. (Eds.): EMEP Steering Body and Work-ing Group on Effects of the Convention on Long-Range Trans-boundary Air Pollution, Towards Cleaner Air, Scientific Assess-ment Report, Oslo, xx, 50 pp., 2016.
Myhre, G., Samset, B. H., Schulz, M., Balkanski, Y., Bauer, S., Berntsen, T. K., Bian, H., Bellouin, N., Chin, M., Diehl, T., Easter, R. C., Feichter, J., Ghan, S. J., Hauglustaine, D., Iversen, T., Kinne, S., Kirkevåg, A., Lamarque, J.-F., Lin, G., Liu, X., Luo, G., Ma, X., Penner, J. E., Rasch, P. J., Seland, Ø., Skeie, R. B., Stier, P., Takemura, T., Tsigaridis, K., Wang, Z., Xu, L., Yu, H., Yu, F., Yoon, J.-H., Zhang, K., Zhang, H., and Zhou, C.: Radiative forcing of the direct aerosol effect from Aero-Com Phase II simulations, Atmos. Chem. Phys., 13, 1853–1877, doi:10.5194/acp-13-1853-2013, 2013.
Park, R. J., Jacob, D. J., Field, B. D., Yantosca, R. M., and Chin, M.: Natural and trans- boundary pollution influences on sulfate-nitrate-ammonium aerosols in the United States: implications for policy, J. Geophys. Res., 109, doi:10.1029/2011JD016961, 2004. Pouliot, G., Denier van der Gon, H. A. C., Kuenen, J., Zhang, J., Moran, M. D., and Makar, P. A.: Analysis of the emission inven-tories and model-ready emission datasets of Europe and North America for phase 2 of the AQMEII project, Atmos. Environ., 115, 345–360, 2015.
Rao, S., Mathur, R., Hogrefe, C. Keating, T., Dentener, F., and Gal-marini, S.: Path Forward for the Air Quality Model Evaluation International Initiative (AQMEII), EM, Air And Waste Manage-ment Associations Magazine For EnvironManage-mental Managers, 7, 38–41, 2012.
Schulz, M., Chin, M., and Kinne S.: The Aerosol Model Compar-ison Project, AeroCom, Phase II: Clearing Up Diversity, IGAC Newsletter, No. 41, 2–11, 2009.
Sekiya, T. and Sudo, K.: Roles of transport and chemistry processes in global ozone change on interannual and multidecadal time scales, J. Geophys. Res., 119, 4903–4921, 2014.
Soares, J., Sofiev, M., and Hakkarainen, J.: Uncertainties of wild-land fires emission in AQMEII phase 2 case study, Atmos. Envi-ron., 115, 361–370, 2015.
Sudo, K., Takahashi, M., Kurokawa, J., and Akimoto, H.: CHASER: A global chemical model of the tropo-sphere 1. Model description, J. Geophys. Res., 107, 7–20, doi:10.1029/2001JD001113, 2002.
TF HTAP (Task Force Hemispheric Transport of Airpollution): Part A, Ozone and Particulate Matter, in: Economic Commission for Europe, edited by: Dentener, F., Keating, T., and Akimoto, H., Air Pollution Studies, 17, UNECE, Geneva, 1–728, 2010a. TF HTAP (Task Force Hemispheric Transport of Airpollution): Part
D, Answers to Policy Relevant Science Questions, edited by: Keating, T., Zuber, A., Dentener, F., Seddon, J., Travnikov, O., Gusev, A., Carmichael, G., Parrish, D., and Grano, D., UNECE, Geneva, 2010b.