www.earth-syst-dynam.net/7/627/2016/ doi:10.5194/esd-7-627-2016
© Author(s) 2016. CC Attribution 3.0 License.
Vegetation–climate feedbacks modulate rainfall patterns
in Africa under future climate change
Minchao Wu1, Guy Schurgers2, Markku Rummukainen1,3, Benjamin Smith1, Patrick Samuelsson4, Christer Jansson4, Joe Siltberg1, and Wilhelm May3,5
1Department of Physical Geography and Ecosystem Science, Lund University, Sölvegatan 12, 223 62, Lund,
Sweden
2Department of Geosciences and Natural Resource Management, University of Copenhagen, Øster Voldgade
10, 1350 Copenhagen, Denmark
3Centre for Environmental and Climate Research, Lund University, Sölvegatan 37, 223 62 Lund, Sweden 4Rossby Centre, Swedish Meteorological and Hydrological Institute, 601 76, Norrköping, Sweden 5Research and Development Department, Danish Meteorological Institute, Lyngbyvej 100, 2100 Copenhagen,
Denmark
Correspondence to:Minchao Wu ([email protected])
Received: 14 December 2015 – Published in Earth Syst. Dynam. Discuss.: 18 January 2016 Revised: 27 June 2016 – Accepted: 6 July 2016 – Published: 26 July 2016
Abstract. Africa has been undergoing significant changes in climate and vegetation in recent decades, and continued changes may be expected over this century. Vegetation cover and composition impose important in-fluences on the regional climate in Africa. Climate-driven changes in vegetation structure and the distribution of forests versus savannah and grassland may feed back to climate via shifts in the surface energy balance, hy-drological cycle and resultant effects on surface pressure and larger-scale atmospheric circulation. We used a regional Earth system model incorporating interactive vegetation–atmosphere coupling to investigate the poten-tial role of vegetation-mediated biophysical feedbacks on climate dynamics in Africa in an RCP8.5-based future climate scenario. The model was applied at high resolution (0.44×0.44◦
) for the CORDEX-Africa domain with boundary conditions from the CanESM2 general circulation model. We found that increased tree cover and leaf-area index (LAI) associated with a CO2and climate-driven increase in net primary productivity, particularly over subtropical savannah areas, not only imposed important local effect on the regional climate by altering surface energy fluxes but also resulted in remote effects over central Africa by modulating the land–ocean temperature contrast, Atlantic Walker circulation and moisture inflow feeding the central African tropical rainforest region with precipitation. The vegetation-mediated feedbacks were in general negative with respect to temperature, dampening the warming trend simulated in the absence of feedbacks, and positive with respect to precipitation, enhancing rainfall reduction over the rainforest areas. Our results highlight the importance of accounting for vegetation–atmosphere interactions in climate projections for tropical and subtropical Africa.
1 Introduction
The Sahel greening and Congo rainforest browning observed since the 1980s suggest that Africa has been undergoing sig-nificant changes in the structure, composition and distribu-tion of vegetadistribu-tion during recent decades (Eklundh and Ols-son, 2003; Olsson et al., 2005; Jamali et al., 2014; Zhou et al.,
cal feedbacks along with the climate forcings. The type of vegetation alongside productivity-related structural aspects such as tree density and leaf-area index (LAI) are impor-tant determinants for surface albedo, roughness length and evapotranspiration, affecting surface energy fluxes that in turn control lower boundary layer thermodynamics (Eltahir, 1996; Brovkin et al., 2006; Bonan, 2008). Biophysical feedbacks operate locally and may also generate telecon-nections via heat and moisture advection, leading to al-tered atmospheric circulation (e.g. Avissar and Werth, 2005; Nogherotto et al., 2013). Previous studies have shown the im-portance of vegetation-mediated biophysical feedbacks for the past (e.g. Claussen and Gayler, 1997; Texier et al., 1997) and present (e.g. Eltahir, 1996; Claussen, 1998; Wang and Eltahir, 2000) climate over Africa. Hypothesized mecha-nisms of vegetation–atmosphere coupling include modula-tions of the surface albedo (Charney, 1975), changes in the North African monsoon system (Claussen, 1997) and inter-nal climate variability (Zeng et al., 1999).
Feedbacks mediated by shifts in vegetation structure and distribution can likewise play a role for the future regional climate. General circulation models (GCMs) have been ap-plied at relatively coarse lateral grid resolutions to capture these dynamics (e.g. Kucharski et al., 2013). Recent stud-ies have used a regional climate model to investigate the im-pact of climate–vegetation interaction for West Africa, iden-tifying significant vegetation feedback in modulating local hydrological cycling (e.g. Alo and Wang, 2010; Wang and Alo, 2012; Yu et al., 2015). Additionally, a number of GCM-based studies have investigated the climate effects of anthro-pogenic perturbations, such as deforestation or afforestation (e.g. Lawrence and Vandecar, 2015). Such studies point to potentially significant forcing of regional climate dynamics, particularly rainfall patterns, as a result of changes in land cover. No study to date has, however, characterized the cou-pled dynamics of vegetation and climate under future radia-tive forcing for the entire African domain at a grid resolution high enough to capture regional features and forcings.
In this study, we employ a regional Earth system model (ESM) that couples the physical component of a regional climate model (RCM) with a detailed, individual-based dy-namic vegetation model (DVM). This tool enables dydy-namic representation of biophysical interactions between the vege-tated land surface and the atmosphere and their effects on the evolution of climate and land surface biophysical properties to be analysed in an explicit way. We perform simulations
un-2.1 Model description
RCA-GUESS (Smith et al., 2011) is a regional ESM based on the Rossby Centre regional climate model RCA4 (Kjellström et al., 2005; Samuelsson et al., 2011) coupled with vegetation dynamics from the LPJ-GUESS DVM to account for land– atmosphere biophysical coupling (Smith et al., 2001, 2014).
The RCA4-based physical component of RCA-GUESS incorporates advanced regional surface heterogeneity, such as complex topography and multi-level representations of forests and lakes, which are significant in controlling the development of weather events from the local to mesoscale (Samuelsson et al., 2011). RCA4 has been applied in a range of climate studies worldwide (e.g. Döscher et al., 2010; Kjellström et al., 2011; Sörensson and Menéndez, 2011). The land surface scheme (LSS; Samuelsson et al., 2006) adopts a tile approach and characterizes land surface with open land and forest tiles with separate energy balances. The open land tile is divided into fractions for vegetation (herbaceous veg-etation) and bare soil. The forest tile is vertically divided into three sub-levels (canopy, forest floor and soil). Surface properties such as surface temperature, humidity and turbu-lent heat fluxes (latent and sensible heat fluxes) for differ-ent tiles in a grid box are weighted together to provide grid-averaged values. A detailed description is given by Samuels-son et al. (2006).
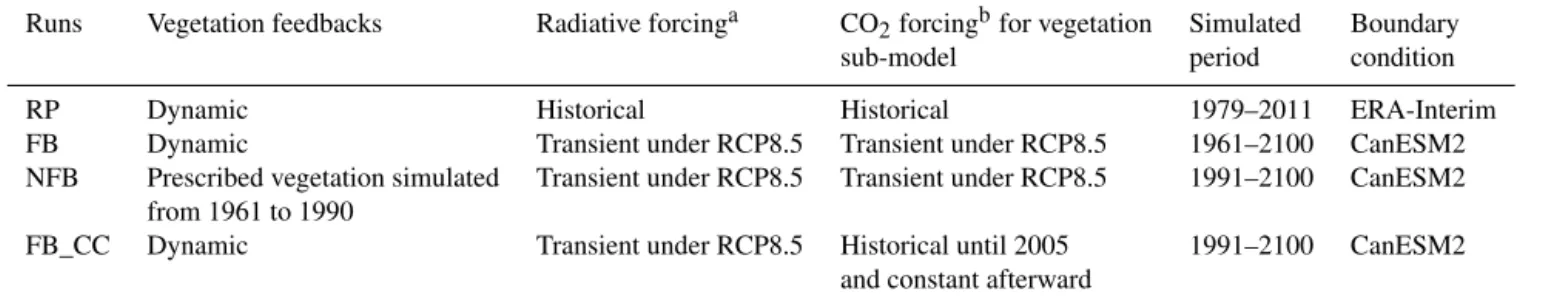
Table 1.Experimental design for the investigation of the vegetation–climate feedbacks in this study.
Runs Vegetation feedbacks Radiative forcinga CO2forcingbfor vegetation Simulated Boundary
sub-model period condition
RP Dynamic Historical Historical 1979–2011 ERA-Interim
FB Dynamic Transient under RCP8.5 Transient under RCP8.5 1961–2100 CanESM2 NFB Prescribed vegetation simulated Transient under RCP8.5 Transient under RCP8.5 1991–2100 CanESM2
from 1961 to 1990
FB_CC Dynamic Transient under RCP8.5 Historical until 2005 1991–2100 CanESM2 and constant afterward
Notes:ausing equivalent atmospheric CO
2concentration;busing actual atmospheric CO2concentration.
model (Smith et al., 2001, 2014; Weber et al., 2009; Hickler et al., 2012; Wårlind et al., 2014; Wu et al., 2015). Biophys-ical feedbacks have previously been studied in applications of RCA-GUESS to Europe and the Arctic (Wramneby et al., 2010; Smith et al., 2011; Zhang et al., 2014). A general de-scription of the coupling between the vegetation dynamics component LPJ-GUESS and the physical component RCA is provided in the Appendix. A more detailed description is given by Smith et al. (2011).
2.2 Model setup, experiments and analysis approach The simulations were applied over the African domain of the Coordinated Regional Climate Downscaling Experiment (CORDEX-Africa; Giorgi et al., 2009; Jones et al., 2011) on a horizontal grid with a resolution of 0.44◦×
0.44◦ . The period studied was 1961 to 2100. Forcing fields in 6 h time intervals (atmospheric fields and sea-surface tempera-ture (SST) as lateral and lower boundary conditions, respec-tively) were derived from the historical and RCP8.5 simula-tions with the CanESM2 GCM (Arora et al., 2011) in the Coupled Model Intercomparison Project Phase 5 (CMIP5; Taylor et al., 2012). Time-evolving forcing fields from the GCM were prescribed for all variables, including SSTs.
The vegetation sub-model LPJ-GUESS was set up with eight PFTs which represent the major elements of natural vegetation across Africa, including the tropical and warm-temperate forests and savannahs and C3and C4grasslands. The PFT parameter settings follow Morales et al. (2007) and are summarized in Table A1.
PFTs of the forest tile were simulated with 30 replicate patches. Average values of state variables across the repli-cate patches were used to determine biophysical parameters, i.e. forest fraction and LAI for trees versus grasses, provided as forcing to the physical sub-model. For the open land tile with herbaceous species, C3and C4grass was simulated de-terministically and aggregated to characterize open land veg-etation. Fire disturbance in response to climate and simulated fuel load (Thonicke et al., 2001) was included.
Following the approach of Wramneby et al. (2010) and Smith et al. (2011), RCA-GUESS was initialized with a
spin-up in two stages to achieve a quasi-steady-state representa-tive of mid-1900s conditions. After the spin-up, the model was run in coupled mode from 1961 onwards, with simulated meteorological forcing from the physical sub-model affect-ing vegetation phenology and structural dynamics and bio-physical land surface properties being adjusted to reflect the changes in vegetation, thereby affecting the physical climate dynamics. For comparison, a recent past experiment (RP, Ta-ble 1) with the same vegetation spin-up but thereafter driven by boundary conditions derived from ECMWF re-analysis (ERA-Interim) (Berrisford et al., 2009) was conducted for the period 1979–2011.
The simulation protocol was designed to enable biophys-ical feedbacks of vegetation changes to the evolving 21st century climate to be inferred. Three simulations were per-formed to investigate vegetation–climate feedbacks under fu-ture climate change (Table 1). The first simulation included the vegetation feedback (FB). It was run for 1961–2100 in coupled mode, allowing the effects of climate and atmo-spheric CO2 concentration (the latter taken directly from the RCP8.5 dataset) on vegetation state to feed back to the evolving climate. The second simulation was run with vege-tation feedback “switched off” (non-feedback run, NFB). It started with the state of FB simulation at 1991 and used a pre-scribed climatology of daily vegetation for 1961–1990 from the coupled simulation, but without transferring the simu-lated changes in vegetation in LPJ-GUESS to the land sur-face configuration, and associated biophysical sursur-face prop-erties, in the LSS of RCA. To attribute the component of the simulated vegetation changes resulting from physiolog-ical effects of rising CO2concentrations of plant productiv-ity and water-use efficiency, we performed a third simulation (FB_CC), which was similar to FB but started from the state of the FB simulation of 1991 and used historical atmospheric CO2 concentrations until 2005, held constant thereafter, to force the vegetation sub-model only.
Figure 1.Comparison between simulated and observed(a)annual mean near-surface air temperature,(b)annual precipitation and(c)annual maximum LAI for the period 1997–2010. Variables from the RP experiment(a1–c1)are compared with observations(a2–c2)and with those from the FB experiment(a3–c3), using RP minus observation and FB minus RP. For the comparison with observations(a2–c2), we used CRU temperature(a2)and precipitation(b2), as well as LAI3g (Zhu et al., 2013)(c2).
Vegetation feedbacks are calculated as the difference be-tween the future means of the FB and NFB runs.
2.3 Methods to evaluate model performance
Simulated near-surface atmospheric temperatures over open land, precipitation, and LAI were compared against observa-tions within the common available time period 1997–2010. Temperature and precipitation were compared with gridded observations from the CRU TS3.23 (Harris et al., 2014) dataset, focusing on the annual mean and seasonality. For precipitation we also employed the employed the datasets from the Global Precipitation Climatology Project (GPCP; Huffman et al., 2001; version 1.2 of the 1◦
daily product for October 1996–June 2011), which uses satellite data to up-scale rain gauge measurements and has been extensively used for African precipitation studies (e.g. Nikulin et al., 2012). For the LAI evaluation we used the GIMMS-AVHRR and MODIS-based LAI3g product (Zhu et al., 2013), which has been previously applied to the evaluation of vegetation dy-namics in ESMs (e.g. Anav et al., 2013).
To identify biases propagating from the model physics and from the GCM-derived boundary forcing data, we compared
the reanalysis-driven RP simulation against observation and against the GCM-driven (CanESM2) FB simulation for the same period.
3 Results
3.1 Model evaluation
To evaluate the model’s performance for the present day, the simulated annual mean and seasonality of 2 m air tempera-ture, precipitation and LAI are compared against the obser-vations (Figs. 1 and 2). The simulated annual mean temper-ature (Fig. 1a1) is generally higher in Northern Hemisphere (hereinafter “northern”) Africa than in Southern Hemisphere (hereinafter “southern”) Africa. The model generally shows a cold bias in the order of 1◦
C for northern and southern savan-nah (Fig. 1a2), dominated by the Northern Hemisphere sum-mer (JJA, Fig. 2a1, 2a3). Warm biases up to around 3◦
C oc-cur in northern Africa, and warm biases up to around 1◦
C in central Africa, where the warm bias originates mainly from summer (Fig. 2a2).
Figure 2.Simulated seasonal cycle and observations for northern savannah (inset ina1), central Africa (inset ina2) and southern savannah (inset ina3) for the period 1997–2010. Two-metre temperature(a1–a3)and precipitation(b1–b3)are as in Fig. 1. For LAI(c1–c3)monthly mean tile-weighted simulated LAI over the averaging period is used to compare with the observation.
belt between 25◦
N and 25◦
S, where the Atlantic moisture inflow (monsoon and equatorial westerlies) plays an impor-tant role (Fig. 1b1). Comparison with CRU reveals a consid-erable dry bias (−500 mm yr−1) for the central African rain-forest area and a wet bias (+250 mm yr−1) for the northern savannah. The simulated patterns and magnitude of precip-itation for this area are similar to a previous study using an earlier version of RCA, RCA3.5, without dynamic vegetation (Nikulin et al., 2012). In RCA, the dry bias for annual mean precipitation over central Africa may be partly due to the un-derestimated daily precipitation during the late afternoon and night in addition to observational uncertainties (Nikulin et al., 2012). The wet bias over the northern savannah is mainly caused by a too early onset of the rainy season (Fig. 2b1), which is possibly caused by the interactions between the sim-ulated deep convection and the Africa easterly waves (Sylla et al., 2011). The biases in simulated precipitation for the savannah regions and the central African rainforest area mir-ror the temperature biases: warm biases coincide with dry biases in central Africa, and cold biases coincide with wet biases in savannah regions. A comparison of the CanESM2-driven (FB run) and the ERA-Interim-CanESM2-driven (RP run) simu-lations (Fig. 1b3) indicates that the bias in simulated precip-itation has contributions from both the RCM itself and the GCM-generated boundary conditions. Nevertheless, Nikulin et al. (2012) previously showed for Africa that the model is able to capture the Intertropical Convergence Zone (ITCZ) position and the main features of the seasonal mean rain-fall distribution and its annual cycle, and the model biases
in precipitation were of similar magnitude to the differences between observational datasets.
The SST forcing is important for African climate. SSTs used in the study domain present warm biases up to 5◦
Figure 3.Changes in surface temperature and precipitation due to climate change and vegetation feedback. The calculation of climate change signal and vegetation feedbacks as well as present-day and future periods is defined in Sect. 2.2. For(d), the percentage is cal-culated as the difference between FB and NFB (vegetation feed-back) divided by the present-day level and multiplied by 100. Grid points with annual mean precipitation < 20 mm yr−1are skipped.
boundary and around the African coastal regions. In the case of specific humidity, there are dry biases over the continent. These may be traceable to the different convective schemes used in RCA and ERA-Interim, exhibiting different diurnal cycle of precipitation over Africa (Nikulin et al., 2012).
The simulated seasonality of LAI generally reflects the simulated seasonality of precipitation. A systematic overes-timation is apparent for savannahs, as well as a significant underestimation for the central Africa rainforest area. These biases in LAI predominantly reflect the corresponding biases in precipitation (Fig. 2b1–b3 and 2c1–c3). A stronger LAI bias in the savannah is due to the presence of grasses, which are more sensitive to precipitation changes in the model com-pared to trees.
With present-day forcing, the simulated climate and vege-tation patterns and phenology are generally consistent with observations. Some of the biases in the simulated climate are common to many RCMs (Nikulin et al., 2012) and they are apparent for some subregions and seasons in our model. We conclude that the performance is adequate to capture the main details of the African climatology, providing suf-ficient confidence for the subsequent analysis of regional vegetation–climate interactions under future climate change.
3.2 Future climate and vegetation change
In the NFB simulation, most of the African continent is sim-ulated to be 4–6◦
C warmer by the end of the 21st century
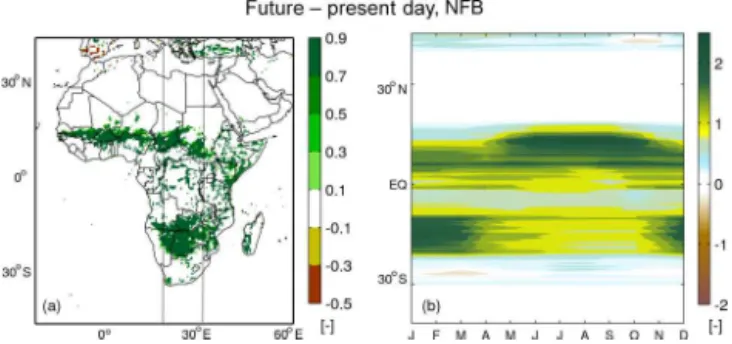
Figure 4.(a)Change in forest fraction and (b)seasonal change in zonal mean forest LAI in the longitude band between 18 and 30◦E (lines in
a), calculated as future minus present day in the FB experiment. Present-day and future periods are defined in Sect. 2.2.
compared with present day (Fig. 3a). The subtropics exhibit a slightly stronger warming than the tropics, and land warm-ing is slightly larger compared to warmwarm-ing of the surround-ing ocean surface as simulated by the CanESM2 GCM and represented in the SST forcing fields prescribed from that model. These changes are fairly similar throughout the year, except in northern Africa and the Sahara, where the tem-perature increase is particularly pronounced in the local dry season (Fig. A3e–h). Precipitation is projected to increase in most parts of the African monsoon area, the western equa-torial coastal area and the eastern part of the Horn of Africa (Fig. A4e–h). A slight decrease is projected in the Congo Basin and for the southern part of the continent (Fig. 3c). For areas with a precipitation increase, the increase is mainly confined to the local wet season. The precipitation decrease over central and southern Africa is apparent throughout the year (Fig. A4e–h).
Vegetation feedbacks (FB run) significantly modify the pattern and magnitude of simulated climate change. The ef-fects are largest in low-latitude areas where the surface tem-perature increase is generally dampened (negative feedback), most notably in savannah areas and to a lesser extent in the equatorial rainforest area (Fig. 3b). The precipitation de-crease is enhanced (positive feedback), most notably over the rainforest area (Fig. 3d).
in the FB run hence originate primarily from CO2 fertiliza-tion.
Temperature feedbacks tend to be strong in areas of increased tree cover (Figs. 3b, 4a). The cooling effects from vegetation feedbacks are strong (approximately−2◦C) throughout the year, with the most pronounced cooling oc-curring in the local dry season (Fig. A3i–l), when the newly established tree (with larger root depth than grass) transpires water that is taken up from the deeper soil layer. Transpira-tion from present-day grass is constrained by the low mois-ture levels in the top soil layer. As a result, the evaporative cooling effect becomes stronger when forest replaces open land. In the central African rainforest area, where an increase in LAI of about 0.5–1 is simulated in the FB run compared with the NFB run, vegetation feedbacks on temperature are much smaller in the rainy season but cause cooling in the dry season.
Vegetation feedbacks on precipitation are also pro-nounced. For the Southern Hemisphere savannah area, a slight increase in precipitation (approximately 10 %, Fig. 3d) was simulated, which is caused by strengthened convective activity (which coincides with enhanced radiation and latent heat fluxes) in the rainy season (DFJ, Fig. A4). This can be considered a local effect of tree LAI increase. However, changes in precipitation are not restricted only to the areas where tree cover increases (Figs. 3d, 4a), which is suggestive of remote effects on tropical precipitation. This is further in-vestigated in the sections below.
3.3 Vegetation feedback effects on circulation and precipitation
Vegetation feedbacks on temperature in our simulations op-erate mainly via an increased surface area for evaporation and a stronger coupling to the atmosphere as tree cover, root depth and LAI increase relative to grasses, most notably in savannah areas, resulting in a shift of the evaporative frac-tion (ratio of latent heat flux to turbulent heat fluxes) and an increase in surface roughness length. Overall, the turbulent heat fluxes increase, which tends to cool the surface and the lower atmosphere, exceeding the opposing (warming) effects of increased vegetation cover on albedo, thus resulting in an overall cooling effect. Similar behaviour was seen in south-ern Europe in a previous study with RCA-GUESS (Wram-neby et al., 2010).
The variability in precipitation over Africa is greatly influ-enced by the moisture advection from the ocean to land. Pre-vious studies have noted the influence of Atlantic Walker cir-culation on central African precipitation, as well as the role of the West African monsoon for precipitation over western Africa (e.g. Nicholson and Grist, 2003; Dezfuli and Nichol-son, 2013; Pokam et al., 2014). These circulation systems are associated with thermal contrasts between ocean and land, creating a pressure contrast that tends to promote the move-ment of moist surface air from the Atlantic over land. We
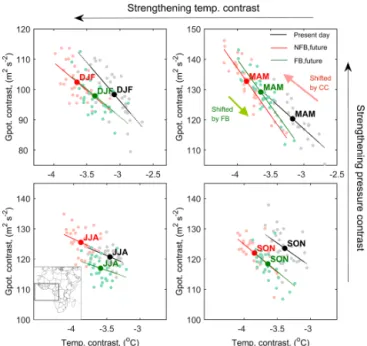
Figure 5.Changes in atmospheric ocean-land temperature contrast (∇T) and geopotential contrast (∇ϕ), represented by the mean con-trast at the three pressure levels 850, 925 and 975 hPa (ocean minus land) within the domain 15◦N–15◦S, 24◦W–20◦E (see the inset in the panel for JJA), for the NFB and FB simulation in the present day and the future period (as defined in Sect. 2.2). Each scatter point represents the relation between∇ϕand∇T for the corresponding season of one year, and the slopes represent its sensitivity during the selected periods.
examined the land–ocean thermal contrast (∇T) and geopo-tential contrast (∇ϕ) between the equatorial Atlantic and the near-coast African continent for three pressure levels be-tween 850 and 975 hPa in order to characterize the circula-tion in the lower troposphere. We found that changes in∇T and∇ϕare highly interannually anti-correlated for the rainy seasons MAM and SON (r= −0.82 and−0.64, respectively, Figs. 5; A6). The sensitivity of∇ϕ to∇T, depicted as the slope in Fig. 5, is generally maintained in the future, with a slight decrease in the sensitivity for DJF and a slight increase for MAM.
Under the NFB future simulation, ocean-land contrast be-comes larger (the absolute value of∇T increases by about 0.5–1◦
Figure 6.Seasonal mean zonal wind speed in a cross section over adjacent the Atlantic Ocean (0–10◦E; see the inset ind), for present day (first row), changes in future (future minus present day, second row) and the differences between FB and NFB runs in future (FB minus NFB, third row). Units are in m s−1; positive values represent westerlies and negative values represent easterlies. Present-day and future periods are defined in Sect. 2.2. Contour intervals from top row to bottom row are 2, 0.4 and 0.2 m s−1, respectively.
trend of ∇ϕ under climate change is associated with the GCM-derived boundary conditions, despite the strong re-gional coupling with∇T in terms of variability (Fig. A6).
In contrast, the increase in the∇T is dampened consider-ably when incorporating interactive vegetation. The resulting reduction in∇T offsets∇ϕ uniformly and statistically sig-nificantly for all seasons, generally counteracting the climate change effect on∇ϕ(Fig. 5, Table A2).
3.4 Effects on Walker circulation and low-latitude precipitation
The low-level equatorial westerlies are important to the cen-tral African rainfall. They are associated with the lower branch of the Walker cell located near the western equato-rial coast of Africa, and they transfer moisture from the ad-jacent Atlantic to the eastern equatorial coast and the Congo Basin (e.g. Nicholson and Grist, 2003; Schefuß et al., 2005; Cook and Vizy, 2015). These westerlies occur from March to October, being best developed in JJA. They shift northward with the excursion of the ITCZ and under the strong influ-ence of the South Atlantic high-pressure cell (Nicholson and Grist, 2003). This pattern is simulated by RCA-GUESS for the present-day climate (Fig. 6). Via this circulation system, moisture can reach far over the African landmass at around 28◦
E, upwell and integrate into the mid-level African east-erly jet (AEJ) (Camberlin et al., 2001; Nicholson and Grist, 2003). RCA-GUESS reproduces this pattern with a realis-tic magnitude (Figs. 6, 7, 8, 9) when compared with
previ-ous studies based on reanalysis data (Camberlin et al., 2001; Nicholson and Grist, 2003).
In the NFB future simulation, equatorial westerlies are strengthened throughout the year over both ocean (Fig. 6) and land (Fig. 7). Changes in wind speed (1u) can be ex-plained by changes in the low-level pressure contrast be-tween land and ocean (Sect. 3.3), where strengthened∇ϕ leads to enhancedu, especially for MAM when the zonal pressure contrast prevails (Table A2). Atmospheric specific humidity in the lower troposphere near the Equator also in-creases by around 10–20 % for MAM and SON, extending from the ocean to inland along the Equator (Figs. 8cd, 9cd). At the same time, changes in future rainfall are apparent along the Equator, with increases over the equatorial coastal or inland areas (Fig. A4), concurrent with stronger moisture inflow to land in the low-level troposphere (Figs. 8cd, 9cd).
Figure 7.Same as Fig. 6 but for the longitudinal band over land (10–30◦E; see the inset ind).
Figure 8. Atmospheric circulation (arrows, m s−1) and specific humidity (colour contours, g kg−1) at 850 hPa pressure level for
MAM, displayed as (a, c, e)for the entire domain, and (b, d, f) as a cross section for a latitude band between 2.5◦S and 2.5◦N, for
present day (top), climate change impacts (middle) and the vegeta-tion feedback (bottom). Definivegeta-tions for calculavegeta-tion period, climate change signal and vegetation feedbacks are given in Sect. 2.2.
Figure 9.Same as Fig. 8 but for SON.
Figure 10. Changes in vertically integrated moisture flux (ar-rows, kg m−1s−1) and moisture flux convergence (colour contours, g m−2s−1) caused by vegetation feedback, averaged over the future
period (as defined in Sect. 2.2) for(a)MAM and(b)SON.
stronger for SON, which also corresponds to reduced humid-ity for these areas (Figs. 8e–f; 9e–f).
The changes in precipitation show a distinct spatial and temporal pattern with changes in the rain belt area (defined as a 2 mm day−1
contour with 10-day smoothing, Fig. 11). Un-der future conditions, the rain belt, which follows the ITCZ excursion, shifts around 3◦
northward during JAS (Fig. 11a). As a result, rainfall intensity increases from May to Octo-ber, with the most pronounced increase by more than 30 % relative to present-day levels of around 2 mm day−1on the margins of the rain belt. The rainy season becomes longer for Sahel (+9 days) as well as for central Africa (+1 day). The location of the rain belt for the rest of the year remains unchanged, but there is a pronounced increase in rainfall in-tensity for the southern African rainy season (about 10 %) and a decrease (about−10 %) for the central African rainy seasons.
On top of the non-feedback climate change effect, vegeta-tion feedbacks tend to cause a slight contracvegeta-tion of the rain belt around the Equator, and they impose a primarily coun-teractive effect on rainfall intensity compared to the climate change alone simulation (NFB). For central Africa, the con-siderable decrease in rainfall intensity in the dry season leads to a slight equatorward shrinking of the rain belt (approxi-mately 2◦
) and a shorter rainy season (on average 10 days, represented as a 4-day postponed onset and a 6-day earlier end). For southern Africa, strengthened convective precipi-tation results in a longer rainy season by on average 6 days. There is no pronounced effect for the Sahel regions except for some sparse changes over time and in some areas. To inves-tigate the effects on ITCZ location, we analysed the position of the intertropical front (ITF) with a meridional wind crite-rion (Sultan and Janicot, 2003) by examining the location of maximum vertical uplifting wind speed at 850 hPa over Sa-hel in July and over southern Africa in January. However, we did not find pronounced effects for ITF (not shown) suggest-ing that changes in the rain belt location for central Africa are mainly caused by changes in precipitation intensity rather than by changes in meridional circulation.
Figure 11.Daily changes in precipitation averaged over the longi-tude band 18–30◦E, represented as relative changes in daily
precip-itation intensity (shading, %) and rain belt location (contour) due to (a)climate change and(b)vegetation feedback for future. The rain belt location is defined as a 2 mm day−1contour. Ten-day running mean is applied for daily values.
4 Discussion
4.1 Related tenets of regional Earth system modelling We investigated the coupled dynamics of climate and veg-etation over Africa under a future climate change scenario, applying a regional-scale ESM that dynamically couples a dynamic representation of vegetation structure, composition and distribution to a physical climate model at a compara-tively high grid resolution. Uniquely among existing studies of climate dynamics for Africa, this enabled us to isolate the regional biophysical feedbacks, which are usually not easy to disentangle in a global application in which the effects of changes in carbon cycle and large-scale circulation tend to compound the biophysical effects.
level pressure, circulation patterns) (Diffenbaugh et al., 2005; Feser, 2006). For example, Kjellström et al. (2005) found that reduced bias in surface air temperature – largely determined by local energy balance – resulted in a better representation of interannual variability in mean sea level pressure and cir-culation patterns and improved the simulation of precipita-tion.
4.2 African vegetation patterns and change
Vegetation dynamics are critically important in modulating the evolution of the 21st century climate in our study. Land use and grazing (Sankaran et al., 2005; Bondeau et al., 2007; Lindeskog et al., 2013), which were not included in our study, represent additional potentially important drivers of land surface changes. The historical vegetation state is also relevant for future simulations, due to legacy effects lasting decades or even centuries (Moncrieff et al., 2014) and their influences on climate–vegetation equilibria (Claussen, 1998; Wang and Eltahir, 2000). While our model exhibited a degree of bias in simulated vegetation under the present climate, the overall distribution of the major vegetation types of the con-tinent (forest, savannah and grassland) was broadly correct. Arguably, vegetation type is a more important determinant of climate–vegetation equilibrium than structural parameters of a given type, such as LAI (Claussen, 1994; Wang and Eltahir, 2000).
Previous experimental (Kgope et al., 2010) and modelling (Sitch et al., 2008; Moncrieff et al., 2014) studies high-light the potential importance of physiological effects of at-mospheric CO2concentrations on the productivity and wa-ter use efficiency of vegetation, particularly in low-latitude and water-limited ecosystem types. Shrub encroachment and woody thickening has been observed in water-limited ar-eas including Sahel in recent decades, coinciding with ris-ing CO2concentrations (e.g. Liu et al., 2015). In our results, the simulated vegetation dynamics are consistent with these trends, presenting a trajectory of increased woody plant dom-inance (not shown), and a similar future vegetation pattern (Fig. 4) as in previous modelling studies (e.g. Sitch et al., 2008; Moncrieff et al., 2014). The vegetation changes sim-ulated by our model under future climate forcing are large compared to the bias noted in the representation of present-day vegetation state. This provides some confidence that the simulated future vegetation is not critically dependent on these biases and, in turn, that the emergent mechanisms of vegetation–climate interaction and their consequences for circulation and precipitation trends suggested by our study are robust.
4.3 Vegetation feedbacks and land–ocean temperature contrasts
The land–ocean contrast is an important driver of continen-tal precipitation, as it determines the transport of moisture
from ocean to land (e.g. Giannini et al., 2003, 2005; Fa-sullo, 2010; Boer, 2011; Lambert et al., 2011). The positive trend in Sahel rainfall over recent decades is a good example of linking moisture transport to land–ocean contrast, where changes in SSTs over adjacent tropical oceans around Africa are key to the fragile balance that defines the regional circula-tion system (Camberlin et al., 2001; Rowell, 2001; Giannini et al., 2003). Land surface feedback is found to modify the interannual to interdecadal climate variability in this region by vegetation-induced albedo or evapotranspiration effects (Zeng et al., 1999; Wang et al., 2004). In our study, the SSTs were prescribed from GCM-generated data; therefore, the al-tered land–ocean thermal contrast between simulations with and without feedback originated solely from the changes in land surface temperature, in turn attributable to vegetation dynamics. Although this represents a land-forced mechanism in contrast to an ocean-forced one inferred in other stud-ies (e.g. Giannini et al., 2003; Tokinaga et al., 2012), the mechanisms are similar. Wind speed and land–ocean tem-perature contrast are reduced by approximately by 0.2 m s−1 and 0.2◦
C, respectively, when vegetation feedbacks are en-abled in our study (Fig. 5 and Table A2); these are compa-rable to the changes simulated in other studies for the Sa-hel (approximately 0.2–0.5 m s−1per 0.2◦
C, Giannini et al., 2005) and for the Pacific Ocean (approximately 0.3 m s−1per 0.3◦
C; Tokinaga et al., 2012). However, the relative impor-tance of such changes may differ for local climate systems: the lower branch of the Walker cell over the eastern tropical Atlantic Ocean, which we have focused on in this study, may be in a fragile balance and is more vulnerable to changes in thermal contrasts (equatorial westerlies slowed down by ap-proximately 0.2 m s−1from less than 2 m s−1of the present-day wind speed in rainy seasons, Table A2) compared to the stronger monsoonal circulation for Sahel and the Walker cell over the equatorial Pacific Ocean (> 5 m per second wind speed in their peak months; Young, 1999). Our results indi-cate that even a small disturbance of the eastern tropical At-lantic circulation cell may produce profound impacts (larger relative reduction in precipitation compared with the studies by Giannini et al., 2005, and Tokinaga et al., 2012).
should be limited. Our study used prescribed SST forcing from a GCM and could thus not account for additional or opposing feedbacks mediated by ocean dynamics. However, as the ocean heat capacity is relatively large and variation in land–ocean thermal contrast can be greatly buffered by ocean heat uptake (Lambert and Chiang, 2007), we suggest that re-sults should not change fundamentally if a dynamic ocean component was introduced to the model.
5 Conclusion and outlook
We investigated the potential role of vegetation-mediated biophysical feedbacks on climate change projections for Africa in the 21st century. In current savannah regions, en-hanced forest growth results in a strong evaporative cooling effect. We also identify alterations in the large-scale circu-lation induced by savannah vegetation change, resulting in remote effects and modulation of tropical rainfall patterns over Africa, favouring savannah ecosystems at the expense of equatorial rainforest. Our results point to the potential impor-tance of vegetation–atmosphere interactions for regional cli-mate dynamics and trends and motivate the incorporation of vegetation dynamics and land–atmosphere biophysical cou-pling in regional models. This has become the standard in global climate modelling but remains rare in regional climate modelling.
pacts on the carbon balance of semi-arid ecosystem like sa-vannahs, known to respond sensitively to variations in rain-fall (Ahlström et al., 2015), may be particularly relevant to address for Africa. The development of regional ESMs to account for the impacts of land use interventions such as afforestation and reforestation, as well as forest clearing, grazing and fire management, may be a valuable next step, enabling land surface–atmosphere interaction studies linked to socioeconomic scenarios and climate change mitigation strategies.
6 Data availability
Appendix A: Description of the coupling between RCA and LPJ-GUESS
In RCA-GUESS, the LSS in RCA is coupled with LPJ-GUESS, which feeds back vegetation properties to RCA. RCA provides net downward shortwave radiation, air tem-perature, precipitation to GUESS. In return, LPJ-GUESS provides daily updated LAI and the annually up-dated tile sizes (determined from the simulated maximum growing season LAI summed across tree and herbaceous PFTs in the previous year; Smith et al., 2011). In the for-est tile in RCA, vegetation cover in this tile is for-estimated as the foliar projective cover (FPC) using Beer’s law:
Atree=1.0−exp (−0.5·LAItree), (A1) where LAItreeis the aggregated LAI of woody species, sim-ulated by LPJ-GUESS in its forest tile in which vegetation is assumed to comprise trees and understorey herbaceous vege-tation. The natural vegetated faction of the open land tile was calculated similarly:
Agrass=1.0−exp(−0.5·LAIgrass), (A2)
where LAIgrass is the summed LAI of the simulated herba-ceous PFTs from the herbaherba-ceous tile of LPJ-GUESS in which only herbaceous vegetation is allowed to grow. The relative covers of the forest and open land tiles affect surface albedo, which is a weighted average of prescribed albedo constants for forest, open land, and bare soil and controls the absorp-tion of surface incoming solar radiaabsorp-tion and therefore influ-ences surface energy balance and temperature.
Table A1.Characteristics of the plant functional types (PFTs) used in the vegetation sub-model LPJ-GUESS.
Characteristics NE BE TrBE TrBR TBS IBS C3G C4G
Leaf phenologya E E E D D D R R
Drought tolerance low low low low low low very low very low
Shade tolerance high high high low high low low Low
Optimal temperature range for photosynthesis (◦C) 10–25 15–35 25–30 25–30 15–25 10–25 10–30 20–45
MinTcfor survival (◦C)b – 1.7 15.5 15.5 −18 – – 15.5
Notes: NE, needleleaved evergreen tree; BE, broadleaved evergreen tree; TrBE, tropical broadleaved evergreen tree; TrBR, tropical broadleaved raingreen tree; TBS, shade-tolerant broadleaved summergreen tree; IBS, shade-intolerant broadleaved summergreen tree; C3G, C3 grass or herb; C4G, C4 grass or herb;
aE, evergreen; D, deciduous; R, raingreen. bTc: mean temperature (◦C) of coldest month of year.
Figure A1.Seasonal sea-surface temperature (◦C) from the observational SST dataset HadISSTv1.1 (first row; Rayner et al., 2003), and the
biases of ERA-Interim (second row) and CanESM2 (third row) against the observed biases for the period 1997–2010.
Figure A2.Seasonal atmospheric circulation (arrows, m s−1) and specific humidity (colour contours, g kg−1) at 850 hPa pressure level from
Figure A3.Simulated seasonal surface temperature for present day(a–d), for changes in future in the NFB experiment (e–h, future minus present day), and for changes from vegetation feedback in future (i–l, FB minus NFB for future). Definitions for calculation period, climate change signal and vegetation feedbacks are given in Sect. 2.2.
Figure A5.Changes in forest tile LAI from the period 1991–2010 to the period 2081–2100 in the FB_CC experiment.
Figure A6.Annual changes in atmospheric ocean-land temperature contrast (∇T) and geopotential contrast (∇ϕ) in time series for four seasons, represented by the mean contrast at the three pressure levels 850, 925 and 975 hPa (ocean minus land) within the domain 15◦N–
Table A2.Atmospheric temperature contrast, geopotential contrast and westerly wind speed for the present-day state and contributions from climate change (CC subscript) and vegetation feedbacks (FB subscript). Standard deviation is in parentheses.
DJF MAM JJA SON
∇Tpresent day(◦C)a −3.06 (0.30) −3.15 (0.34) −3.47 (0.22) −3.37 (0.24)
1∇TCC(◦C)a −0.59∗ −0.73∗ −0.45∗ −0.47∗
1∇TFB(◦C)a 0.29∗ 0.23∗ 0.31∗ 0.22∗
∇ϕpresent day(m2s−2)a 98.14 (5.92) 120.86 (7.03) 120.94 (3.83) 124.08 (4.58)
1∇ϕCC(m2s−2)a 3.94 11.96∗ 4.73∗ −3.32
1∇ϕFB(m2s−2)a −4.93∗ −3.86∗ −8.96∗ −3.92∗
uzonal,present day(m s−1)b 0.01 (0.27) 1.47 (0.32) 0.87 (0.37) 1.22 (0.31)
1uzonal,CC(m s−1)b 0.35∗ 0.32∗ 0.68∗ 0.17∗
1uzonal,FB(m s−1)b −0.00 −0.21∗ −0.28∗ −0.16∗
Note:acalculations are the same as Fig. 5. bu
zonalis the averaged zonal wind speed for the pressure levels 850, 925 and 975 hPa between 3.5 and 6.5◦N and 0 and 10◦E; the positive represents westerly and the negative represents easterly.
References
Ahlström, A., Raupach, M. R., Schurgers, G., Smith, B., Arneth, A., Jung, M., Reichstein, M., Canadell, J. G., Friedlingstein, P., and Jain, A. K.: The dominant role of semi-arid ecosystems in the trend and variability of the land CO2sink, Science, 348, 895–
899, 2015.
Alo, C. A. and Wang, G.: Role of dynamic vegetation in regional climate predictions over western Africa, Clim. Dynam., 35, 907– 922, 2010.
Anav, A., Friedlingstein, P., Kidston, M., Bopp, L., Ciais, P., Cox, P., Jones, C., Jung, M., Myneni, R., and Zhu, Z.: Evaluating the Land and Ocean Components of the Global Carbon Cycle in the CMIP5 Earth System Models, J. Climate, 26, 6801–6843, doi:10.1175/jcli-d-12-00417.1, 2013.
Arora, V., Scinocca, J., Boer, G., Christian, J., Denman, K., Flato, G., Kharin, V., Lee, W., and Merryfield, W.: Carbon emis-sion limits required to satisfy future representative concentra-tion pathways of greenhouse gases, Geophys. Res. Lett., 38, doi:10.1029/2010GL046270, 2011.
Avissar, R. and Werth, D.: Global hydroclimatological teleconnec-tions resulting from tropical deforestation, J. Hydrometeorol., 6, 134–145, 2005.
Berrisford, P., Dee, D., Fielding, K., Fuentes, M., Kallberg, P., Kobayashi, S., and Uppala, S.: The ERA-Interim Archive, ERA Report Series, 1. Technical Report, European Centre for Medium-Range Weather Forecasts, Shinfield Park, Reading, 16 pp., 2009. (Datasets: ERA-Interim (January 1979–present), re-trieved from http://apps.ecmwf.int/datasets/, last access: May 2016)
Boer, G.: The ratio of land to ocean temperature change under global warming, Clim. Dynam., 37, 2253–2270, 2011.
Bonan, G. B.: Forests and climate change: forcings, feedbacks, and the climate benefits of forests, Science, 320, 1444–1449, 2008. Bondeau, A., Smith, P. C., Zaehle, S., Schaphoff, S., Lucht, W.,
Cramer, W., Gerten, D., Lotze-Campen, H., Müller, C., and Re-ichstein, M.: Modelling the role of agriculture for the 20th cen-tury global terrestrial carbon balance, Glob. Change Biol., 13, 679–706, 2007.
Brovkin, V., Claussen, M., Driesschaert, E., Fichefet, T., Kick-lighter, D., Loutre, M.-F., Matthews, H., Ramankutty, N., Scha-effer, M., and Sokolov, A.: Biogeophysical effects of historical land cover changes simulated by six Earth system models of in-termediate complexity, Clim. Dynam., 26, 587–600, 2006. Camberlin, P., Janicot, S., and Poccard, I.: Seasonality and
atmo-spheric dynamics of the teleconnection between African rainfall and tropical sea-surface temperature: Atlantic vs. ENSO, Int. J. Climatol., 21, 973–1005, 2001.
ing the Mid-Holocene: Results of an Interactive Atmosphere-Biome Model, Glob. Ecol. Biogeogr. Lett., 6, 369–377, doi:10.2307/2997337, 1977.
Cook, K. H. and Vizy, E. K.: The Congo Basin Walker circulation: dynamics and connections to precipitation, Clim. Dynam., 1–21, doi:10.1007/s00382-015-2864-y, 2015.
Dezfuli, A. K. and Nicholson, S. E.: The relationship of rainfall variability in western equatorial Africa to the tropical oceans and atmospheric circulation. Part II: The boreal autumn, J. Climate, 26, 66–84, 2013.
Diffenbaugh, N. S., Pal, J. S., Trapp, R. J., and Giorgi, F.: Fine-scale processes regulate the response of extreme events to global climate change, P. Natl. Acad. Sci. USA, 102, 15774–15778, doi:10.1073/pnas.0506042102, 2005.
Döscher, R., Wyser, K., Meier, H. M., Qian, M., and Redler, R.: Quantifying Arctic contributions to climate predictability in a re-gional coupled ocean-ice-atmosphere model, Clim. Dynam., 34, 1157–1176, 2010.
Eklundh, L. and Olsson, L.: Vegetation index trends for the African Sahel 1982–1999, Geophys. Res. Lett., 30, doi:10.1029/2002GL016772, 2003.
Eltahir, E. A.: Role of vegetation in sustaining large-scale atmo-spheric circulations in the tropics, J. GEophys. Res.-All Series, 101, 4255–4268, 1996.
Fasullo, J. T.: Robust Land-Ocean Contrasts in Energy and Water Cycle Feedbacks*, J. Climate, 23, 4677–4693, 2010.
Feser, F.: Enhanced detectability of added value in limited-area model results separated into different spatial scales, Mon. Weather Rev., 134, 2180–2190, 2006.
Giannini, A., Saravanan, R., and Chang, P.: Oceanic forcing of Sa-hel rainfall on interannual to interdecadal time scales, Science, 302, 1027–1030, 2003.
Giannini, A., Saravanan, R., and Chang, P.: Dynamics of the boreal summer African monsoon in the NSIPP1 atmospheric model, Clim. Dynam., 25, 517–535, 2005.
Giorgi, F.: Perspectives for regional earth system modeling, Global Planet. Change, 10, 23–42, 1995.
Giorgi, F., Jones, C., and Asrar, G. R.: Addressing climate informa-tion needs at the regional level: the CORDEX framework, World Meteorological Organization (WMO) Bulletin, 58, 175, 2009. Harris, I., Jones, P. D., Osborn, T. J., and Lister, D. H.:
Herrmann, S. M., Anyamba, A., and Tucker, C. J.: Recent trends in vegetation dynamics in the African Sahel and their re-lationship to climate, Glob. Environ. Change, 15, 394–404, doi:10.1016/j.gloenvcha.2005.08.004, 2005.
Hickler, T., Eklundh, L., Seaquist, J. W., Smith, B., Ardö, J., Olsson, L., Sykes, M. T., and Sjöström, M.: Precipita-tion controls Sahel greening trend, Geophys. Res. Lett., 32, doi:10.1029/2005GL024370, 2005.
Hickler, T., Smith, B., Prentice, I. C., Mjofors, K., Miller, P., Arneth, A., and Sykes, M. T.: CO(2) fertilization in temper-ate FACE experiments not representative of boreal and tropical forests, Glob. Change Biol., 14, 1531–1542, doi:10.1111/j.1365-2486.2008.01598.x, 2008.
Hickler, T., Vohland, K., Feehan, J., Miller, P. A., Smith, B., Costa, L., Giesecke, T., Fronzek, S., Carter, T. R., and Cramer, W.: Pro-jecting the future distribution of European potential natural vege-tation zones with a generalized, tree species-based dynamic veg-etation model, Glob. Ecol. Biogeogr., 21, 50–63, 2012.
Hollander, M. and Wolfe, D. A.: Nonparametric Statistical Meth-ods, 2nd ed., John Wiley & Sons, New York 35–140, 1999. Huffman, G. J., Adler, R. F., Morrissey, M. M., Bolvin, D. T.,
Cur-tis, S., Joyce, R., McGavock, B., and Susskind, J.: Global pre-cipitation at one-degree daily resolution from multisatellite ob-servations, J. Hydrometeorol., 2, 36–50, 2001. (Datasets: GPCP 1-Degree Daily Combination (Version 1.2), retrieved from http: //precip.gsfc.nasa.gov/gpcp_daily_comb.html, last access: May 2016)
Jamali, S., Seaquist, J., Eklundh, L., and Ardö, J.: Automated mapping of vegetation trends with polynomials using NDVI imagery over the Sahel, Remote Sens. Environ., 141, 79–89, doi:10.1016/j.rse.2013.10.019, 2014.
Jones, C., Giorgi, F., and Asrar, G.: The Coordinated Regional Downscaling Experiment: CORDEX – an international down-scaling link to CMIP5, Clivar Exchanges, 16, 34–40, 2011. Joshi, M. M., Gregory, J. M., Webb, M. J., Sexton, D. M., and Johns,
T. C.: Mechanisms for the land/sea warming contrast exhibited by simulations of climate change, Clim. Dynam., 30, 455–465, 2008.
Keenan, T. F., Hollinger, D. Y., Bohrer, G., Dragoni, D., Munger, J. W., Schmid, H. P., and Richardson, A. D.: Increase in forest water-use efficiency as atmospheric carbon dioxide concentra-tions rise, Nature, 499, 324–327, 2013.
Kgope, B. S., Bond, W. J., and Midgley, G. F.: Growth responses of African savanna trees implicate atmospheric [CO2] as a driver of
past and current changes in savanna tree cover, Austral Ecology, 35, 451–463, 2010.
Kjellström, E., Bärring, L., Gollvik, S., Hansson, U., Jones, C., Samuelsson, P., Rummukainen, M., Ullerstig, A., Willén, U., and Wyser, K.: A 140-year simulation of European climate with the new version of the Rossby Centre regional atmospheric cli-mate model (RCA3), Reports Meteorology and Climatology, 108, SMHI, SE-60176 Norrkoping, Sweden, 54 pp., 2005. Kjellström, E., Nikulin, G., Hansson, U., Strandberg, G., and
Uller-stig, A.: 21st century changes in the European climate: uncertain-ties derived from an ensemble of regional climate model simula-tions, Tellus A, 63, 24–40, 2011.
Kucharski, F., Zeng, N., and Kalnay, E.: A further assessment of vegetation feedback on decadal Sahel rainfall variability, Clim. Dynam., 40, 1453–1466, 2013.
Lambert, F. H. and Chiang, J. C.: Control of land-ocean temper-ature contrast by ocean heat uptake, Geophys. Res. Lett., 34, doi:10.1029/2007GL029755, 2007.
Lambert, F. H., Webb, M. J., and Joshi, M. M.: The relationship between land-ocean surface temperature contrast and radiative forcing, J. Climate, 24, 3239–3256, 2011.
LaRow, T. E., Stefanova, L., and Seitz, C.: Dynamical simulations of north Atlantic tropical cyclone activity using observed low-frequency SST oscillation imposed on CMIP5 Model RCP4. 5 SST projections, J. Climate, 27, 8055–8069, 2014.
Lawrence, D. and Vandecar, K.: Effects of tropical deforestation on climate and agriculture, Nature Climate Change, 5, 27–36, 2015. Lindeskog, M., Arneth, A., Bondeau, A., Waha, K., Seaquist, J., Olin, S., and Smith, B.: Implications of accounting for land use in simulations of ecosystem carbon cycling in Africa, Earth Syst. Dynam., 4, 385–407, doi:10.5194/esd-4-385-2013, 2013. Liu, Y. Y., van Dijk, A. I. J. M., de Jeu, R. A. M., Canadell, J.
G., McCabe, M. F., Evans, J. P., and Wang, G.: Recent rever-sal in loss of global terrestrial biomass, Nature Climate Change, 5, 470–474, doi:10.1038/nclimate2581, 2015.
Long, S.: Modification of the response of photosynthetic produc-tivity to rising temperature by atmospheric CO2concentrations:
has its importance been underestimated?, Plant, Cell Environ., 14, 729–739, 1991.
Moncrieff, G. R., Scheiter, S., Bond, W. J., and Higgins, S. I.: In-creasing atmospheric CO2overrides the historical legacy of
mul-tiple stable biome states in Africa, New Phytol., 201, 908–915, 2014.
Morales, P., Hickler, T., Rowell, D. P., Smith, B., and Sykes, M. T.: Changes in European ecosystem productivity and carbon balance driven by regional climate model output, Glob. Change Biol., 13, 108–122, 2007.
Moss, R. H., Edmonds, J. A., Hibbard, K. A., Manning, M. R., Rose, S. K., Van Vuuren, D. P., Carter, T. R., Emori, S., Kainuma, M., and Kram, T.: The next generation of scenarios for climate change research and assessment, Nature, 463, 747–756, 2010. Nicholson, S. E. and Grist, J. P.: The seasonal evolution of the
at-mospheric circulation over West Africa and equatorial Africa, J. Climate, 16, 1013–1030, 2003.
Nikulin, G., Jones, C., Giorgi, F., Asrar, G., Büchner, M., Cerezo-Mota, R., Christensen, O. B., Déqué, M., Fernandez, J., Hänsler, A., van Meijgaard, E., Samuelsson, P., Sylla, M. B., and Sushama, L.: Precipitation Climatology in an Ensemble of CORDEX-Africa Regional Climate Simulations, J. Climate, 25, 6057–6078, doi:10.1175/JCLI-D-11-00375.1, 2012.
Nogherotto, R., Coppola, E., Giorgi, F., and Mariotti, L.: Impact of Congo Basin deforestation on the African monsoon, Atmos. Sci. Lett., 14, 45–51, 2013.
Olsson, L., Eklundh, L., and Ardö, J.: A recent greening of the Sahel – trends, patterns and potential causes, J. Arid Environ., 63, 556– 566, 2005.
Pokam, W. M., Bain, C. L., Chadwick, R. S., Graham, R., Sonwa, D. J., and Kamga, F. M.: Identification of processes driving low-level westerlies in West Equatorial Africa, J. Climate, 27, 4245– 4262, 2014.
doi:10.1002/wcc.8, 2010.
Rummukainen, M.: Added value in regional climate modeling, Wiley Interdisciplinary Reviews: Climate Change, 7, 145–159, doi:10.1002/wcc.378, 2016.
Samuelsson, P., Gollvik, S., and Ullerstig, A.: The land-surface scheme of the Rossby Centre regional atmospheric climate model (RCA3), SMHI, 122, Norrkoping, Sweden, 2006. Samuelsson, P., Jones, C. G., Willén, U., Ullerstig, A., Gollvik, S.,
Hansson, U., Jansson, C., Kjellström, E., Nikulin, G., and Wyser, K.: The Rossby Centre Regional Climate model RCA3: model description and performance, Tellus A, 63, 4–23, 2011. Sankaran, M., Hanan, N. P., Scholes, R. J., Ratnam, J., Augustine,
D. J., Cade, B. S., Gignoux, J., Higgins, S. I., Le Roux, X., and Ludwig, F.: Determinants of woody cover in African savannas, Nature, 438, 846–849, 2005.
Schefuß, E., Schouten, S., and Schneider, R. R.: Climatic controls on central African hydrology during the past 20,000 years, Na-ture, 437, 1003–1006, 2005.
Scheiter, S. and Higgins, S. I.: Impacts of climate change on the vegetation of Africa: an adaptive dynamic vegetation modelling approach, Glob. Change Biol., 15, 2224–2246, 2009.
Sitch, S., Huntingford, C., Gedney, N., Levy, P. E., Lomas, M., Piao, S. L., Betts, R., Ciais, P., Cox, P., Friedlingstein, P., Jones, C. D., Prentice, I. C., and Woodward, F. I.: Evalua-tion of the terrestrial carbon cycle, future plant geography and climate-carbon cycle feedbacks using five Dynamic Global Veg-etation Models (DGVMs), Glob. Change Biol., 14, 2015–2039, doi:10.1111/j.1365-2486.2008.01626.x, 2008.
Smith, B., Prentice, I. C., and Sykes, M. T.: Representation of vegetation dynamics in the modelling of terrestrial ecosystems: comparing two contrasting approaches within European climate space, Glob. Ecol. Biogeogr., 10, 621–637, doi:10.1046/j.1466-822X.2001.t01-1-00256.x, 2001.
Smith, B., Samuelsson, P., Wramneby, A., and Rummukainen, M.: A model of the coupled dynamics of climate, vegetation and terrestrial ecosystem biogeochemistry for regional applications, Tellus A, 63, 87–106, doi:10.1111/j.1600-0870.2010.00477.x, 2011.
Smith, B., Wårlind, D., Arneth, A., Hickler, T., Leadley, P., Silt-berg, J., and Zaehle, S.: Implications of incorporating N cy-cling and N limitations on primary production in an individual-based dynamic vegetation model, Biogeosciences, 11, 2027– 2054, doi:10.5194/bg-11-2027-2014, 2014.
Sörensson, A. A. and Menéndez, C. G.: Summer soil–precipitation coupling in South America, Tellus A, 63, 56–68, 2011.
Sultan, B. and Janicot, S.: The West African monsoon dynamics. Part II: The “preonset” and “onset” of the summer monsoon, J. Climate, 16, 3407–3427, 2003.
485–498, 2012.
Texier, D., De Noblet, N., Harrison, S., Haxeltine, A., Jolly, D., Joussaume, S., Laarif, F., Prentice, I., and Tarasov, P.: Quan-tifying the role of biosphere-atmosphere feedbacks in climate change: coupled model simulations for 6000 years BP and com-parison with palaeodata for northern Eurasia and northern Africa, Clim. Dynam., 13, 865–881, 1997.
Thonicke, K., Venevsky, S., Sitch, S., and Cramer, W.: The role of fire disturbance for global vegetation dynamics: coupling fire into a Dynamic Global Vegetation Model, Glob. Ecol. Biogeogr., 10, 661–677, doi:10.1046/j.1466-822X.2001.00175.x, 2001. Tokinaga, H., Xie, S.-P., Deser, C., Kosaka, Y., and Okumura, Y.
M.: Slowdown of the Walker circulation driven by tropical Indo-Pacific warming, Nature, 491, 439–443, 2012.
Wang, G. and Alo, C. A.: Changes in precipitation seasonality in West Africa predicted by RegCM3 and the impact of dy-namic vegetation feedback, International J. Geophys., 2012, doi:10.1155/2012/597205, 2012.
Wang, G. and Eltahir, E. A.: Biosphere – atmosphere interactions over West Africa. II: Multiple climate equilibria, Q. J. Roy. Me-teorol. Soc., 126, 1261–1280, 2000.
Wang, G., Eltahir, E., Foley, J., Pollard, D., and Levis, S.: Decadal variability of rainfall in the Sahel: results from the coupled GENESIS-IBIS atmosphere-biosphere model, Clim. Dynam., 22, 625–637, 2004.
Wårlind, D., Smith, B., Hickler, T., and Arneth, A.: Nitrogen feed-backs increase future terrestrial ecosystem carbon uptake in an individual-based dynamic vegetation model, Biogeosciences, 11, 6131–6146, doi:10.5194/bg-11-6131-2014, 2014.
Weber, U., Jung, M., Reichstein, M., Beer, C., Braakhekke, M. C., Lehsten, V., Ghent, D., Kaduk, J., Viovy, N., Ciais, P., Gobron, N., and Rödenbeck, C.: The interannual variability of Africa’s ecosystem productivity: a multi-model analysis, Biogeosciences, 6, 285–295, doi:10.5194/bg-6-285-2009, 2009.
Wramneby, A., Smith, B., and Samuelsson, P.: Hot spots of vegetation-climate feedbacks under future green-house forcing in Europe, J. Geophys. Res., 115, D21119, doi:10.1029/2010jd014307, 2010.
Wu, M., Knorr, W., Thonicke, K., Schurgers, G., Camia, A., and Ar-neth, A.: Sensitivity of burned area in Europe to climate change, atmospheric CO2levels and demography: A comparison of two
fire-vegetation models, J. Geophys. Res.-Biogeosci., 120, 2256– 2272, doi:10.1002/2015JG003036, 2015.
Xu, Z., Chang, P., Richter, I., and Tang, G.: Diagnosing southeast tropical Atlantic SST and ocean circulation biases in the CMIP5 ensemble, Clim. Dynam., 43, 3123–3145, 2014.
Yu, M., Wang, G., and Pal, J. S.: Effects of vegetation feedback on future climate change over West Africa, Clim. Dynam., 46, 3669–3688, doi:10.1007/s00382-015-2795-7, 2015.
Zeng, N., Neelin, J. D., Lau, K.-M., and Tucker, C. J.: Enhancement of interdecadal climate variability in the Sahel by vegetation in-teraction, Science, 286, 1537–1540, 1999.
Zhang, W., Jansson, C., Miller, P. A., Smith, B., and Samuelsson, P.: Biogeophysical feedbacks enhance the Arctic terrestrial car-bon sink in regional Earth system dynamics, Biogeosciences, 11, 5503–5519, doi:10.5194/bg-11-5503-2014, 2014.
Zhou, L., Tian, Y., Myneni, R. B., Ciais, P., Saatchi, S., Liu, Y. Y., Piao, S., Chen, H., Vermote, E. F., Song, C., and Hwang, T.: Widespread decline of Congo rainforest greenness in the past decade, Nature, 509, 86–90, doi:10.1038/nature13265, 2014. Zhu, Z., Bi, J., Pan, Y., Ganguly, S., Anav, A., Xu, L., Samanta, A.,