BGD
10, 12967–13013, 2013
Asymmetry and uncertainties in climate-vegetation
feedback
M. Willeit et al.
Title Page
Abstract Introduction
Conclusions References
Tables Figures
◭ ◮
◭ ◮
Back Close
Full Screen / Esc
Printer-friendly Version Interactive Discussion
Discussion
P
a
per
|
D
iscussion
P
a
per
|
Discussion
P
a
per
|
Discuss
ion
P
a
per
|
Biogeosciences Discuss., 10, 12967–13013, 2013 www.biogeosciences-discuss.net/10/12967/2013/ doi:10.5194/bgd-10-12967-2013
© Author(s) 2013. CC Attribution 3.0 License.
Open Access
Biogeosciences
Discussions
Geoscientiic Geoscientiic
Geoscientiic Geoscientiic
This discussion paper is/has been under review for the journal Biogeosciences (BG). Please refer to the corresponding final paper in BG if available.
Asymmetry and uncertainties in
biogeophysical climate–vegetation
feedback over a range of CO
2
forcings
M. Willeit, A. Ganopolski, and G. Feulner
Potsdam Institute for Climate Impact Research, Potsdam, Germany
Received: 17 July 2013 – Accepted: 30 July 2013 – Published: 7 August 2013
Correspondence to: M. Willeit ([email protected])
BGD
10, 12967–13013, 2013
Asymmetry and uncertainties in climate-vegetation
feedback
M. Willeit et al.
Title Page
Abstract Introduction
Conclusions References
Tables Figures
◭ ◮
◭ ◮
Back Close
Full Screen / Esc
Printer-friendly Version Interactive Discussion
Discussion
P
a
per
|
D
iscussion
P
a
per
|
Discussion
P
a
per
|
Discuss
ion
P
a
per
|
Abstract
Climate–vegetation feedback has the potential to significantly contribute to climate change, but little is known about its range of uncertainties. Here, using an Earth sys-tem model of intermediate complexity we address possible uncertainties in the strength of the biogeophysical climate–vegetation feedback using a single-model multi-physics
5
ensemble.
Equilibrium experiments with halving (140 ppm) and doubling (560 ppm) of CO2give a contribution of the vegetation–climate feedback to global temperature change in the range−0.4 to−0.1◦C and−0.1–0.2◦C, respectively. There is an asymmetry between
warming and cooling, with a larger, positive vegetation–climate feedback in the lower
10
CO2climate. Hotspots of climate–vegetation feedback are the boreal zone, the Amazon rainforest and the Sahara. Albedo parameterisation is the dominant source of uncer-tainty in the subtropics and at high northern latitudes, while uncertainties in evapotran-spiration are more relevant in the tropics.
Additionally we find that, even considering the upper range of uncertainties, globally
15
the climate–vegetation feedback is rather small compared to the sum of the fast Char-ney feedbacks. However, it is comparable to the amplitude of the fast feedbacks at high northern latitudes where it can contribute considerably to polar amplification.
Furthermore we analyse the separate impact of changes in stomatal conductance, leaf area index and vegetation dynamics on climate and we find that different processes
20
BGD
10, 12967–13013, 2013
Asymmetry and uncertainties in climate-vegetation
feedback
M. Willeit et al.
Title Page
Abstract Introduction
Conclusions References
Tables Figures
◭ ◮
◭ ◮
Back Close
Full Screen / Esc
Printer-friendly Version Interactive Discussion
Discussion
P
a
per
|
D
iscussion
P
a
per
|
Discussion
P
a
per
|
Discuss
ion
P
a
per
|
1 Introduction
Vegetation distribution is controlled by climate, predominantly by temperature and pre-cipitation (e.g. Holdridge, 1947; Köppen, 1936; Prentice et al., 1992). Vegetation struc-ture is also influenced by the atmospheric CO2concentration, which affects photosyn-thesis and consequently the allocation of carbon to the different biomass pools. This
5
can result in changes in physically relevant characteristics of the vegetation, such as the leaf area index (LAI) (e.g. McCarthy et al., 2007; Norby et al., 2005; Woodward, 1990). Increased CO2concentration has been shown to reduce stomatal conductance and thus lower evapotranspiration (e.g. Medlyn et al., 2001). The opposite effect has been observed for a CO2decrease (e.g. Brodribb et al., 2009).
10
Vegetation in turn influences climate through various physical and biochemical pro-cesses. On one hand changes in vegetation affect the fluxes of sensible and latent heat from the surface to the atmosphere, the amount of shortwave radiation absorbed by the surface, the exchange of momentum between the land surface and the air (e.g. Brovkin et al., 2009; Kleidon et al., 2000). On the other hand vegetation changes are
15
accompanied by changes in the vegetation and soil carbon content, which are associ-ated with changes in surface–air fluxes of CO2 and can alter the concentration of CO2 in the atmosphere (e.g. Arneth et al., 2010; Cox et al., 2000; Friedlingstein et al., 2006; Schimel, 1995). The first kind of processes is referred to as biogeophysical, the sec-ond kind as biogeochemical. As a result of these interactions with climate, vegetation
20
has the potential to amplify or dampen climate change and thus act as a positive or negative feedback on climate. In this study we focus only on the impact of vegetation on the biogeophysical land surface–atmosphere processes and in the following when we refer to climate–vegetation feedback, we mean exclusively the biogeophysical part. The sign and strength of the biogeophysical climate–vegetation feedback is the result
25
BGD
10, 12967–13013, 2013
Asymmetry and uncertainties in climate-vegetation
feedback
M. Willeit et al.
Title Page
Abstract Introduction
Conclusions References
Tables Figures
◭ ◮
◭ ◮
Back Close
Full Screen / Esc
Printer-friendly Version Interactive Discussion
Discussion
P
a
per
|
D
iscussion
P
a
per
|
Discussion
P
a
per
|
Discuss
ion
P
a
per
|
contribution of the single factors and will in general be a function of geographic location and time of the year.
Changes in CO2affect vegetation through its effect on plant physiology. Under higher CO2stomatal conductance is expected to decrease because plants open stomata less widely, thus reducing the water vapour flux from the leaf interior to the surrounding
5
air. This is confirmed both by free air CO2 enrichment experiments and by modelling studies (e.g. Ainsworth and Rogers, 2007; Betts et al., 1997; Medlyn et al., 2001; Sell-ers et al., 1996), which suggest a reduction of stomatal conductance by around 20 % for a doubling of CO2. The pure physiological effect of CO2 on stomatal conductance in models has been shown to cause a decrease in evapotranspiration over land and
10
consequently a global land surface warming of 0.2–0.5◦C (Betts et al., 1997; Boucher et al., 2008; Cao et al., 2010; Sellers et al., 1996). Reduction in stomatal conductance has caused a runoffincrease during the last century (Gedney et al., 2006) and is pro-jected to continue to do so into the future (Betts et al., 2007).
In a higher CO2world, photosynthesis by plants is expected to increase (even without
15
climate change) if water and nutrients are not limiting (e.g. Ainsworth and Rogers, 2007; Owensby et al., 1999). Via this so-called CO2fertilisation effect plants assimilate more carbon and are more productive if atmospheric CO2is higher. This will cause an increase in the LAI, which lowers surface albedo and increases evapotranspiration (e.g. Betts et al., 2000, 1997; Bonan et al., 1992). Higher CO2concentrations promote
water-20
use efficiency of plants as the land biosphere can take up more CO2per unit of water loss. This mechanism would tend to favour forests over grasslands, because more biomass can be produced per unit water used. Nutrients, particularly nitrogen, could be a strong limiting factor for CO2 fertilisation, however (Reich et al., 2006; Vitousek and Howarth, 1991). Betts et al. (1997) showed that structural changes in vegetation,
25
in particular increased LAI, could offset the warming caused by the reduced stomatal conductance.
BGD
10, 12967–13013, 2013
Asymmetry and uncertainties in climate-vegetation
feedback
M. Willeit et al.
Title Page
Abstract Introduction
Conclusions References
Tables Figures
◭ ◮
◭ ◮
Back Close
Full Screen / Esc
Printer-friendly Version Interactive Discussion
Discussion
P
a
per
|
D
iscussion
P
a
per
|
Discussion
P
a
per
|
Discuss
ion
P
a
per
|
high latitudes the extent of forest is limited mainly by temperature. As projected by cli-mate models, temperature will increase in a higher CO2 world with an amplification of the warming in high latitudes. There is a general agreement between models that this temperature increase will allow taiga forest to expand northward and replace part of the tundra (Bala et al., 2006; Falloon et al., 2012; Levis et al., 1999; O’ishi and
5
Abe-Ouchi, 2009; Port et al., 2012). On one hand the shift from tundra to forest signif-icantly decreases surface albedo, especially in the presence of snow, causing surface air temperatures to rise due to the increased amount of absorbed solar radiation. On the other hand the expansion of forests will also increase the evapotranspiration in these regions, resulting in an increase in latent heat flux, which cools the surface
di-10
rectly through evaporative cooling and indirectly through changes in cloud cover. The increase in roughness length will increase both latent and sensible heat fluxes through an increase in the drag coefficient for turbulent fluxes (e.g. Garratt, 1977).
Different models generally agree on a positive vegetation–climate feedback in high northern latitudes where the decrease in albedo dominates over the increase in
evap-15
otranspiration resulting in a net annual warming due to northward forest expansion. Levis et al. (1999) find a land warming north of 45◦N of about 1◦C and 0.5◦C in spring and summer, respectively, while they find a cooling in winter. Falloon et al. (2012) find annual warming larger than 1.5◦C over the same area.
Projected vegetation changes in a warmer climate are more uncertain in lower
lat-20
itudes, where agreement between different models is worse (e.g. Sitch et al., 2008). Several modelling studies showed that the vegetation might be particularly sensitive to climate change in the Sahara and in the Amazon basin. There is evidence from both data and modelling studies that the Sahara was greener than today during the mid-Holocene when summer insolation in the Northern Hemisphere (NH) was higher
25
BGD
10, 12967–13013, 2013
Asymmetry and uncertainties in climate-vegetation
feedback
M. Willeit et al.
Title Page
Abstract Introduction
Conclusions References
Tables Figures
◭ ◮
◭ ◮
Back Close
Full Screen / Esc
Printer-friendly Version Interactive Discussion
Discussion
P
a
per
|
D
iscussion
P
a
per
|
Discussion
P
a
per
|
Discuss
ion
P
a
per
|
monsoon by general circulation models (GCMs) which do not include vegetation dy-namics do not agree on the sign of precipitation anomalies in the Sahel region (Cook and Vizy, 2006). Some early studies with Earth system models (ESMs) pointed to the possibility of a dieback of the Amazon rainforest under global warming scenarios (Betts et al., 2004; Cox et al., 2000). This result is strongly model dependent and other
stud-5
ies simulate a minor or no reduction in Amazon forest cover (Levis et al., 2000; Port et al., 2012).
Unlike the classical Charney feedbacks – water vapour, cloud, lapse rate and albedo – which are considered to be “fast”, vegetation feedback is treated as a slow one and is not included in the calculation of equilibrium climate sensitivity. However, it is
consid-10
ered of importance for the Earth system sensitivity which also invokes “slow” climate feedbacks, such as ice sheet, aerosols, etc. (Hansen et al., 2008). In fact, different as-pects of vegetation response to changing climate and CO2 have different time scales ranging from years to centuries. For instance, the physiological effect of changes in CO2 on stomatal conductance occurs on time scales from years to decades, while
15
changes in the distribution of vegetation cover are an order of magnitude slower. It is known that Charney feedbacks are strongly model dependent (Bony et al., 2006; So-den and Held, 2006; Solomon et al., 2007). It was shown that they can be also strongly climate state dependent (Colman and McAvaney, 2009; Crucifix, 2006; Yoshimori et al., 2011). Less is known about vegetation feedback because until recently only few climate
20
models performed equilibrium simulations with interactive vegetation.
Altogether, significant uncertainties and intermodel variability exist on the amplitude and the sign of the biogeophysical vegetation–climate feedback for a CO2 doubling in current Earth system models (ESMs). Values range from global temperature de-crease by−0.1◦C (Betts et al., 2000) to an increase by 0.1–0.3◦C (Falloon et al., 2012; 25
BGD
10, 12967–13013, 2013
Asymmetry and uncertainties in climate-vegetation
feedback
M. Willeit et al.
Title Page
Abstract Introduction
Conclusions References
Tables Figures
◭ ◮
◭ ◮
Back Close
Full Screen / Esc
Printer-friendly Version Interactive Discussion
Discussion
P
a
per
|
D
iscussion
P
a
per
|
Discussion
P
a
per
|
Discuss
ion
P
a
per
|
continental scales and for improving the understanding of the biosphere–climate inter-actions.
Here we use a multi-physics ensemble approach (Watanabe et al., 2012) in a sin-gle model framework to estimate the uncertainty range in the biogeophysical climate– vegetation feedback at global and continental scales. Unlike the standard approach to
5
generate a perturbed physics single-model ensemble, we account not only for param-eter uncertainties but also for structural uncertainties, such as the choice of sub-grid snow cover fraction, snow masking by vegetation, albedo and evapotranspiration, in-cluding stomatal and surface resistances. We benefit from the use of an Earth system model of intermediate complexity (EMIC) which is highly computationally efficient and
10
allows for a systematic analysis of the impact of changes in model structure on the bio-geophysical climate–vegetation feedback. In this study we use a single and simplified vegetation model and we do not address the uncertainties that could arise from the use of different and possibly more comprehensive dynamic global vegetation models (DGVMs). The spread in modelled changes in vegetation distribution for future climate
15
projections as returned by current DGVMs has been studied elsewhere (Sitch et al., 2008; Cramer et al., 2001).
2 Methodology
2.1 Model
For our analysis we use the Earth system model of intermediate complexity
CLIMBER-20
2 (Ganopolski et al., 2001; Petoukhov et al., 2000). CLIMBER-2 includes a 2.5-dimensional dynamical-statistical atmosphere and a multi-basin, zonally averaged ocean model including sea ice. It also includes VECODE, a dynamic model of the terrestrial biosphere (Brovkin et al., 1997, 2002). VECODE distinguishes three surface cover types: forest, grassland and desert. The vegetation distribution is determined
25
BGD
10, 12967–13013, 2013
Asymmetry and uncertainties in climate-vegetation
feedback
M. Willeit et al.
Title Page
Abstract Introduction
Conclusions References
Tables Figures
◭ ◮
◭ ◮
Back Close
Full Screen / Esc
Printer-friendly Version Interactive Discussion
Discussion
P
a
per
|
D
iscussion
P
a
per
|
Discussion
P
a
per
|
Discuss
ion
P
a
per
|
dynamic global vegetation models for present day climate (Cramer et al., 2001). The CO2fertilisation effect on net primary productivity (NPP) is explicitly considered in the model and thus CO2 directly affects the LAI. NPP is increased by 25 % for a CO2 doubling and decreased by 25 % for a halving of CO2. However, unlike more complex DGVMs, NPP in VECODE does not directly affect fractions of plant functional types
5
(trees, grass). This is a weakness of our model which has implications described be-low. The marine carbon cycle components are not used in this study. Atmospheric CO2 is prescribed in all experiments and the potential atmospheric CO2 changes due to changes in the land surface carbon pools are not considered.
2.2 Multi-physics ensemble
10
Single-model ensembles with perturbed physics are routinely used in climate mod-elling. However, it is generally believed that single model ensembles may considerably underestimate the range of uncertainties compared to multi-model ensembles due to lack of structural uncertainties (Yokohata et al., 2013). Here we made an attempt to overcome this deficiency of single-model ensemble by changing systematically not only
15
model parameters but also the structure of parameterisations of the relevant biogeo-physical processes in a single model framework. We consider structural uncertainties in sub-grid snow cover fraction, snow masking by vegetation, albedo and evapotranspira-tion, including stomatal and surface conductance. For all these processes we included several approaches found in the literature in CLIMBER-2.
20
2.2.1 Albedo
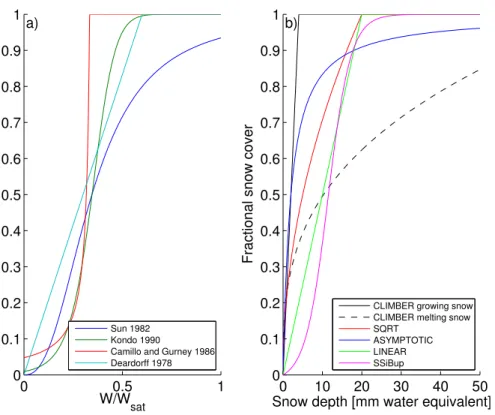
To account for sub-grid heterogeneities, in most GCMs sub-grid snow cover fraction is parameterised as a function of grid-cell mean snow height or snow mass (Liston and Elder, 2004). The relationship used between the grid-cell mean quantities and the snow cover fraction has a considerable impact on the modelled albedo of snow-covered
25
BGD
10, 12967–13013, 2013
Asymmetry and uncertainties in climate-vegetation
feedback
M. Willeit et al.
Title Page
Abstract Introduction
Conclusions References
Tables Figures
◭ ◮
◭ ◮
Back Close
Full Screen / Esc
Printer-friendly Version Interactive Discussion
Discussion
P
a
per
|
D
iscussion
P
a
per
|
Discussion
P
a
per
|
Discuss
ion
P
a
per
|
and Table 1). We prescribed bare soil albedo as being either a constant global value or prescribed from present day observations. In both cases we also introduced a soil wetness dependence, following BATS (Dickinson et al., 1993).
Forests are very efficient in masking snow. In the presence of snow, surface albedo is significantly lower over forests than over grasslands. Indicative values of albedo for
5
snow covered forests estimated from satellite data are around 0.2–0.3, while for grass-lands and surfaces with short vegetation the albedo can be as high as 0.5–0.6 (Barlage et al., 2005; Bonan, 2008; Jin et al., 2002; Moody et al., 2007). In situ measurements show an even higher difference, with albedos as low as 0.13 for forests and higher than 0.7 for grasslands (e.g. Betts and Ball, 1997). Several different approaches are used
10
in state-of-the-art ESMs to parameterise snow masking by vegetation, which are gen-erally related to the surface albedo scheme used. We included two albedo schemes in CLIMBER-2. The first one is based on BATS (Dickinson et al., 1993) and computes the albedo as a weighted mean of snow-covered and snow-free vegetation albedo. The fraction covered by snow is a function of the roughness length and varies with surface
15
types. The second, more complex albedo parameterisation, is based on the JSBACH scheme used in Otto et al. (2011). It uses the leaf and stem area index (LSAI) to de-termine the fraction of vegetated area which is assigned sub-canopy soil or vegetation (PFT specific) albedo. A value of 0.11–0.3 is assigned to the albedo of snow covered canopy. Additionally, for clear sky albedo, we augmented the LSAI parameterisation
20
with a solar zenith angle dependence following Hellström (2000). The fraction of soil viewing the sky is not only a function of the stem area and the canopy density but also of the elevation of the sun above the horizon.
2.2.2 Evapotranspiration
In our ensemble we included also ensemble members with different representations
25
BGD
10, 12967–13013, 2013
Asymmetry and uncertainties in climate-vegetation
feedback
M. Willeit et al.
Title Page
Abstract Introduction
Conclusions References
Tables Figures
◭ ◮
◭ ◮
Back Close
Full Screen / Esc
Printer-friendly Version Interactive Discussion
Discussion
P
a
per
|
D
iscussion
P
a
per
|
Discussion
P
a
per
|
Discuss
ion
P
a
per
|
difference of mean humidity at two levels in the constant-flux layer through the universal stability functions. The Penman–Monteith equation (Monteith, 1965; Penman, 1948) can be regarded as a physics-based combination of the available energy (Priestley and Taylor, 1972) and aerodynamic (Monin–Obukhov) approaches. The Penman–Monteith and the aerodynamic formulations are most frequently used in ESMs (Pitman et al.,
5
1999).
In both approaches, the vegetation controls the exchange of water between the sur-face and the atmosphere through the resistance exerted by leaf stomata on the diff u-sion of water from inside the leaf to the atmosphere. Stomatal resistance is tightly cou-pled to the process of carbon assimilation through photosynthesis and in some ESMs
10
it is modelled by the photosynthesis module. Alternative formulations of the stomatal resistance are based on empirical formulations, where stomatal resistance generally depends on environmental factors such as radiation, temperature, humidity and on soil moisture availability. Since CLIMBER-2 does not model photosynthesis explicitly we included several empirical formulations of the stomatal resistance in the model
follow-15
ing (Dickinson et al., 1993; Stewart, 1988). Stomatal resistance is also dependent on the CO2 concentration in the atmosphere, as with higher CO2 levels stomata need to open less to get the same amount of CO2 into the leaf interior. CO2 enrichment experiments have shown a decrease in stomatal conductance (inverse of stomatal re-sistance) for a doubling of environmental CO2 concentration (Ainsworth and Rogers,
20
2007; Medlyn et al., 2001). Although they found that the amplitude of the decrease in stomatal conductance varies largely between different species and with many other factors, they observed a mean long term (after more than 1 yr of exposure of the plants to doubled CO2) decrease of about 20 %. In the model we introduced a range from 15– 40 % for the decrease in stomatal conductance for a CO2doubling, which is consistent
25
BGD
10, 12967–13013, 2013
Asymmetry and uncertainties in climate-vegetation
feedback
M. Willeit et al.
Title Page
Abstract Introduction
Conclusions References
Tables Figures
◭ ◮
◭ ◮
Back Close
Full Screen / Esc
Printer-friendly Version Interactive Discussion
Discussion
P
a
per
|
D
iscussion
P
a
per
|
Discussion
P
a
per
|
Discuss
ion
P
a
per
|
Over bare soils, where vegetation is not present, evaporation is largely controlled by water availability in the top soil layer. This limiting factor is accounted for through the introduction of a surface resistance. Four different parameterisations of the surface resistance were implemented into the model based on the work by Mahfouf and Noilhan (1991). Figure 1a shows the quantity β= Raer
Raer+Rsoil as a function of the relative soil
5
moisture in the top soil layer.Rsoilis the surface resistance andRaeris the aerodynamic resistance to the transfer of water from the surface to a reference height, assumed to be 50 s m−1.
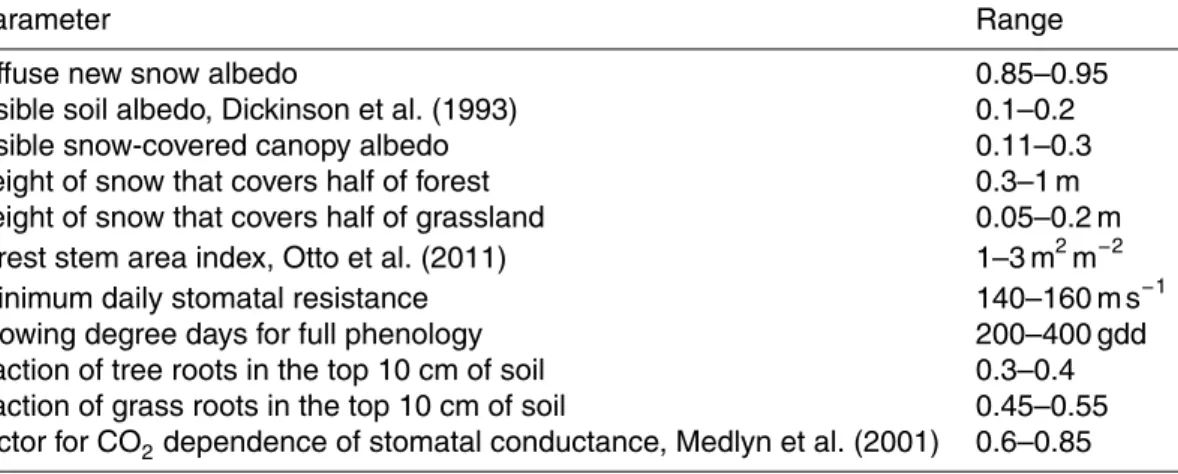
A more detailed description of the parameterisations used for the different processes is shown in Table 1. Additionally to structural uncertainties we also explored the
uncer-10
tainty due to parameters which are not well constrained by observations. A description of these parameters is listed in Table 2. Three values are sampled for each parameter, two at the borders and one in the middle of the range indicated in Table 2. Where no reference is added, the parameter range is estimated by expert knowledge.
To construct the ensemble we first created all possible permutations of parameters
15
and parameterisations, which resulted in a large number of combinations. To reduce the number of ensemble members to a computationally manageable size, we randomly selected 250 sets of parameters and parameterisations. Then we run the 250 ensem-ble members to equilibrium for 6000 yr with present day boundary conditions. Finally we applied climatological constraints to exclude ensemble members which were not
20
compatible with present day observations in terms of global annual temperature and precipitation. Additionally, we excluded ensemble members which were not compatible with observations of the albedo of snow covered forest and grassland and global land evapotranspiration (Fig. 2). This is essential, because these are two of the fundamental quantities determining the strength of the climate–vegetation feedback. 145 ensemble
25
BGD
10, 12967–13013, 2013
Asymmetry and uncertainties in climate-vegetation
feedback
M. Willeit et al.
Title Page
Abstract Introduction
Conclusions References
Tables Figures
◭ ◮
◭ ◮
Back Close
Full Screen / Esc
Printer-friendly Version Interactive Discussion
Discussion
P
a
per
|
D
iscussion
P
a
per
|
Discussion
P
a
per
|
Discuss
ion
P
a
per
|
2.3 Forcings
We chose atmospheric CO2concentration as the external forcing on the Earth system as it likely is the most relevant radiative forcing for future climate. To cover the range of potential CO2 concentrations from the recent past to the near future we performed experiments with 140 ppm and 560 ppm,12×and 2×the preindustrial value (280 ppm), 5
respectively. The choice of progressive CO2 doubling is made because the radiative forcing of CO2 is approximately logarithmic in its concentration. This setup allows a direct comparison between the feedback strength over the range of forcings.
2.4 Climate–vegetation feedback factor
A traditional way to quantify the interaction between vegetation and climate is to look
10
at the feedback factor, similarly to what is traditionally done for the Charney feedbacks. The equilibrium surface temperature change due to changing CO2concentrations can be expressed as (Hansen and Takahashi, 1984):
∆Ts= λ0
1−λ0
P
FjRF, (1)
where RF is the radiative forcing due to CO2 concentration change, λ0 is the Stefan–
15
Boltzmann response:
λ0=− ∂R
TOA
∂Ts −1
(2)
andFj are the feedback factors:
Fj=∂RTOA ∂Vj
∂Vj
BGD
10, 12967–13013, 2013
Asymmetry and uncertainties in climate-vegetation
feedback
M. Willeit et al.
Title Page
Abstract Introduction
Conclusions References
Tables Figures
◭ ◮
◭ ◮
Back Close
Full Screen / Esc
Printer-friendly Version Interactive Discussion
Discussion
P
a
per
|
D
iscussion
P
a
per
|
Discussion
P
a
per
|
Discuss
ion
P
a
per
|
whereRTOAis the radiative balance at the top of the atmosphere (TOA),V is a vector of the internal climate variables which depend on temperature and affect the radiative balance at TOA through either or both short-wave (SW) and long-wave (LW) radiation. Additionally to the standard fast feedbacks (i.e. water vapour, cloud, albedo, lapse rate) here we also include vegetation, which will affect RTOA trough the different albedo of
5
diverse vegetation types and changes in water vapour and clouds caused by changes in evapotranspiration. What we call here “albedo feedback” is the standard Charney feedback which does not include albedo changes due to shifts in vegetation zones.
Different methods have been applied in the past to quantify the feedbacks Fj of a given climate model (Cess et al., 1990; Soden et al., 2004; Wetherald and Manabe,
10
1988). Here we apply the offline TOA radiation method, which has been pioneered by Wetherald and Manabe (1988). It is based on the direct calculation of the radiative per-turbation at TOA resulting from a substitution of one climate variableVj from perturbed
experiments at a time in the control runs, keeping all the other variables fixed. This quantity, normalized by the change in global mean temperature, can then be taken as
15
a direct measure of the feedback strength of the variable Vj. Vegetation affects the
radiative balance at the TOA directly through changes in surface albedo and indirectly through changes in evapotranspiration which affect the amount of water vapour and cloud cover.
It should be stressed here that compared to the fast feedbacks, vegetation changes
20
occur on time scales of decades to centuries. Since in this study we focus on equilib-rium conditions rather than transient behaviour of the climate system, the equal treat-ment of vegetation and Charney feedbacks is justified.
2.5 Experiments
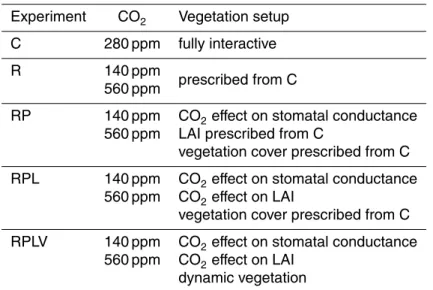
With the described modelling setup we performed different equilibrium experiments:
25
BGD
10, 12967–13013, 2013
Asymmetry and uncertainties in climate-vegetation
feedback
M. Willeit et al.
Title Page
Abstract Introduction
Conclusions References
Tables Figures
◭ ◮
◭ ◮
Back Close
Full Screen / Esc
Printer-friendly Version Interactive Discussion
Discussion
P
a
per
|
D
iscussion
P
a
per
|
Discussion
P
a
per
|
Discuss
ion
P
a
per
|
from the control; (c) RP: experiments different from R by including the physiological effect of CO2on stomatal conductance but not changing LAI and vegetation cover; (d) RPL: same as RP but including also the effect of CO2fertilization on LAI, and (e) RPLV: the same as RPL but allowing vegetation cover to adjust to the changed climatic condi-tions. This setup allows to disentangle the impact of the different vegetation processes
5
on climate. The experiments are outlined in Table 3. All experiments were run to equi-librium for 6000 model years using preindustrial climate state as initial condition. The mean variables over the last 1000 yr of simulation are used in the analysis.
Additionally, to determine the strength of the climate–vegetation feedback in terms of the instantaneous radiative imbalance at the TOA, we run the control simulations
10
again, substititing vegetation from the control run with vegetation simulated in RPLV experiments and computing the radiative imbalance at TOA. With the same proce-dure, but from R experiments, we also determined the strength of the traditional fast (Charney) feedbacks: water vapour, clouds, lapse rate and albedo (without changes in vegetation).
15
3 Results and discussion
3.1 Experiments with fixed vegetation: R–C
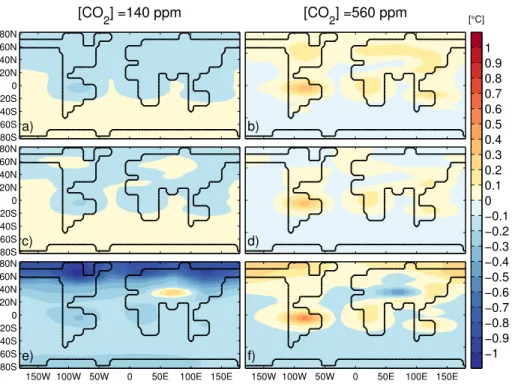
Figure 3 illustrates modelled climate changes relative to preindustrial under different atmospheric CO2 with prescribed vegetation from the control runs. The global mean temperature changes are (5–95 percentile range)∆T1
2×=−3.3 to−3.1
◦C,
∆T2×=2.9–
20
3.0◦C for halving and doubling of CO
2, respectively, which is close to equilibrium cli-mate sensitivity of the standard CLIMBER-2 model version. The fact that the values ∆T1
2× and ∆T2× are not equal points to the existence of weak non-linearities in the
climate feedbacks in the model. The temperature anomalies are amplified in high lati-tudes (Fig. 3a and b).
BGD
10, 12967–13013, 2013
Asymmetry and uncertainties in climate-vegetation
feedback
M. Willeit et al.
Title Page
Abstract Introduction
Conclusions References
Tables Figures
◭ ◮
◭ ◮
Back Close
Full Screen / Esc
Printer-friendly Version Interactive Discussion
Discussion
P
a
per
|
D
iscussion
P
a
per
|
Discussion
P
a
per
|
Discuss
ion
P
a
per
|
Analogously, for global precipitation,∆P1
2×=−0.29 to−0.27 mm day
−1 and
∆P2×=
0.28–0.30 mm day−1. Precipitation changes relative to preindustrial are located mainly in the tropics (Fig. 4a and b).
3.2 The effect of interactive vegetation
In the following we discuss the effects of vegetation on climate by adding new
pro-5
cesses step-by-step. All results refer to differences from the radiative only (R) exper-iment. We start from the physiological effect of CO2 on stomatal conductance, then we add the CO2fertilisation effect on LAI and finally we include the impact of dynamic vegetation and discuss the total combined effect of vegetation on climate.
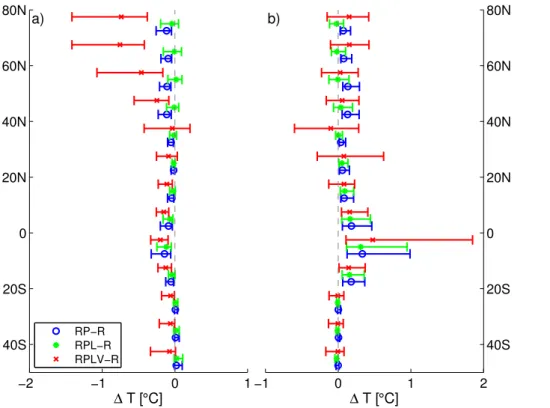
3.2.1 CO2physiological effect: RP–R 10
We find that the (prescribed) reduction in stomatal conductance by 15–40 % due to the pure physiological effect of CO2 doubling causes a warming of 0.1–0.3◦C over land (Fig. 6a). This is consistent with previous modelling results (Betts et al., 1997; Cao et al., 2010; Sellers et al., 1996), although it is close to the lower range of values from these studies. Evapotranspiration over land is reduced by −0.04 to −0.3 mm day−1 15
(Fig. 6d), which is higher than was found in most previous studies (e.g. Cao et al., 2010). As a consequence the hydrological cycle is weakened and precipitation over land is reduced by about 0.1 mm day−1. Warming is particularly significant were evap-otranspiration is important, such as in the tropics and in NH mid-latitudes with values higher than 0.5◦C in the Amazon region (Fig. 7b). All ensemble members consistently
20
show a warming in the tropics and the NH (Fig. 8b).
BGD
10, 12967–13013, 2013
Asymmetry and uncertainties in climate-vegetation
feedback
M. Willeit et al.
Title Page
Abstract Introduction
Conclusions References
Tables Figures
◭ ◮
◭ ◮
Back Close
Full Screen / Esc
Printer-friendly Version Interactive Discussion
Discussion
P
a
per
|
D
iscussion
P
a
per
|
Discussion
P
a
per
|
Discuss
ion
P
a
per
|
3.2.2 CO2fertilisation on LAI: RPL–R
As a response to enhanced CO2the LAI increases everywhere, predominantly at mid-latitudes where a zonal mean increase in growing season peak LAI of up to 1 m2m−2is modelled (Fig. 5c). Higher LAI partially offsets the warming caused by closing stomata enhancing evapotranspiration and thus cooling the surface, particularly over NH land
5
(Figs. 6a and 7d). This is in qualitative agreement with the results of (Betts et al., 1997), although they found a stronger cooling effect of increased LAI. The difference can at least partly be explained by the much larger increase in LAI in their model, also because they implicitly included changes in LAI from shifts in vegetation cover. Global land precipitation and evapotranspiration are only slightly reduced (Fig. 6b and d). The
10
impact of increased LAI on surface albedo plays only a secondary role.
In the 140 ppm experiments, the LAI decreases by more than 1 m2m−2 in mid-latitudes. This causes a warming which almost completely offsets the small cooling caused by higher stomatal conductance (Figs. 6a, 7c and 8a).
3.2.3 Dynamic vegetation: RPLV–R
15
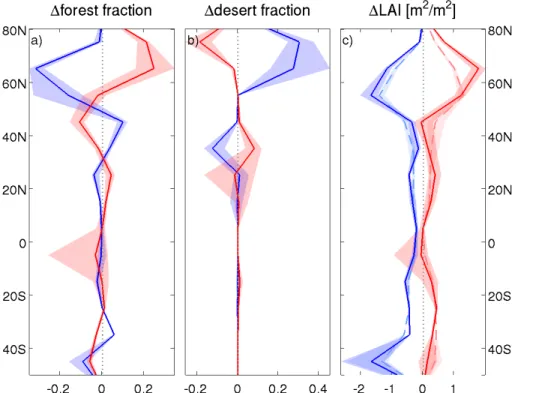
Modelled vegetation distribution changes substantially as a response to changing cli-matic conditions in both higher and lower CO2 worlds. Anomalies of vegetation cover with respect to preindustrial are shown in Fig. 5. In the warmer climate simulations with 560 ppm of CO2forest cover increases significantly in high northern latitudes and decreases in mid-latitudes. The modelled response to a colder climate (140 ppm) is
op-20
posite, but not fully symmetric to warming. Simulated changes in forest fractions in the high latitudes correspond to a northward (southward) tree line migration by≈300 km
for 2×CO2(12×CO2). The change in tropical forest is strongly dependent on the model structure, with the main contribution to uncertainties coming from the equatorial South America. The parameterisation of stomatal conductance is the dominant factor
explain-25
BGD
10, 12967–13013, 2013
Asymmetry and uncertainties in climate-vegetation
feedback
M. Willeit et al.
Title Page
Abstract Introduction
Conclusions References
Tables Figures
◭ ◮
◭ ◮
Back Close
Full Screen / Esc
Printer-friendly Version Interactive Discussion
Discussion
P
a
per
|
D
iscussion
P
a
per
|
Discussion
P
a
per
|
Discuss
ion
P
a
per
|
are approximately symmetric to those for warmer climates, except for the tropics, where no significant changes are modelled.
Desert changes are substantial in high northern latitudes where the desert fraction increases with increasing CO2concentrations. Moreover, desert anomalies are signif-icant in the NH subtropics, where desert expands in warmer climates and retracts in
5
colder climates (Fig. 5b). The “greening” of the Sahara is the most uncertain aspect. Here the parameterisation of soil albedo gives the main contribution to the uncertainty range.
Grass cover changes are complementary to the desert and forest changes.
Forest expansion in high northern latitudes for higher CO2concentrations is
consis-10
tent with previous modelling results (Notaro et al., 2007; O’ishi and Abe-Ouchi, 2009; Port et al., 2012; Lucht et al., 2006). The greening of the Sahara in projections of fu-ture climate with higher CO2 levels is a feature common to many models. In transient simulations with the RCP8.5 scenario, Port et al. (2012) found an initial decrease in the desert fraction over the Sahel/Sahara region, followed by an increase around the end
15
of the 21st century. O’ishi and Abe-Ouchi (2009) found an expansion of vegetation in the Sahel/Sahara region for doubling and quadrupling of CO2.
Amazon forest dieback under global warming is a feature of some models (Betts et al., 2004; Cox et al., 2000; Huntingford et al., 2008). Other models simulate a more modest reduction in forest cover (Port et al., 2012). O’ishi and Abe-Ouchi (2009) found
20
no significant change in the Amazon forest in a 2×CO2 climate. This broad range of model behaviours is well represented in our ensemble.
In the fully interactive vegetation runs, changes in LAI are the result of the combined effects of CO2 fertilisation and response of vegetation distribution to climate change. As a result of CO2 fertilisation, LAI is generally increased in the 2×CO2experiments.
25
BGD
10, 12967–13013, 2013
Asymmetry and uncertainties in climate-vegetation
feedback
M. Willeit et al.
Title Page
Abstract Introduction
Conclusions References
Tables Figures
◭ ◮
◭ ◮
Back Close
Full Screen / Esc
Printer-friendly Version Interactive Discussion
Discussion
P
a
per
|
D
iscussion
P
a
per
|
Discussion
P
a
per
|
Discuss
ion
P
a
per
|
70◦N due to a southward retreat of forest and an increase between 30–40◦N due to an expansion of forest.
The changes in vegetation cover have a non-negligible impact on climate. Vegetation dynamics acts as a positive feedback on climate in most ensemble members. It both amplifies the warming in 2×CO2and the cooling in 12×CO2experiments. With a CO2
5
of 140 ppm vegetation dynamics is the main contributor to the total cooling caused by vegetation, while for CO2 doubling the contribution is only minor (Fig. 6a). Dynamic vegetation is very important in high latitudes in the CO2 halving simulations, where it causes significant additional cooling, up to 1◦C in the zonal annual mean (Figs. 7e and 8a). Additionally it causes warming (cooling) over central Asia in the 140 ppm
10
(560 ppm) experiments due to a reduction (increase) in desert area (Fig. 7e and f). For both 12×CO2 and 2×CO2, vegetation dynamics enhances the uncertainty range everywhere (Figs. 6a and 8a and b), because the way the biogeophysical processes are parameterised influences the shifts in vegetation cover. When considering this find-ing one should keep in mind that the bioclimatic scheme of VECODE does not take into
15
account increase of water use efficiency under high CO2 which can compensate the effect of reduced precipitation on forest cover. The expansion of forest might thus be underestimated in 2×CO2experiments.
The global land temperature differences between the simulations with interactive vegetation and those with prescribed preindustrial vegetation are (5–95 percentile
20
range):∆Tveg1 2×
=−0.4 to−0.1◦C and∆T2veg
× =−0.1–0.3
◦C (Fig. 6a). These values
rep-resent the effect of fully interactive vegetation on climate.
Figure 9 shows the seasonal surface air temperature change due to vegetation changes for the experiments with doubling and halving of the preindustrial CO2 con-centration. In the 140 ppm case, vegetation has the biggest impact on temperature in
25
BGD
10, 12967–13013, 2013
Asymmetry and uncertainties in climate-vegetation
feedback
M. Willeit et al.
Title Page
Abstract Introduction
Conclusions References
Tables Figures
◭ ◮
◭ ◮
Back Close
Full Screen / Esc
Printer-friendly Version Interactive Discussion
Discussion
P
a
per
|
D
iscussion
P
a
per
|
Discussion
P
a
per
|
Discuss
ion
P
a
per
|
For doubling of CO2, vegetation causes significant warming of about 1◦C over the tropics throughout the year (Fig. 8b). This is a consequence of the reduced evapo-transpiration due to the reduced stomatal conductance, combined with a reduction in forest over the Amazon in some ensemble members. North of 40◦N, warming of up to 1◦C is modelled during spring and summer and cooling, around
−0.5◦C, during 5
winter. At 20◦N a warming is found because of Sahara “greening” and at 30◦N a cool-ing because of larger desert fraction in central Asia. Major uncertainties, higher than 100 %, are found around 5◦S, mainly because of the Amazon, and between 20–30◦N because of the uncertain “greening” of the Sahara and expansion of desert in central Asia. Significant uncertainties are found also north of 60◦N in spring (Fig. 9d).
10
The changes in surface air temperature due to vegetation changes are the result of the combined effect of variations in several biogeophysical processes controlling the surface energy balance. Albedo and evapotranspiration changes are the two dominant effects. A transition from grass to forest, or an increase in LAI, increases the short-wave radiation absorbed by the surface through a lowering of the surface albedo. This
15
effect will be particularly strong when snow is present, because of the strong snow masking effect of forests. On the other hand more water is evaporated and transpired from forests as compared to grass. This will increase the latent heat flux and thus cool the surface. Changes in evapotranspiration also affect atmospheric water content and cloudiness that also affect surface air temperature. The relative contribution of albedo
20
and evapotranspiration to surface temperature change varies as a function of latitude and season. To quantify when and where which of the two effects dominates we com-puted for each latitude and each month the correlation between the zonal mean near surface air temperature and both evapotranspiration and albedo in the ensemble. We first excluded insignificant and unphysical (negative) correlations and then chose the
25
highest between temperature–evapotranspiration and temperature–albedo correlations for each latitude and month of the year. We changed sign to the correlation coefficient of temperature with albedo and sum the two fields to obtain a metric between−1 and 1,
corre-BGD
10, 12967–13013, 2013
Asymmetry and uncertainties in climate-vegetation
feedback
M. Willeit et al.
Title Page
Abstract Introduction
Conclusions References
Tables Figures
◭ ◮
◭ ◮
Back Close
Full Screen / Esc
Printer-friendly Version Interactive Discussion
Discussion
P
a
per
|
D
iscussion
P
a
per
|
Discussion
P
a
per
|
Discuss
ion
P
a
per
|
lation of temperature with evapotranspiration. The result shows that evapotranspiration has the dominant effect on temperature in the tropics and albedo is more important in the subtropics for both halving and doubling of CO2 (Fig. 10). In the 140 ppm exper-iments albedo dominates throughout the year also north of 50◦N. For CO
2 doubling, north of 40◦N the albedo is more important in spring and winter, but evapotranspiration
5
dominates in summer. This helps interpreting the seasonal temperature variations in Fig. 9.
3.3 Climate–vegetation feedback factor
The feedback factor approach allows to directly compare the vegetation feedback with the Charney feedbacks. The global feedback factors for the experiments with different
10
CO2concentrations are shown in Fig. 11. The fast feedbacks for doubling of CO2can be compared with the results from GCMs (Soden and Held, 2006). Compared to Soden and Held (2006), our model underestimates the water vapour feedback while the lapse rate feedback lies in the upper range from GCMs estimates. But the sum of these two feedback is within the GCM range. Albedo and cloud feedbacks are fully consistent
15
with the range from GCMs. The vegetation feedback is globally relatively small. For CO2doubling it covers the range from−0.2 to+0.2 W m−
2
K−1. The ensemble mean is very close to zero. Climate–vegetation feedback is positive for CO2halving with values up to 0.3 W m−2K−1. Thus the vegetation feedback is state dependent. The feedback is more important in colder climates for two reasons. First, the albedo increase for CO2
20
halving is larger than the albedo decrease for CO2 doubling because snow in the NH extends further south in the colder climate, thus enhancing the changes in albedo due to vegetation cover shifts. Second, there is a higher potential of southward vegetation retreat compared to the northward vegetation expansion in warmer climates because the area of tundra and polar desert are already small for the preindustrial climate.
25
feed-BGD
10, 12967–13013, 2013
Asymmetry and uncertainties in climate-vegetation
feedback
M. Willeit et al.
Title Page
Abstract Introduction
Conclusions References
Tables Figures
◭ ◮
◭ ◮
Back Close
Full Screen / Esc
Printer-friendly Version Interactive Discussion
Discussion
P
a
per
|
D
iscussion
P
a
per
|
Discussion
P
a
per
|
Discuss
ion
P
a
per
|
back. Similarly to what happens for vegetation, for colder climates the potential for sea ice expansion to lower latitudes is less limited compared to the poleward sea-ice retreat in warmer climates.
Zonal mean plots of the feedback factors illustrate how the vegetation feedback is comparable with the other feedbacks in high northern latitudes, while it is close to zero
5
elsewhere, even if significant differences exist between different ensemble members (Fig. 12a). For both CO2 concentrations the vegetation feedback is positive in high northern latitudes but slightly negative in mid-latitudes with major uncertainties in the subtropics (Fig. 12b), especially for CO2doubling.
There is a reasonably high correlation between the global vegetation feedback factor
10
and global mean temperature change due to vegetation feedback (Fig. 13). The linear relation is valid for both halving and doubling of CO2and has approximately the same slope in both cases. The vegetation feedback factor is thus a robust measure of the strength of the climate–vegetation feedback, at least at global scale.
The range in the strength of the vegetation–climate feedback presented here
origi-15
nates only from the uncertainties in biogeophysical land–atmosphere processes. Addi-tional uncertainties would come from the response of vegetation cover to climate which is not represented in our study, because we use a single vegetation model. On a more fundamental level the uncertainty range would also be affected by the strength of the Charney feedbacks, i.e. the climate sensitivity, which in our study covers only a small
20
portion of the possible range estimated from data and different models. Considering also these factors could lead to an even larger uncertainty range in vegetation–climate feedback, thus our estimates can be regarded as conservative.
4 Conclusions
Using a multi-physics ensemble we studied the uncertainties in the strength of the
25
BGD
10, 12967–13013, 2013
Asymmetry and uncertainties in climate-vegetation
feedback
M. Willeit et al.
Title Page
Abstract Introduction
Conclusions References
Tables Figures
◭ ◮
◭ ◮
Back Close
Full Screen / Esc
Printer-friendly Version Interactive Discussion
Discussion
P
a
per
|
D
iscussion
P
a
per
|
Discussion
P
a
per
|
Discuss
ion
P
a
per
|
For CO2doubling there is not even an agreement on the sign of the global vegetation feedback between ensemble members. A step-by-step analysis of different vegetation processes shows evidence that a large part of the uncertainties comes from the re-sponse to vegetation shift. A robust warming of 0.1–0.4◦C over land is modelled due to a CO2induced reduction in stomatal conductance and, as the result, reduced
tran-5
spiration. The increased LAI slightly reduces this warming in all ensemble members. Allowing vegetation to adjust to the new climatic conditions results in an increase of the uncertainties and a total effect of vegetation on temperature over land that ranges from a−0.1◦C cooling to a+0.3◦C warming with a median around+0.1◦C. This value
is reduced to essentially zero if the global temperature is considered. Nevertheless we
10
find that vegetation causes an annual warming over the Amazon of 0.5◦C with values up to 2◦C in some ensemble members exhibiting rainforest dieback in this region. In northern mid- and high latitudes vegetation amplifies the seasonal cycle by about 1◦C through warming in spring-summer and cooling in winter. Major uncertainties arise from the forest reduction in the Amazon region and the Sahara “greening” in some ensemble
15
members.
For CO2 halving the vegetation feedback is found to be robustly positive with an enhanced cooling over land of −0.1 to −0.4◦C. The main contribution comes from
the high northern latitudes and is caused by an albedo increase due to southward retreat of the tree line. Globally, vegetation causes the temperature to decrease by a
20
median value of−0.2◦C, which is less than 10 % of climate sensitivity. The physiological
effect of lower CO2 and the decrease in LAI have only a minor effect on surface air temperature.
A comparison of vegetation feedback in terms of radiative imbalance at the top of the atmosphere with the traditional Charney feedbacks shows a globally small contribution
25
BGD
10, 12967–13013, 2013
Asymmetry and uncertainties in climate-vegetation
feedback
M. Willeit et al.
Title Page
Abstract Introduction
Conclusions References
Tables Figures
◭ ◮
◭ ◮
Back Close
Full Screen / Esc
Printer-friendly Version Interactive Discussion
Discussion
P
a
per
|
D
iscussion
P
a
per
|
Discussion
P
a
per
|
Discuss
ion
P
a
per
|
vegetation feedback is comparable or even more important than the fast feedbacks, particularly in the 140 ppm experiments.
Our results demonstrate that there is an asymmetry in the vegetation–climate feed-back between higher and lower CO2 worlds and that changes in different vegetation processes affect climate in very different ways in CO2 induced warmer and colder
5
climate. The physiological effect of CO2 on plants is shown to be most important in elevated CO2climates, while the effect of changes in climate on vegetation distribution is the dominant factor in climates colder than preindustrial. This highlights the need for caution when using past glacial climate change to derive Earth system sensitivity applicable for future climate change.
10
In this work we explore only part of the uncertainties affecting the strength of the vegetation–climate feedback. Additional uncertainties will arise from e.g. the dynamic vegetation model itself and the climate sensitivity. Better observational constraints on the choice of parameters and parameterisations of biogeophysical processes are re-quired to reduce the uncertainty range.
15
Acknowledgements. The research leading to these results has received funding from the Euro-pean Community’s Seventh Framework Programme (FP7 2007-2013) under grant agreement no. 238366. The authors thank Victor Brovkin for valuable comments and Michael Flechsig for advice on the use of the SimEnv simulation environment. M. W. thanks Daniela Dalmonech for useful discussions.
20
References
Ainsworth, E. A. and Rogers, A.: The response of photosynthesis and stomatal conductance to rising [CO2]: mechanisms and environmental interactions, Plant Cell Environ., 30, 258–270, doi:10.1111/j.1365-3040.2007.01641.x, 2007. 12970, 12976
Arneth, A., Harrison, S. P., Zaehle, S., Tsigaridis, K., Menon, S., Bartlein, P. J., Feichter, J., 25
BGD
10, 12967–13013, 2013
Asymmetry and uncertainties in climate-vegetation
feedback
M. Willeit et al.
Title Page
Abstract Introduction
Conclusions References
Tables Figures
◭ ◮
◭ ◮
Back Close
Full Screen / Esc
Printer-friendly Version Interactive Discussion
Discussion
P
a
per
|
D
iscussion
P
a
per
|
Discussion
P
a
per
|
Discuss
ion
P
a
per
|
Bala, G., Caldeira, K., Mirin, A., Wickett, M., Delire, C., and Phillips, T. J.: Biogeophysical effects of CO2 fertilization on global climate, Tellus B, 58, 620–627, doi:10.1111/j.1600-0889.2006.00210.x, 2006. 12971
Barlage, M., Zeng, X., Wei, H., and Mitchell, K. E.: A global 0.05◦ maximum albedo dataset
of snow-covered land based on MODIS observations, Geophys. Res. Lett., 32, L17405, 5
doi:10.1029/2005GL022881, 2005. 12975
Betts, A. K. and Ball, J. H.: Albedo over the boreal forest, J. Geophys. Res., 102, 28901, doi:10.1029/96JD03876, 1997. 12975, 13002
Betts, R., Cox, P., Lee, S., and Woodward, F.: Contrasting physiological and structural vegeta-tion feedbacks in climate change simulavegeta-tions, Nature, 387, 2–5, 1997. 12970, 12981, 12982 10
Betts, R., Cox, P., and Woodward, F.: Simulated responses of potential vegetation to doubled CO2climate change and feedbacks on near surface temperature, Global Ecol. Biogeogr., 9, 171–180, 2000. 12970, 12972
Betts, R. A., Cox, P. M., Collins, M., Harris, P. P., Huntingford, C., and Jones, C. D.: The role of ecosystem-atmosphere interactions in simulated Amazonian precipitation decrease 15
and forest dieback under global climate warming, Theor. Appl. Climatol., 78, 157–175, doi:10.1007/s00704-004-0050-y, 2004. 12972, 12983
Betts, R. a., Boucher, O., Collins, M., Cox, P. M., Falloon, P. D., Gedney, N., Hemming, D. L., Huntingford, C., Jones, C. D., Sexton, D. M. H., and Webb, M. J.: Projected increase in continental runoffdue to plant responses to increasing carbon dioxide, Nature, 448, 1037– 20
1041, doi:10.1038/nature06045, 2007. 12970
Bonan, G. B.: Forests and climate change: forcings, feedbacks, and the climate benefits of forests, Science, 320, 1444–1449, doi:10.1126/science.1155121, 2008. 12975
Bonan, G. B., Pollard, D., and Thompson, S. L.: Effects of boreal forest vegetation on global climate, Nature, 359, 716–718, doi:10.1038/359716a0, 1992. 12970
25
Bony, S., Colman, R., Kattsov, V. M., Allan, R. P., Bretherton, C. S., Dufresne, J.-L., Hall, A., Hallegatte, S., Holland, M. M., Ingram, W., Randall, D. a., Soden, B. J., Tselioudis, G., and Webb, M. J.: How well do we understand and evaluate climate change feedback processes?, J. Climate, 19, 3445–3482, doi:10.1175/JCLI3819.1, 2006. 12972
Boucher, O., Jones, A., and Betts, R. A.: Climate response to the physiological impact of carbon 30
BGD
10, 12967–13013, 2013
Asymmetry and uncertainties in climate-vegetation
feedback
M. Willeit et al.
Title Page
Abstract Introduction
Conclusions References
Tables Figures
◭ ◮
◭ ◮
Back Close
Full Screen / Esc
Printer-friendly Version Interactive Discussion
Discussion
P
a
per
|
D
iscussion
P
a
per
|
Discussion
P
a
per
|
Discuss
ion
P
a
per
|
Brodribb, T. J., McAdam, S. A. M., Jordan, G. J., and Feild, T. S.: Evolution of stomatal respon-siveness to CO2 and optimization of water-use efficiency among land plants, New Phytol., 183, 839–847, doi:10.1111/j.1469-8137.2009.02844.x, 2009. 12969, 12976
Brovkin, V., Ganopolski, A., and Svirezhev, Y.: A continuous climate–vegetation classification for use in climate-biosphere studies, Ecol. Model., 101, 251–261, 1997. 12973
5
Brovkin, V., Bendtsen, J. R., Claussen, M., Ganopolski, A., Kubatzki, C., Petoukhov, V., and An-dreev, A.: Carbon cycle, vegetation, and climate dynamics in the Holocene: experiments with the CLIMBER-2 model, Global Biogeochem. Cy., 16, 1–20, doi:10.1029/2001GB001662, 2002. 12971, 12973
Brovkin, V., Raddatz, T., Reick, C. H., Claussen, M., and Gayler, V.: Global biogeo-10
physical interactions between forest and climate, Geophys. Res. Lett., 36, L07405, doi:10.1029/2009GL037543, 2009. 12969
Cao, L., Bala, G., Caldeira, K., Nemani, R., and Ban-Weiss, G.: Importance of carbon dioxide physiological forcing to future climate change., P. Natl. Acad. Sci. USA, 107, 9513–9518, doi:10.1073/pnas.0913000107, 2010. 12970, 12981
15
Cess, R. D., Potter, G. L., Blanchet, J. P., Boer, G. J., Del Genio, A. D., Déqué, M., Dymnikov, V., Galin, V., Gates, W. L., Ghan, S. J., Kiehl, J. T., Lacis, A. A., Le Treut, H., Li, Z.-X., Liang, X.-Z., McAvaney, B. J., Meleshko, V. P., Mitchell, J. F. B., Morcrette, J.-J., Randall, D. A., Rikus, L., Roeckner, E., Royer, J. F., Schlese, U., Sheinin, D. A., Slingo, A., Sokolov, A. P., Taylor, K. E., Washington, W. M., Wetherald, R. T., Yagai, I., and Zhang, M.-H.: Intercomparison and in-20
terpretation of climate feedback processes in 19 atmospheric general circulation models, J. Geophys. Res., 95, 16601, doi:10.1029/JD095iD10p16601, 1990. 12979
Claussen, M., Kubatzki, C., Brovkin, V., Ganopolski, A., Hoelzmann, P., and Pachur, H.-J.: Sim-ulation of an abrupt change in Saharan vegetation in the Mid-Holocene, Geophys. Res. Lett., 26, 2037–2040, doi:10.1029/1999GL900494, 1999. 12971
25
Claussen, M., Brovkin, V., Ganopolski, A., Kubatzki, C., and Petoukhov, V.: Climate change in Northern Africa: the past is not the future, Climatic Change, 57, 99–118, doi:10.1023/A:1022115604225, 2003. 12971
Colman, R. and McAvaney, B.: Climate feedbacks under a very broad range of forcing, Geo-phys. Res. Lett., 36, 1–5, doi:10.1029/2008GL036268, 2009. 12972, 12986
30
BGD
10, 12967–13013, 2013
Asymmetry and uncertainties in climate-vegetation
feedback
M. Willeit et al.
Title Page
Abstract Introduction
Conclusions References
Tables Figures
◭ ◮
◭ ◮
Back Close
Full Screen / Esc
Printer-friendly Version Interactive Discussion
Discussion
P
a
per
|
D
iscussion
P
a
per
|
Discussion
P
a
per
|
Discuss
ion
P
a
per
|
Cox, P. M., Betts, R. A., Jones, C. D., Spall, S. A., and Totterdell, I. J.: Acceleration of global warming due to carbon-cycle feedbacks in a coupled climate model, Nature, 408, 184–187, doi:10.1038/35041539, 2000. 12969, 12972, 12983
Cramer, W., Bondeau, A., Woodward, F. I., Prentice, I. C., Betts, R. a., Brovkin, V., Cox, P. M., Fisher, V., Foley, J. a., Friend, A. D., Kucharik, C., Lomas, M. R., Ramankutty, N., Sitch, S., 5
Smith, B., White, A., and Young-Molling, C.: Global response of terrestrial ecosystem struc-ture and function to CO2and climate change: results from six dynamic global vegetation mod-els, Glob. Change Biol., 7, 357–373, doi:10.1046/j.1365-2486.2001.00383.x, 2001. 12973, 12974
Crucifix, M.: Does the Last Glacial Maximum constrain climate sensitivity?, Geophys. Res. Lett., 10
33, L18701, doi:10.1029/2006GL027137, 2006. 12972
DeMenocal, P., Ortiz, J., Guilderson, T., Adkins, J., Sarnthein, M., Baker, L., and Yarusinsky, M.: Abrupt onset and termination of the African Humid Period, Quaternary Sci. Rev., 19, 347– 361, doi:10.1016/S0277-3791(99)00081-5, 2000. 12971
Dickinson, R. E., Henderson-Sellers, A., and Kennedy, P. J.: Biosphere-Atmosphere Transfer 15
Scheme (BATS) version le as coupled to the NCAR community climate model. Technical note, Tech. rep., NCAR (National Center for Atmospherical Research), 1993. 12975, 12976, 12998, 12999
Doherty, R., Kutzbach, J., Foley, J., and Pollard, D.: Fully coupled climate/dynamical vegetation model simulations over Northern Africa during the mid-Holocene, Clim. Dynam., 16, 561– 20
573, doi:10.1007/s003820000065, 2000. 12971
Falloon, P. D., Dankers, R., Betts, R. A., Jones, C. D., Booth, B. B. B., and Lambert, F. H.: Role of vegetation change in future climate under the A1B scenario and a climate stabili-sation scenario, using the HadCM3C Earth system model, Biogeosciences, 9, 4739–4756, doi:10.5194/bg-9-4739-2012, 2012. 12971, 12972
25
Friedlingstein, P., Cox, P., Betts, R., Bopp, L., von Bloh, W., Brovkin, V., Cadule, P., Doney, S., Eby, M., Fung, I., Bala, G., John, J., Jones, C., Joos, F., Kato, T., Kawamiya, M., Knorr, W., Lindsay, K., Matthews, H. D., Raddatz, T., Rayner, P., Reick, C., Roeckner, E., Schnitzler, K.-G., Schnur, R., Strassmann, K., Weaver, A. J., Yoshikawa, C., and Zeng, N.: Climate–carbon cycle feedback analysis: results from the C4MIP model intercomparison, J. Climate, 19, 30
BGD
10, 12967–13013, 2013
Asymmetry and uncertainties in climate-vegetation
feedback
M. Willeit et al.
Title Page
Abstract Introduction
Conclusions References
Tables Figures
◭ ◮
◭ ◮
Back Close
Full Screen / Esc
Printer-friendly Version Interactive Discussion
Discussion
P
a
per
|
D
iscussion
P
a
per
|
Discussion
P
a
per
|
Discuss
ion
P
a
per
|
Ganopolski, A., Kubatzki, C., Claussen, M., Brovkin, V., and Petoukhov, V.: The influence of vegetation-atmosphere-ocean interaction on climate during the mid-Holocene, Science, 280, 1916–1919, doi:10.1126/science.280.5371.1916, 1998. 12971
Ganopolski, A., Petoukhov, V., Rahmstorf, S., Brovkin, V., Claussen, M., Eliseev, A., and Ku-batzki, C.: CLIMBER-2: a climate system model of intermediate complexity. Part II: model 5
sensitivity, Clim. Dynam., 17, 735–751, doi:10.1007/s003820000144, 2001. 12973
Garratt, J. R.: Review of drag coefficients over oceans and continents, Mon. Weather Rev., 105, 915–929, doi:10.1175/1520-0493(1977)105<0915:RODCOO>2.0.CO;2, 1977. 12971 Gedney, N., Cox, P. M., Betts, R. A., Boucher, O., Huntingford, C., and Stott, P. A.: Detection
of a direct carbon dioxide effect in continental river runoffrecords, Nature, 439, 835–838, 10
doi:10.1038/nature04504, 2006. 12970
Hansen, J. E. and Takahashi, T. (Eds.): Climate Processes and Climate Sensitivity, vol. 29, Geophysical Monograph Series, American Geophysical Union, Washington DC, doi:10.1029/GM029, 1984. 12978
Hansen, J. E., Sato, M., and Kharecha, P.: Target atmospheric CO2: where should humanity 15
aim?, Open Atmospheric Science Journal, 2, 217–231, 2008. 12972
Hellström, R.: Forest cover algorithms for estimating meteorological forcing in a numerical snow model, Hydrol. Process., 14, 3239–3256, doi:10.1002/1099-1085(20001230)14:18<3239:AID-HYP201>3.0.CO;2-O, 2000. 12975
Holdridge, L. R.: Determination of world plant formations from simple climatic data, Science, 20
105, 367–368, doi:10.1126/science.105.2727.367, 1947. 12969
Huntingford, C., Fisher, R. A., Mercado, L., Booth, B. B. B., Sitch, S., Harris, P. P., Cox, P. M., Jones, C. D., Betts, R. A., Malhi, Y., Harris, G. R., Collins, M., and Moorcroft, P.: Towards quantifying uncertainty in predictions of Amazon “dieback”, Philos. T. Roy. Soc. B, 363, 1857– 1864, doi:10.1098/rstb.2007.0028, 2008. 12983
25
Jiang, D., Zhang, Y., and Lang, X.: Vegetation feedback under future global warming, Theor. Appl. Climatol., 106, 211–227, doi:10.1007/s00704-011-0428-6, 2011. 12972
Jin, Y., Schaaf, C.B., Gao, F., Li, X., and Strahler, A. H.: How does snow impact the albedo of vegetated land surfaces as analyzed with MODIS data?, Geophys. Res. Lett., 29, 1374, doi:10.1029/2001GL014132, 2002. 12975, 13002
30