69
COUNTRIES’ SUSTAINABILITY TO ECONOMIC SHOCKS:
THE STUDY OF CENTRAL AND EASTERN EUROPEAN MARKETS
Arturas Jurgelevicius
University of Applied Sciences, Lithuania jurgeleviciusarturas@yahoo.co.uk
Abstract
Purpose – to analyze economic “shock” impact on Central and Eastern European countries’ sustainable economic development.
Design/methodology/approach – Statistical data has been analyzed and sustainability theory has been applied to Central and Eastern European countries during economic downturn 2008 – 2012.
Findings – Findings suggest that commonly used macroeconomic indicators do not reflect stable social economic development. Moreover, usually high economic growth during economic cycle is determent by high level of recession in economic cycle. This finding suggests that investors and other financial decision makers should take into account the sustainability of economic performance before taking financial decisions so that during financial economic recession could mitigate risks and loses in Central and Eastern European markets. Also the impact of intangible capital on countries’ sustainability was identified. There is a relationship between social and economic sustainability and intangible capital.
Research limitations/implications – Research is applied in the theory of sustainable economic development. The economic and social performance is being considered in the research. Although the concept of sustainable economic development is quite controversial in scientific literature, the aspects of economic and social indicators are taken into account not considering much of ecological aspects of sustainable development. The research logic is based on sustainability as constant and smooth social and economic development than the development through natural limitations and human being needs combinations.
Practical implications – Practical implications might be broad enough. Identification of reaction of economies to natural economic “shock” during economic downturn might be applied for governments decision makers, investors, banks, exporters to evaluate future economic financial decisions in Eastern and Central European markets.
Originality/Value – Value of the research might be high for interested parties. Applying sustainability theory to economies in transition during financial economic downturn 2008-2012 is original and novel.
Keywords: economic development, sustainability, economic “shock”, Central and Eastern Europe.
70
Introduction
The first decade of the third millennium was marked by fruitful events for economists. Most of the growth in the West was explained by real estate bubbles but not by the improvements in sustained productivity. Economic growth was followed by deep recession bringing new lessons to be learnt about economic processes and economic regulations. In the light of the economic downturn R. Shiller was awarded by Nobel prize in economics. The main idea of his research was that formal and informal institutions are not capable to regulate economic processes basically financial markets. In the context of sustainable development theory, in the paper sustainable economic system is treated as that system which is able not to diminish its wealthier during economic recession. In this way social and economic indicators are being analyzed in Central and Eastern European countries which response to economic shocks are undiscovered well yet. Central and Eastern European countries considered to be still the economies in transition because many social and economic indicators did not achieve the development level of advanced western markets neither in qualitative nor quantitative approach.
The economies in transition have been chosen for methodological matters. The economies are taken into account by analyzing social and economic indicators which should assess the performance of the economies during economic recession. Statistical analyses and econometric estimations are used in the research.
The concept of sustainable economic development
71
more about striving for economic and social development that would be compatible with environmental protection (Ciegis et al, 2009).
The sustainable economic development put emphasis on “needs” and “limitations”. Needs are understandable as needs of combination of present and future generations and limitations are understandable as save consumption of present generation. Needs and limitations closely associated with production and consumption. Increased welfare in society demands new and better products that increase incentives for enterprises more to produce. In this place efficiency in society and economy is crucial (Rutkauskas, 2012). However, the use of natural resources might be put in different consideration in different economic structure societies. More service produce societies have more intensive for human and capital usage since these societies have already gained certain capital ratio in the market. In this case, such societies are more concerned about effective usage its educational systems, trainings and service sectors. Less developed or developing countries put emphasis more on usage of natural capital since market capital ratio might be relatively low.
Sustainable economic development provides with a few criteria – sustainable consumption (Repetto, 1986), the level of utility of society cannot be diminishing in time (Pezzey, 1992). This concept is a complex notion and treated by different authors differently. On one hand, sustainability provides various indicators and contributes to competitiveness on the given country (Balkyte et. al., Tvaronaviciene, 2010). Also sustainability might be considered as sustained economic system and sustained governance (A. V. Rutkauskas et. al., 2012).
However, the critics of sustainable economic development stress that the concept itself is vague, there are much of contradictions (Ruchi, 2009). Some authors suggest that sufficiency should be a goal but not efficiency (Lankauskiene et al., 2012). An economic growth should be combined with development, quantitative change with qualitative change (Du Pisani et. al., 2006).
As mentioned above a number of literature provides three fundamental dimensions of sustainable economic development: economic, social and environmental (Pierantoni, 2004; Ciegis, Zeleniute, 2008; Ghosh, 2008; European Commision, 2009).
The economic sustainability concept is based upon Solow’s (1986, 1993) theoretical approach on capital convertibility and Hicks-Lindahl concept of maximum income which can be acquired by saving essential wealth (capital) resources for the benefit of future generations (implementing the principle of fair distribution among generations). Social sustainability seeks to reduce vulnerability and maintain the health of social and cultural systems, and their ability to withstand economic shocks (Chambers, 1989; Bohle et al., 1994; Ribot et al., 1996). Nerveless estimation of social capital raises many challenges. Different studies suggest with strong evidence that social capital is crucial element for socio-economic system stability. Sustained social capital resists to economic shocks, downturns and different economic financial crisis remaining the entire economic system stable.
72
Commonly used indicators should gain more qualitative approach rather than only quantitative approach, for example, GDP. For measuring sustainable development Commission suggests pay more attention on following criteria: real per capita produced capital rate, savings and consumption or income ratio, human development index, life expectancy, quality of living, social exclusion and people at risk of poverty, employment, etc.
The Specificity of development of Central and Easter European countries for the last 25 years
In Lithuania as in other Central and Eastern European countries without long discussions the neoliberal imitation to transformation was chosen for transition from centrally planned economy to market economy. Imitational orientation means that Western economic models were trying to adopt and neoliberalisation – associated with deregulation process almost in all fields of economic activities. That is to say in the beginning of the privatization process two thirds of state owned capital was privatized only in two years. According to many scholars, privatization should be the last stage of transition to market economy, only then when market economy institutes are created: social capital, human capital, rule of law, social trust, entrepreneurship skills, taxation system, etc. (Marangos, 2005). Of course, these processes take place decades as well as transition to market economy and require certain preconditions. Unfortunately at the time, political elite, some economists and probably the most important society were dreaming that neoliberal economic model would bring by itself ( probably society was persuaded by Adam Smith’s “invisible hand” panacea and governing elite by strong international financial institutions pressure) fast transition to market economy, achieving Western economic indicators and quality of living for all social groups.
Extensively developed economy in Soviet Union collapsed and perhaps it was the main reason of it. It was necessary to direct the economy to free market oriented model of development and it was impossible without elimination of old political system (Kornai, 1995).
After the collapse of enormous and extremely difficult social and economic system mainly two approaches were possible for transition to liberal market economy: „gradualist“ approach or “step by step” or „shock therapy“ or extremely rapid destroy of old social and economic structures and provision to liberal market economy‘s „invisible hand“ . According to Nobel prize laureate Joe Stiglitz “invisible hand” is invisible because it is not there. Gradual transformation dominated in Belarus, Central Asia, in Russia after 2000, for some time in Bulgaria and Rumania.
Social and Economic development of CEE during Economic Shock in 2008-2012
73
only for politicians but economists as well. Every post-communist country choose its own path on the way to market economy. After 25 years of colourful changes the author of the article think that it is the right time to make some assessment on processes that were controversial at that time through sustainable economic development approach.
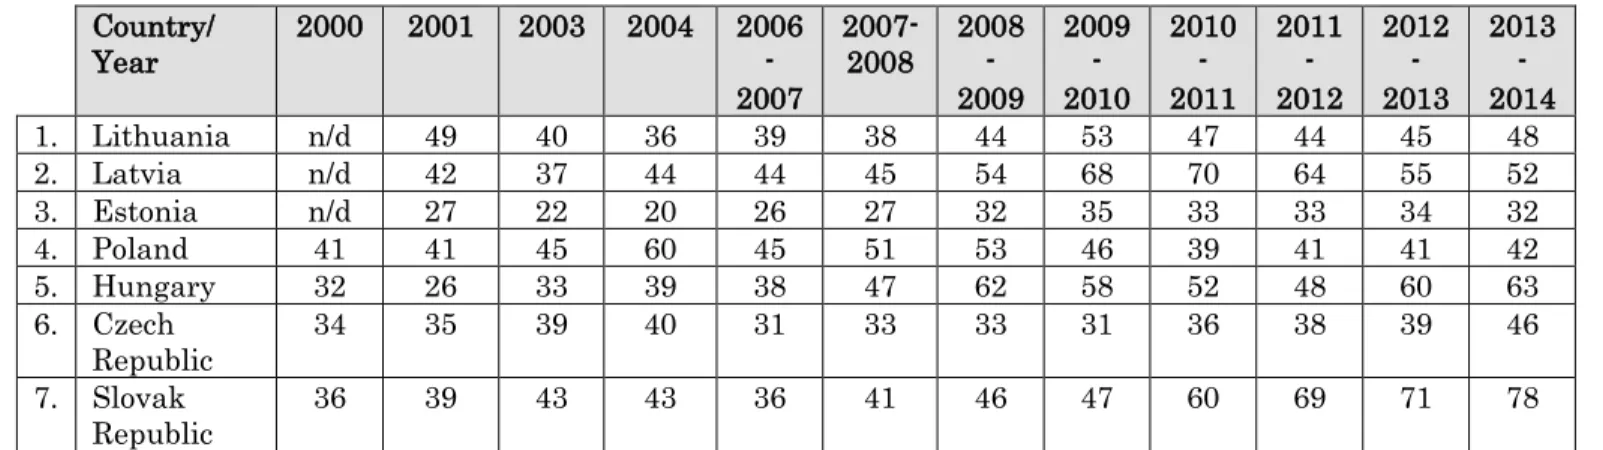
1 table shows the dynamic of global competitiveness index presented by World’s Economic Forum. That is to say three Baltic states were not taken into account in 2000. The number of assessed countries was expanded from 58 in 2000 to 148 in 2014. The methodology of global competitiveness index was reviewed a few times during analysed period but the authors of the article make assessment in the framework of officially provided methodology. Comparing global competitiveness index 2000 and 2014 the significant change is determined. Only one country’s (Lithuanian) competitiveness has improved over 14th years. Some others’ competitiveness index have slightly deteriorated (Poland, Estonia). Two of transition countries’ competitiveness has fallen by 10 positions (Latvia, Check Republic). Other countries’ in transition competitiveness have fallen more than double behind more than 30 additional countries (Hungary, Slovak Republic). How Lithuania has remained its competitiveness over 14 years while other countries’ competitiveness deteriorated and some of them deteriorated a lot?
Table 1. The dynamics of the global competitiveness index
Country/ Year
2000 2001 2003 2004 2006 -2007
2007-2008
2008 -2009
2009 - 2010
2010 - 2011
2011 - 2012
2012 - 2013
2013 - 2014
1. Lithuania n/d 49 40 36 39 38 44 53 47 44 45 48
2. Latvia n/d 42 37 44 44 45 54 68 70 64 55 52
3. Estonia n/d 27 22 20 26 27 32 35 33 33 34 32
4. Poland 41 41 45 60 45 51 53 46 39 41 41 42
5. Hungary 32 26 33 39 38 47 62 58 52 48 60 63
6. Czech Republic
34 35 39 40 31 33 33 31 36 38 39 46
7. Slovak Republic
36 39 43 43 36 41 46 47 60 69 71 78
Notice: in 2000 global competitiveness ranking was estimated out of 58 countries comparing with 148 countries in 2014
Source: World Economic Forum reports 2000-2014
74 Source: UNDP, 2014
Figure 1. GDP per capita in PPP in CEE
Baltic countries real GDP growth rates were the highest ones in all European Union estimating the growth of 7-8% rate on average. Accession to EU encouraged FDI in all countries. However the Baltic states were not exception among other countries. That is to say the growth was based on housing credits and supporting export initiatives very hardly investing in new technologies and innovations. Because of deep financial downturn in 2008-2009 Baltic states experienced one of the highest falling GDP rate in EU – Lithuania 17%, Estonia 14%, Latvia 18%. Only Poland remained a country which did not experience recession and during the peak of financial downturn Poland’s GDP growth rate was 1%. That is to say, Poland’s government twice devaluated zloty that made polish export competitive in European markets. Separate from Poland, Lithuania did not have even theoretical chance to devaluate Lithuanian Litas because of its exchange linking to Currency Board model. However, Baltic states sustainability considered as stability might be said that is poor enough accounting the highest GDP drop among CEE countries and EU-28. In this perspective short term investment are risky enough in these types of countries. However the Baltic states had recovered faster than any other CEE country and experienced one of the highest rates of growth in EU-28.
Source: Eurostat database, 2014
Figure 2. Real GDP growth rate
0 10000 20000 30000
Slovenia Czech Republic
Estonia Slovakia Hungary Poland Lithuania Latvia
2005 2011
-20 -15 -10 -5 0 5 10
2008 2009 2010
75
Chart 3 indicates the unemployment increase. Again the Baltic states demonstrated the highest absolute unemployment rates achieving from 16% up to 19% of all active labour force in the labour market. Extremely high level of labour forces demonstrates that economy is unstable and unsustainable since economic fluctuations directly reduce wellbeing in society. According to Chart 3 the highest unemployment rate change is seen in Estonia, Lithuania, Latvia, respectively 206%, 205%, 148% from the level being before financial downturn to its bottom line of the fall.
Source: Eurostat database, 2014
Figure 3. Unemployment rate increase during downturn peak
Moderate loss of labour force in the labour market in Czech Republic, Poland, Hungary, Slovak Republic and Slovenia could be explained by their capability to adopt to economic “shocks”. Also the great change in employment represents the quality of workforce skills, trainings, outcomes of educational system (International Labour Office, 2010). Qualitative educational and training systems in the country encourage workforce for innovations, better investments and business management in general. High level of unemployment contradicts to sustainable development concept’s premise that national capital should increase over time. High rate of unemployment restricts potential economic growth, does pressure on public finances and most important long term unemployment might cause mental or psychological problems. Another negative aspect of unemployment is that higher workforce supply reduce nominal wages of qualified workers. In a short period this phenomena might bring competitive advantage on cost, however, in a long period workers will lose their initiatives for more productive work. As it is seen from Chart 4 and 3 all three Baltic states has the highest rate of unemployment and unemployment rate change since the beginning of crisis till the pick of downturn of it.
0 5,000 10,000 15,000 20,000
Latvia Lithuania Estonia Slovak Republic
Hungary Poland Czech Republic
Slovenia
76
Source: author’s estimations 2014
Figure 4. Unemployment rate change comparing 2008 vs 2010
Chart 5 presents relationship between unemployment change and government spending on education. However, graphs shows opposite relations to expected – statistical correlation contradicts to thesis that the more government spends on education the more sustainable workforce is. However, the distortion of correlation might suggest that there is significant impact of efficiency of government. Some studies suggest that the efficiency of government is one of the main tools for implementing policies. The Baltic States and other CEE countries have poor government efficiency (The Strategy of Europe, 2012).
Source: UNDP, 2014
Figure 5.Workforce sustainability dependency on government spending on education
Human Development Index (HDI) estimated by United Nations could be analysed in Chart 6. It is seen that countries with less unemployment rate have higher lever of HDI. Even though, there is a trend that all CEE countries have improved their social and economic development and all might be grouped as high developed countries, the
206 205
148
66 65 51
36 35
Estonia Lithuania Latvia Slovenia Slovak Republic
Hungary Poland Czech Republic
0 50 100 150 200 250
3 3.5 4 4.5 5 5.5 6
Un
e
mp
lo
y
me
n
t r
a
ti
o
2008/
2010
Government spending on education, % of GDP
SLK
CZH
LT
LV
POL HUN SLV
77
difference among them still exists. Slovenia has one of the smallest rate of unemployment and GDP downturn as well as Czech Republic. Latvia, Lithuania and Poland has the lowest rate of HDI making a progress in 7 years just for 0,02 HDI points.
Source: UNDP, 2014
Figure 6. Human Development Index dynamics in CEE countries
Source: author’s estimations based on UNDP, 2014
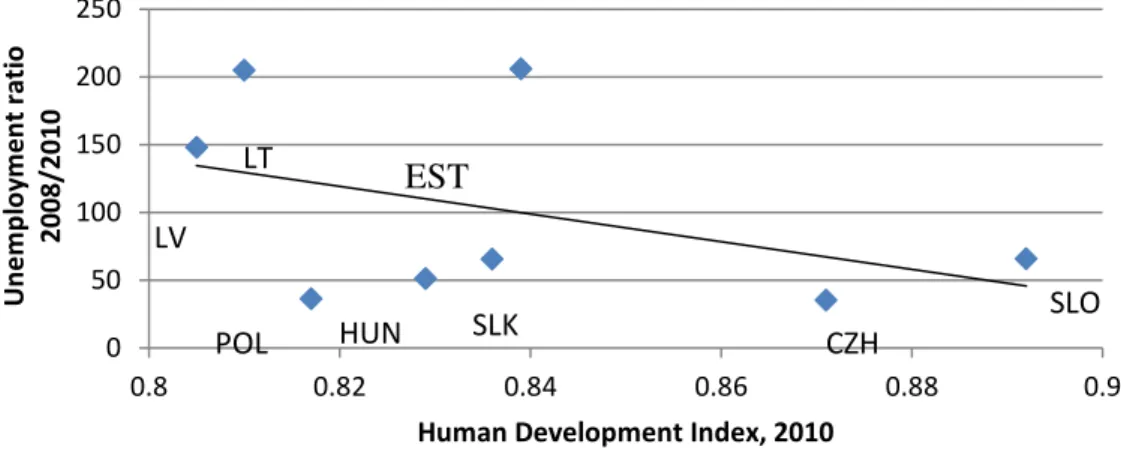
Figure 7. Human Development Index and unemployment rate change
As seen from Chart 7, there is a correlation between Human Development Index and Unemployment ratio change since the beginning of economic downturn till its pick. Lithuania and Latvia have the highest unemployment rate of change and the least HDI, respectively 0,81 and 0,805. Poland, Hungary and Slovakia grouped as low unemployment rate change countries having high HDI. Czech Republic and Slovakia are grouped as the highest HDI ranking countries having the one of the lowest rates of
0.78 0.8 0.82 0.84 0.86 0.88 0.9
2005 2006 2007 2008 2009 2010 2011 2012
H u ma n D e v e lo p me n t ra n k in g Slovenia Czech Republic Estonia Slovakia Hungary Poland Lithuania Latvia 0 50 100 150 200 250
0.8 0.82 0.84 0.86 0.88 0.9
U n e mp lo y me n t ra ti o 2008/ 2010
Human Development Index, 2010
LT
LV
SLO CZH
78
unemployment change. So it could be concluded that human development matters for labour sustainability as well as for economic development as well.
Conclusions
The research suggests following conclusion. CEE countries could be grouped in three main blocs. The first block of countries might be considered as able to resist to economic downturn saving relatively low social and economic losses during financial economic downturns. These countries are: Slovenia and Czech Republic. Another group of CEE countries are countries which have medium ability to adopt themselves to economic “shocks” and sustain social economic development: Hungary, Poland, Slovak Republic. The third group of countries that easily linked to economic and social fluctuations and less to resistance to economic “shocks” are the Baltic States: Lithuania, Latvia and Estonia. The amplitude of fluctuations of their social and economic parameters is the most radical among CEE countries.
The research suggests that intangible capital (social capital, human capital, institutional capital) is a significant component in the development of the countries as economic “shocks” mitigating factor. Economies that have higher level of intangible capital accumulation are more likely to bring less social, economic and financial loses during economic cycle’s recession period. However, the research field is relatively new and forward studies must be carried out for deeper understanding of intangible capital impact on countries’ sustainable development and ability to resist to economic “shocks”.
References
Balkyte A. et. al. (2010) Perception of competitiveness in the context of sustainable development: facets of sustainable competitiveness. Journal of Business Economic and Management, 2010, 11(2): 341– 365
Bohle, H. G., et. al. (1994). Climate change and social vulnerability: toward a sociology and geography of food insecurity. Global Environmental Change, 4(1), 37-48.
Chambers, R. (1989). Vulnerability, coping and policy. IDS Bulletin, 20(2), 1–7.
Ciegis R., et. al. (2009). The Concept of Sustainable Development and its Use for Sustainability Scenarios. ISSN 1392-2785 Inzinerine Ekonomika-Engineering Economics(2).
Ciegis, R. et. al. (2008). Ekonomikos plėtra darnaus vystymosi aspektu. Taikomoji ekonomika: sisteminiai tyrimai, 2(1), 35-52.
Du Pisani, Jacobus A. (2006). Sustainable development- historical roots of the concept. Environmental Sciences, 3(2): 83-96.
European Commission (2009). Sustainable Development Indicators. Overview of relevant FP-funded research and identification of further needs.
European Union statistical database. [Accessed 2014-03-15] http://epp.eurostat.ec.europa.eu.
Ghosh, N. (2008). The Road from Economic Growth to Sustainable Development: How was it Traversed?
79 International Labor Office (2010). A Skilled Workforce for Strong, Sustainable and Balanced Growth. A G20 Training Strategy.
Kornai J. (1995) Lasting growth as the top priority: Macroeconomic tensions and government economic policy in Hungary. Acta Oeconomica, , 47(1–2): 1–38.
Lankauskiene, T. et. al. (2010). Plausible Foreign Direct Investment’s Impact on Sustainable Development Indicators of Differently Developed Countries. Journal of Security and Sustainability Issues, 2011, 1(1): 27–38.
Marangos J. (2005). A Political Economy Approach to the Classical Gradualist Model of Transition, Journal of Economic Surveys Vol. 19, No. 2 Colorado State University.
Our Common Future (1987). World Commission on Environment and Development.
Pezzey, J. (1992) Sustainable Development Concepts. An Economic Analysis / World Bank Environment Paper, No. 2.
Pierantoni, I. A. (2004). Few Remarks on Methodological Aspects Related to Sustainable Development. Measuring Sustainable Development: Integrated Economic, Environmental and Social Frameworks. OECD.
Repetto R. (1986). World Enough and Time. New Haven, CT: Yale University Press.
Ribot, J. C., et. al. (1996). Climate variation, vulnerability and sustainable development in the semi-arid tropics. Eds. Ribot, J. C., Magalhaes, A. R., & Pangides, S. S. Climate Variability, Climate Change and Social Vulnerability in the Semi-Arid Tropics. Cambridge.
Ruchi, M. (2009). Sustainable development- how far is it sustainable? Proceedings of World Academy of Science: Engineering & Technology (51): 754-757
Rutkauskas A.V. (2012). Using Sustainability Engineering to Gain Universal Sustainability Efficiency. Sustainability 2012, 4, 1135-1153.
Rutkauskas, A. V., et. al. (2012). With Sustainability Engineering to Sustainability Efficiency. The 7 the International Scientific Conference “Business and Management 2012” (May 10 - 11, 2012, Vilnius, Lithuania). 173-184.
Solow, R. M. (1986). On the intergenerational allocation of exhaustible resources. Scandinavian Journal of Economics, 88(2), 141-156.
Solow, R. M. (1993). An Almost Practical Step towards Sustainability. Resources Policy(19), 162-172. Stiglitz J. et. al. (2009). Report by the Commission on the Measurement of Economic Performance and Social Progress.