393
Classification Of Cluster Area Forsatellite Image
Thwe Zin Phyo, Aung Soe Khaing, Hla Myo Tun
Abstract: This paper describes area classification for Landsat7 satellite image. The main purpose of this system is to classify the area of each cluster contained in a satellite image. To classify this image, firstly need to clusterthe satellite image into different land cover types. Clustering is an unsupervised learning method that aimsto classify an image into homogeneous regions. This system is implemented based on color features with K-means clustering unsupervised algorithm. This method does not need to train image before clustering.The clusters of satellite image are grouped into a set of three clusters for Landsat7 satellite image. For this work, the combined band 432 from Landsat7 satellite is used as an input. Satellite image(Mandalay area in 2001) is chosen to test the segmentation method. After clustering, a specific range for three clustered images must be defined in order to obtain greenland, water and urban+balance.This system is implemented by using MATLAB programming language.
Keywords: Image segmentation, K-means clustering Algorithm, Remote sensing, content classification.
————————————————————
I.
I
NTRODUCTIONRemote sensing is a process of gathering information about an object or area on the surface of the earth without being in direct contact with it. Thus the sensors are not in direct contact. The information needs a physical medium to travel from the objects/areas to sensors. The electromagnetic radiation is used as an information carrier in remote sensing. Remote Sensing refers to acquisition of earth information. The output of a remote sensing system is an image representing the scene being observed usually called as Remote Sensing Images. The remote sensing technology is currently being offered a wide variety of digital imagery that covers most of
the Earth‘s surface [1]. Content-based image classification has been an interesting subject of many researchers in recent years. There are many great efforts in developing the classification approaches and techniques to improve the classification accuracy. Recently, many advanced classification approaches, such as artificial neural networks, clustering method, fuzzy-sets, and expert systems have been widely applied for the problem of image classification. In general, image classification can be classified into two major approached: supervised and unsupervised learning method for this problem. Among them, the proposed system used the K-means clustering algorithm that is unsupervised learning method for image content classification. Unsupervised clustering is a fundamental tool in image processing for geosciences and remote sensing applications. For example, unsupervised clustering is often used to obtain vegetation maps of an area of interest. This approach is useful when reliable training data are either scarce or expensive, and when relatively little a priori information about the data is available. Clustering algorithms for content image classification are divided into two categories: pixel-based and object-based approaches. In this system, pixel-based clustering approach is used to cluster the same content information from the image.
The objective of this system is to develop a classification system for satellite images into clusters and to help the planner and policy maker in their land arrangement process.Other objectives are to calculate the amount of area of each cluster of satellite image and to combine image processing and K-means clustering algorithm for real word applications. In this system, a satellite image is clustered using K-means clustering method. The whole image will be clustered into three clusters to show the different content from the satellite image. Three clustered images can be used to define in land types such as greenland, water and urban+balance.
II.
C
OLOR SPACE FOR IMAGE PROCESSINGThis section describesL*a*b* colorspace that is used to aspire the perceptual uniformity of human vision. A color space is a method to specify, create and visualize color. As humans, color may be defined by its attributes of brightness, hue and colorfulness. A computer may describe a color using the amounts of red, green and blue phosphor emission required to match a color. A color is specified using co-ordinates, or parameters. These parameters describe the position of the color within the color space being used[2].
A. L*a*b* Color Space
L*a*b* color is designed to approximate human vision. It
aspires to perceptual uniformity, and it‘s L* component closely
matches human perception of lightness [2]. When a color is expressed in CIELAB, L* defines lightness. The L*a*b* space consists of a luminosity-layer L*, chromaticity-layer a* indicating where color falls along the red-green axis, and chromaticity-layer b* indicating where the color falls along the blue-yellow axis. All of the color information is in the a* and b* layers. This color space is better suited to many digital image manipulations than RGB color space, which is typically used in image editing programs.L*a*b* color space is useful for sharpening images and the removing artifacts in images or various images from digital cameras and satellite[2].
B. RGB to L*a*b* Color Space Transformation (Linear Model)
There are five models that can be used for the RGB to L*a*b* transformation: linear, quadratic, direct, gamma and neural networks. The simplest model of all, the RGB to L*a*b* transformation is a linear function of the (R, G, B) variables [3]:
_______________________
Thwe Zin Phyo, Aung Soe Khaing, Hla Myo Tun Department of Electronic Engineering
394
Where M11…M34are parameters matrix values.
III.
U
NSUPERVISEDL
EARNINGClustering algorithms used for unsupervised classification of remote sensing data according to the efficiency with which clustering takes place. Clustering is the process of grouping samples so that the samples are similar within each group. Clustering is a data mining technique used in statistical data analysis,data mining, pattern recognition, image analysis etc. Different clustering methods include hierarchical clustering and partitional clustering. Hierarchical clustering builds a hierarchy of clusters from individual elements. In partitional clustering; the goal is to create one set of clusters that partitions the data in to similar groups. In this paper, K-means clustering approach has been used for performing image segmentation using Matlab software.Clustering means classifying and distinguishing things that are provided with similar properties[7].Figure 1 shows Different Clustering Groups. In this paper, clustering algorithm is categorized as follows:
Clustering
PartitionHierarchical
K-meansSOM Agglomerative Divisive
Figure 1. Different Clustering Groups
B.K-Means Clustering Algorithm
K-means [8] is one of the simplest unsupervised learning algorithms that solves the well known clustering problem. The procedure follows a simple and easy way to classify a given data set through a certain number of clusters fixed priori. The main idea is to define k centroids, one for each cluster. These centroids should be placed in cunning way because different location causes different result.So the better choice is to place them as much as possible far away from each other. The next step is to take each point belonging to a given data set and associate it to the nearest centroid.When no point is pending, the first step is completed and an early group is done. This point needs to re-calculate k new centroids of the clusters resulting from the previous step. After this process have k new centroids, a new binding has to be done between the same data set pints and the nearest new centroid. A loop has been generated as a result of this loopthat the k centroids change their location step by step until no more changes are done. The mathematical equation of K-means algorithm
Where,
k = the number of clusters
xj=the pattern j evaluated in a relation to the centroid
d2 xj, ck = the distance between pattern xjand centroid ck The K-means algorithm contains the following steps:
1. Initialize the number of cluster k and assign the center for each cluster at random.
2. Calculate the distance between each object and the cluster center, and then assign the object to the closest cluster.
3. Recalculate the new centroid for each cluster and replace each value by the respective cluster center and then group based on minimum distance.
4. Repeat 2 and 3, until no changing in the center of clusters.
The advantage of K-means algorithm is that it works well when clusters are not well separated from each other, which is frequently encountered in satellite image. However, K-means requires the user to specify the initial cluster centers[4]. Figure 2 shows the flowchart of K-means clustering algorithm.
Figure 2. The flowchart of K-Means clustering Algorithm
C. Classification Steps
In classification step, three clustered images must be defined a specific range for each cluster to get the classified image
Start
End
Initialize the number of cluster k
Group based on minimum distance to the new center
Computethe distance between objects and centroid
Assign the center for each cluster
Do the center of clustersunchange?
395 using their RGB pixels values[5]. This range can be defined as
follows:
For greenland :(R>B>G)
Thepixel value of R(Red) must be the greatest value among three pixel values. And, the pixel value of B(Blue) must be larger than the value of G(Green). If these two conditions are satisfied, this clustered region can be defined as greenland.
For water: (R<G<B)
The pixel value ofR(Red) must be the smallest value compared with pixel values of B(Blue) and G(Green).And, the pixel value of B(Blue) must be larger than the value of G(Green). If these two conditions are satisfied, this clustered region can be defined as water.
For urban+balance:
The remaining regions that are not defined as greenland and water can be classified as urban+balance.
IV.
S
YSTEM DESIGNThis section includes system design of the proposed system. This system uses K-Means clustering which is unsupervised learning method, it does not need the training data. First, Obtain the input image from Landsat 7 satellite and this image is performed pre-processing stage to get color RGB image. Then, the input RGB image is converted into L*a*b* image and this image is clustered by using K-means clustering algorithm. And then, the clustered images must be classified as greenland, water and urban+balance according their pixel values.Figure 3 shows the system design of the proposed system.
Figure 3. System design of the proposed system
A. Image Pre-processing
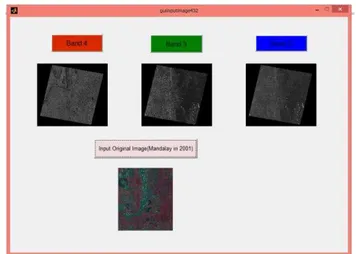
In this section, the image from Landsat 7 satellite is combined into RGB color image because input images received from Landsat 7 satellite are separate images with their specific wavelength range. This input image is used band 4(Near Infrared ),band 3(Red) and band 2(Green). In combined image, band 4(NIR) is used as Red ,band 3 is used as Green and band 2 is used as Blue. It is called false color RGB image. False color is more suitable than other combined bands (eg. True color and natural color) because both true color and natural color are little contrast and features in the image. So these color images are hard to distinguish and these are not clear to show the regions. Figure 4 shows the combined input image in pre-processing stage.
Figure 4. Combined Input Image in pre-processing stage
B. Color-Based Segmentation Using K-Means Clustering
The basic function is to segment colors in an automated fashion using the L*a*b* color space and K-mans clustering. The process can be summarized in the following steps.
Step 1: Read the satellite image.
Read the satellite image which is to be segmented. The image should be *.tif* file format because the pixel values of image(*.tif*) file format is more accurate than other format such as JPG file format. The pixel values of the image with *.tif* are different other format.
Step 2: Convert the image from RGB color space to L*a*b* color space.
The L*a*b* color space (CIELAB or CIE L*a*b*) enables to quantify these visual differences. The L*a*b* color space
consists of luminosity ‗L*‘or brightness layer, chromaticity
‗a*‘indicating where color falls along ‗b*‘ indicating where the
color falls along the blue-yellow axis. All of the color information is the a* and b* layers.It can be measured the difference between twocolors using squared Euclidean distance matric.
Step 3: Classify the colors in a*b* space using K-means Clustering.
Clustering is the way to separate group of objects. K-means clustering treats each object as having a location in space. It finds partitions such that objects within each cluster are as
Input Satellite Image
Image Pre-processing
Convert RGB to L*a*b* color space
Produce classified images such as
greenland, water and urban+balance
Classify the image using RGB pixel
values
396 close to each other as possible, and as far from objects in
other clusters as possible. K-means clustering requires specifying the number of clusters to be partitioned. Since the color information exists in a*b* space, the objects are pixels with a* and b* values. K-means is used the objects into three clusters using the squared Euclidean distance metric.
Step 4: Label Every Pixel in the Image Using the Results from K-mean.
For every object in the input image, K-means returns an index corresponding to a cluster.
Step 5: Create Images that Segment the Image by Color. Using pixel labels, the objects in image is separated by color, which will result in three clusters images.
B. Implementation
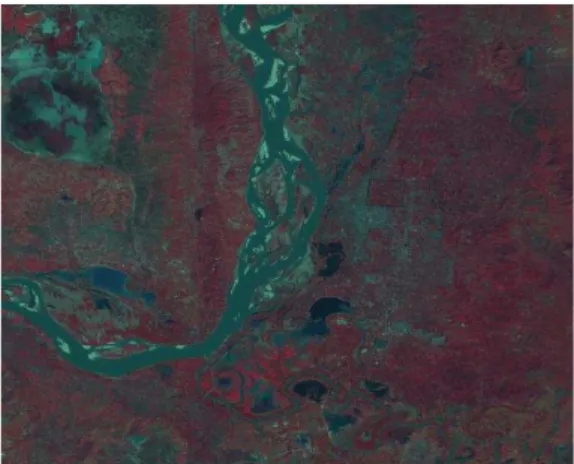
Firstly, the image obtained from Landsat 7 satellite is as an input but Landsat 7 satellite is performed in pre-processing stage to get color image. In this pre-processing stage, the input image is combined band 4,band 3 and band 2. In combined band, band 4(NIR) is used as Red,band 3 is used as Green and band 2 is used as Blue. It is called false color. This image contains RGB(Red, Green, Blue). So, this satellite image(RGB image) is converted into L*a*b* color space because L*a *b* space easier to distinguish than any other color space in Matlab program. Then L*a*b* color image is segmented into three clusters with different color using K-means clustering algorithm in Matlab programming language. This algorithm distinguishes the given satellite image into different clusters of pixel in the feature space, each of them defined by its center. Each pixel in the image is allocated to the nearest cluster. Then the new centers are computed with the new clusters. And the new clusters can be shown different color according color based segmentation method. After clustering, three clustered images must be assigned a specific range in order to get the classified images such as greenland, water and urban+balance. Figure 3 shows the Original Satellite Image(Mandalay Area from Landsat 7 satellite in 2001) used as input image. Figure 5 shows the satellite image (RGB image) converted to L*a*b* image.
Figure 3. Original Satellite Image (Mandalay area in 2001)
Figure 5. Converting RGB image to L*a*b* image
Figure 6.Classified images such as greenland ,water and urban+balance (Mandalay Area in 2001)
C. Simulation Results
397
V.
D
ISCUSSIONSA
NDC
ONCLUSIONSatellite image clustering and area classification have been described in this system. Grouping of objects in the data is performed using K-means clustering algorithm. The number of clusters depends on the number of content of the original image. The choice of k values is also important for clustering problem. If the image has less content, k values should be small. In this system, the number of cluster is three because the user wants to segment this image into three clusters. Many clusters are hard to define the area for each cluster in satellite image. The more the cluster, the longer the time to calculate for each cluster.Using color based image segmentation; it is possible to decrease computational cost avoiding for every pixel in the image. This system is helpful for the land management planner in decision making process. The advantage of K-means algorithm is that it works well when clusters are not well separated from each other, which is frequently encountered in images. However, the disadvantage of K-means algorithm is needed to specify the number of cluster in advance.The results of clustered image are easily to be used for classifying. In classification step, the results of clustered image must be assigned a specific range for each cluster according to their RGB pixel values. In this system, it is difficult to define RGB pixel values automatically in Matlab software for each cluster. The disadvantageof classification is needed to specify the pixel values for greenland, water and urban+balance. The pixel values of the images cannot be the same due to different time when the image is taken. In this condition, the RGB pixel values of satellite image are different because of the light effects, time effects and weather condition. So, the complex pixel values of satellite image after clustering must be performed pre-processing stage (eg.
filtering, enhancing and other. …) to get clear image.This method cannot be performed for complex images because it has limitation. So, this system is needed to classify to obtain clear image.
A
CKNOWLEDGEMENTSThe author would like to thank to Dr. Hla Myo Tun, Associate Professor and Head of the Department of Electronic Engineering, Mandalay Technological University for his help. And thanks to all teachers from Department of Electronic Engineering and Remote Sensing Department, Mandalay Technological University for their guidance, support and encouragement.
R
EFERENCES[1] Chandrakala, Classification of Remote Sensing Image Areas Using Surf Features and Latent Dirichlet Allocation, International Journal of Advanced Research in Computer Science and Software Engineering, vol.3, issue.9,2013.
[2] Adrian Ford and Alan Roberts: Colour Space Conversions, UK, (1998).
[3] http://en.wikipedia.org/wiki/Lab_color_space
[4] T. Q. Chen and Y. Lu, ―Color image segmentation an innovative approach‖, Pattern recognition, vol. 35,
2002, pp. 395-405.
[5] Shefali Aggarwal Photogrammetry and Remote Sensing Division Indian Institute of Remote Sensing, Dehra Dun:Principles of Remote Sensing.
[6] http://web.ing.puc.cl/~dmery/Prints/ISI Journals/2006-FoodResInt-ColorMeasurementLab.pdf
[7] Trusell, H. J., Saber, E., &Vrhel, M. (2005). Color image processing.IEEE Signal Processing Magazine, 22(1), 14–22.
[8] G. Wyszecki and W.S. Stiles, ―Color science :
concepts and methods, quantitative data and
formulae‖. John Wiley and Sons, 2nd
edition, 2000.
[9] L. Jin and D. Li, ―A Switching vector median based on
the CIELAB color space for color image restoration‖, Signal Processing, Vol.87, pp.1345-1354, 2007.
[10] N. J. Kwak, D. J. Kwon, Y. G. Kim, and J. H. Ahn,
―Color image segmentation using edge and adaptive threshold value based on theimage characteristics‖,
Proc. International Symposium on Intelligent Signal Processing and Communication Systems (ISPACS), pp.255-258. 2004.
[11] Wang, Xiao-song; Huang,Xin-yuan and Fu,Hui‖The study of color free image segmentation‖, In: Second