Validity Index and number of clusters
Mohamed Fadhel SAAD1 and Adel M. ALIMI1 1
Research Group on Intelligent Machines, University of Sfax, ENIS Sfax, 3038, Sfax, Tunisia
.
Abstract
Clustering (or cluster analysis) has been used widely in pattern recognition, image processing, and data analysis. It aims to organize a collection of data items into c clusters, such that items within a cluster are more similar to each other than they are items in the other clusters. The number of clusters c is the most important parameter, in the sense that the remaining parameters have less influence on the resulting partition. To determine the best number of classes several methods were made, and are called validity index. This paper presents a new validity index for fuzzy clustering called a Modified Partition Coefficient And Exponential Separation (MPCAES) index. The efficiency of the proposed MPCAES index is compared with several popular validity indexes. More information about these indexes is acquired in series of numerical comparisons and also real data Iris.
Keywords: Fuzzy clustering, Fuzzy c-means, Validity index.
1. Introduction
Fuzzy classification algorithms require the user to predefine the number of clusters (c), but it is not always possible to know this number in advance. Since the scores obtained using the c-means family algorithms depend on the choice of c, it is necessary to validate each result of the partitions once they are found. This validation is performed by a specific algorithm that allows to assume the appropriate value of the number c. We call this algorithm "validity index of the classification". It evaluates each class and determines the optimal or valid partition. During the last years, it has been proposed many validity indexes. Most of them came from different studies on the number of classes. Among these indexes, there are two important types for c-means: one is based on the fuzzy partition of the dataset and the other is based on the geometric structure.
The main idea of the validity functions based on fuzzy partitioning: less fuzziness partitioning is more the performance is better. The representative functions for these are the coefficient of partitioning Vpc (Validity
partition coefficient) [1] and the entropy of partitions Vpe
(Validity partition entropy) [2]. Empirical studies [3] think that the maximum Vpc and minimum Vpe lead to a
correct interpretation of the samples considered. The best
performance is is achieved when the Vpc gets its
maximum
value or Vpe obtains its minimum.
Note that in some cases these functions validity cannot obtain their optimal values simultaneously. In the next sections, we detail the algorithms of the most recent validity index functions.
2. Presentation of validity index
Classification Validity Indexes (CVIs) have attracted the attention of researchers in order to validate the partition found by the c-means algorithm. The CVIs can signal the perfect input parameters with the best results by taking a minimum (or maximum). The quality of the result is incorporated in the number of classes and purity of each class. Purity is the sum of data objects in the majority class and this for each partition found. The number of classes is related to the purity of these classes. Thus, if the number of classes c is right, there is a high purity.
Several conventional CVIs have been developed with new instance types of intra-class and inter-class. However, the fundamentals for designing the CVIs were rarely defined in a clear manner.
2.1 Background
Historically, the classification validity indexes related to the c-means family algorithms have been proposed, first is the partitioning coefficient Vpc and entropy scores Vpe
developed by Bezdek, as described in previous section. The disadvantages of the coefficients Vpc and Vpe are the
lack of direct connection to the geometrical structure of data, and their tendency to decrease with the number c. Moreover, the main idea of the functions of validity is based on the geometry of objects, within the same class must be compact and in different classes should be separated. The coefficient of separation proposed by Gunderson in 1978 [4] was the first validity index that reflects explicitly the geometric properties of data.
proposed by Gath [6] and the function of Xie and Beni [7]. It is expected that the reduction of these functions at least, leads to good classification. Intuitively, the lack of clarity and compactness of a classification should decrease with increasing number of classes. For example, the partition entropy decreases to zero when c becomes very large and tends to the number of objects n. For this reason, the validity indices take as the maximum number of classes, the square root of the number of items: .
Once the partition is obtained by exact or fuzzy classification methods, the validity index can help determine the reliability of this partition for the data structure.
There may be mentioned the best-known index:
- Partition coefficient
(1) - Partition entropy
(2)
- Fukuyama Sugeno
(3)
- Partition coefficient
(4)
To find the optimal partition, we must maximize Vpc or minimize Vpe , Vfs ,Vxb .
Indices are classified into two types: addition and report type. The type is determined by how the intra-class and inter-class distance are coupled. Depending on the combination of these two distances, the results of indices validating classification carried out, are distinguished in connection with the domain structure of data having different aspects.
For several CVIs, the mean is a step of calculating intra-class distances. The average implies input values and gives a summary value on compactness. Therefore, this may mask the discriminatory ability of CVIs. Thus, the formulas introduced in the indices must use techniques that apply to all areas. We define for this aspect of fields of data such as compactness, separability, noise and overlap.
- The compactness: is a measure of the proximity of points vectors comprising the same class of its center.
-The separability: indicates how two classes are distinct
and isolated from one of other. The separation gives the distance between two different classes.
Most validation indices proposed in recent years, including the index of Xie and Beni [7] and Davies-Bouldin index [8], are
focused on two properties: compactness and separation. Thus, a smaller local value shows that each class is compact and great value in separation of the classes well separated.
- Thenoise: a noisy environment has points parasites that do not belong to any class of dataset. Most validity indices measure the degree of compactness and separation for the dataset and then find an optimal number of classes. If the dataset contains some noise points, then we can see that the validity indices take the noisy point in a compact and separated class from the rest of the classes. Thus, the noise aspect is crucial in the classification of data.
- Theoverlap: a measure indicating the degree to which two classes overlap and have similar feature vectors in common. This is defined between the fuzzy classes by calculating an overlap of inter-class. A better score is obtained at a minimal degree of overlap.
If a noise point is considered, a parasitic class well-identified in dataset. The found partition does not properly describe the data structure. Thus, the noise points that exist in different environments should not have enough good opportunities to be valid classes. The compactness is a measure of variation or dispersion of data in one class, and separation is an indicator of the isolation of classes from each other. A conventional approaches measuring compactness cannot clearly distinguish the different classes composing the dataset. In fact, compactness is a distance factor vector points in the center and degrees of membership of these items to class.
If the distance is great, the membership degree of point to the center is small (case of the first class (a) in Figure 1). Else, if the point is near the center , the distance between them is small and the membership degree is important (case of the first class (b) in Figure Fig. 1 ). Thus, the compactness values of the two classes are similar and do not reflect the geometry of the dataset. In addition, conventional measures of separation have limited ability to differentiate between geometric structures of the classes, because the calculation is based solely on information center and does not consider the overall shape of the classes as is shown schematically in Figure Fig. 2. In fact, there are two identical values of separation for pair of classes with different forms.
2.2 Validity indices based on the separation
between multiple objects in the same class, and a separation measure provides an evaluation of distances between the cluster centers when they are calculated relative to each other.
The Formula of SVI validity index is as follows: (5) The overall compactness of classification is the sum of all the compactness , where is the class index ( ).
The compactness of the class ci is given by:
(6)
The variance and the cardinality of the class are given respectively by:
(7)
(8) With is the membership degree of vector to the cluster and is the center of cluster .
The overall separation of c classes is given by the equation:
(9) is the deviation between the two centers and . Its value is determined by the exponent of the weight vectors centers . defines the fuzziness of the separation part:
(10) is the transposed matrix vector centers and the vector , that is the average of c centers.
is the membership degree of to the center , its formula is:
(11) The index consists of a part of overall compactness and a fuzzy separation measure combining information on the data and the adhesion function. The overall compactness describes changes in class looking at the overall distribution of classes. The separation is based on the deviation between pairs of fuzzy centers. The performance of the index was examined by taking into account the two design parameters, namely the exponent of the fuzzy exponent m and the weight of the fuzzy separation .
2.3 Partition coefficient and exponential separation
Proposed by Yang and Lung [10], this index detects a noise points in the dataset and eliminates a parasites. This index is type summation, while the remaining indices are of the type report.
This algorithm has a validity index for fuzzy clustering called Partition Coefficient And Exponential Separation (PCAES), It uses the factors of a normal class coefficient and exponential separation measure for each classification, and then combines these two factors to create the index PCAES. A consideration involving measures of compactness and separation for each classification provides various merits of validity of classes. Unlike other indices, the measure of validity given in PCAES can give another point of view in a noisy environment. For each class, we can measure the potential for it to be identified. Under this coefficient, a noisy point not offers enough opportunities to be an interesting class.
PCAES find an optimal evaluation of the number of classes, and provides more information about the data structure in a noise environment. PCAES formula is:
(12) is the index of class i, its formula is:
(13)
with is measurement of relative compactness of the class i compared to the most compact class that having value .
is a compactness value of the most
compact class,
T
2
i
}
{
min
exp
a
a
k
is the separationmeasure of the class i with respect to
T,
T
=c v v
c
l l
1 2
is the total average measurement of the separation of c classes.
With the compactness and separation for each class, the value PCAESi is calculated, which is the validity index of
class i. The PCAESi could detect each class with two
measures: a normal class coefficient and exponential separation. The great value of PCAESi means that class i is
internally compact and separate from others (c - 1) groups. The small value of PCAESi indicates that the class i is not
a identified cluster. The validity index of PCAES(c) is defined by summing all PCAESi to measure the
compactness and separation of the data structure, as:
(14)
The great value of PCAES(c) means that each of these classes is compact and separate from other classes. The small value means that some of these classes are not compact or separated from other groups. Moreover, the maximum PCAES(c), regarding c, could be used to detect the data structure with a compact class and well separated classes.
3. New Index
Fuzzy validity indices are more used than exact index, as their application in the exact domains is possible the same level as in the fuzzy domains. In fact, applied to FCM, the fuzzy indices imply the membership degrees of points to classes of the partition found, and considering 0 or 1. In contrast to other indices, the measure of validity proposed in PCAES can give a different view in a noisy environment. For each class, we can measure the potential for it to be identified. So using this index to determine the number of class, we developed a new version of a validity index named: Modified Partition Coefficient And Exponential Separation.
According to Xie and Beni [7], fuzzy compactness is given by the distance between the points with membership degree and the center . Also, according to Fukuyama-Sugeno [5] separation is of the form:
(15) So the new formula is
(16) The compactness value is :
(17)
The separation value is :
(18)
The most compact class is the class that has the minimum compactness, it formula is
:
(19) The maximum separation is the following:
(20) This fuzzy form will be used to apply in FCM algorithm by integrating the membership matrix U. We proceed testing MPCAES, and this by applying the FCM algorithm to the domain of data chosen for different values of c. In the experimental study of the next section, we provide an analysis of indices of validity resulting from the theoretical study of their implementation in the fuzzy and exact domains, and their application to FCM and HCM algorithms.
4. Some results
In this section, we evaluate the performance of studied validity indices, not only for the purpose of determining the optimal number of classes, but also to validate the structure of domains with different aspects: noise and overlapping.
Example 1: We will start with a two-dimensional synthetic base in Figure 2. The base is composed of three well-identified classes (optimal c = 3), it is used to verify the proper functioning of CVIs in a clean environment. According to Figure 2, PCAES gave as optimal number of Class 5 and MPCAES gave 3 as the optimal number of class. So our index has determined the exact value of the number of classes.
Example 2: The experiments are applied to the indices already described in the theoretical study:
- PCAES: evaluates the noise aspect, and gets its optimum at the maximum value for different numbers of classes. - SVI and XBI: promote measures of compactness and separation. These indices lead to optimal partitions to their minimum values.
We considered, to better test the noise aspect, the base shown in Figure 3, dataset on three well-identified classes without parasites points (a). We subsequently introduced at two levels noisy points: noise Level 1 (b) and noise level 2 (c).
with noise points around these classes; it is shown in Figure 5.
Fig. 1 Two fuzzy classes with similar values of compactness.
Fig. 2 Dataset two-dimensional synthetic with 30 points.
Fig. 3 Dataset base3 two-dimensional synthetic with 3classes: no-noisy base (a) noisy base level1 (b) noisy base level2 (c).
In the first level of noise introduced into the base3 in Figure 3.(b), the performance of PCAES and MPCAES is present to remove the noise points and consider only three optimal classes. SVI and XBI indices give 4 and 5 classes for optimal partitions, ignoring the noise present in the domain. In an interpretation of aspect of noise level 2 in Figure 3.(c), single index PCAES and MPCAES have kept the optimal partition composed of three classes: optimal c = 3, other indices have classified groups of parasitic points as valid classes (optimal c is 4 to 7).
For data containing points of overlap level 1 and 2, shown in Figure 4., PCAES can provide a satisfactory result, but MPCAES gives better result, and this because of the
integration of degrees of membership in the compactness and separation. Other values indices found at take their minimum c = 2, which shows the limit in the existence of inter-class overlap in the data environment.
Fig. 4 Dataset base3, two-dimensional synthetic with 3 classes: overlapped base level 1 (a), overlapped base level 2 (b).
Fig. 5 Dataset base3, two-dimensional synthetic with 3 classes: overlapped base level 2(a), overlapped and noisy base level 2 (b).
We used the base3 by touching a degree of overlap between classes combined with parasites points around these classes; it is shown in Figure 5.6. A first observation on the behavior of indices resides in its failure to reach their optimum at c = 3.
We used the real base IRIS, also the MPCAES index opted for the best score by solving satisfactorily the problems of classification. The results of MPCAES index proposed in a number of domains have proven effective in noisy and overlap environments. However, all the indices presented in this study depend on the results of the FCM algorithm.
5. Conclusions
widely used data sets. These results prove that our new index (MPCAES) provides the majority of cases the value of the desired classes.
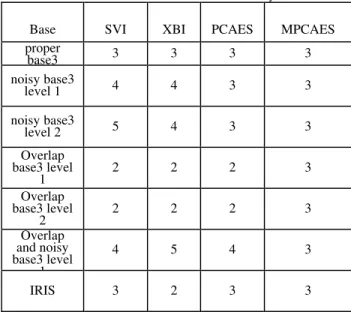
Table 1: Number of classes found with the fuzzy indices
Base SVI XBI PCAES MPCAES
proper
base3 3 3 3 3
noisy base3
level 1 4 4 3 3
noisy base3
level 2 5 4 3 3
Overlap base3 level
1 2 2 2 3
Overlap base3 level
2 2 2 2 3
Overlap and noisy base3 level
1
4 5 4 3
IRIS 3 2 3 3
References
[1] J. C. Bezdek, "Cluster Validity with fuzzy sets", J. Cybernetics, Vol.3,1974, pp. 58-73.
[2] J. C. Bezdek and J. C. Dunn, "Optimal fuzzy partitions: A heuristic for estimating the parameters in a mixture of normal distributions", IEEE Transactions on Computers, Vol. 24, No. 8, 1975, pp. 835-838.
[3] J. C. Bezdek and P.F. Castelaz, "Prototype Classification and Feature Selection With Fuzzy Sets", IEEE Transactions Syst Man Cybern, VOL. 2,1997, pp. 87-92.
[4] R. Gunderson, "Applications of fuzzy ISODATA algorithms to startracker printing systems", Triannual world IFAC, 1978. [5] Y. Fukyama and T. Sugeno, "A new method of choosing the number of clusters for the fuzzy c-means method”, in Proceedings of 5th Fuzzy System Symposium,1989, pp. 247-250.
[6] I. Gath and A. B. Geva, "Unsupervised Optimal Fuzzy Clustering", IEEE Trans. Pattern Anal. Machine Intell., Vol. 7, 1989, pp. 773-781
.
[7] L. Xie and G. Beni, "A validity measure for fuzzy clustering, IEEE Trans PAMI, Vol. 13, No 8, 1991, pp. 841-847. [8] D. L. Davies and D. W. Bouldin, "A Cluster Separation
Measure", IEEE Transactions on Pattern Analysis and Machine Intelligence, Vol. 1, No 2, 1979, pp. 224-227. [9] G. E. Tsekouras and H. Sarimveis, "A new approach for
measuring the validity of the fuzzy c-means algorithm", Advances in Engineering Software, Vol. 35, 2004, pp. 567-575.
[10] K. Lung and M. S. Yang. "A cluster validity index for fuzzy clustering", Pattern Recognition Letters, Vol. 26, No 9, 2005, pp. 1275-1291.
[11] D.W. Kim, K. H. Lee and D. Lee. "On cluster validity index for estimation of the optimal number of fuzzy clusters", Pattern Recognition, Vol.37 No. 10, 2004, pp. 2009-2025.
Mohamed Fadhel SAAD is currently a research staff member at Research Group on Intelligent Machines (REGIM). He is a Master Technologist to Higher Institute of Technological Studies of Gafsa. He received the Aggregation Specialty: Applied data processing to the management September 2000. In 2003 he started his Ph.D. studies at ENIS, University of Sfax, Tunisia. His main research interests are clustering, pattern recognition and fuzzy logics. He is a student member of the Institute of Electrical and Electronics Engineers (IEEE).