Prostate Cancer Risk Calculator: Development,
Validation, and Comparative Analysis with Two Western
Risk Calculators in Korean Men
Chang Wook Jeong1,2, Sangchul Lee1,2, Jin-Woo Jung1, Byung Ki Lee1, Seong Jin Jeong1,2, Sung Kyu Hong1,2, Seok-Soo Byun1,2, Sang Eun Lee1,2*
1Department of Urology, Seoul National University Bundang Hospital, Seongnam, Korea,2Department of Urology, College of Medicine, Seoul National University, Seoul, Korea
Abstract
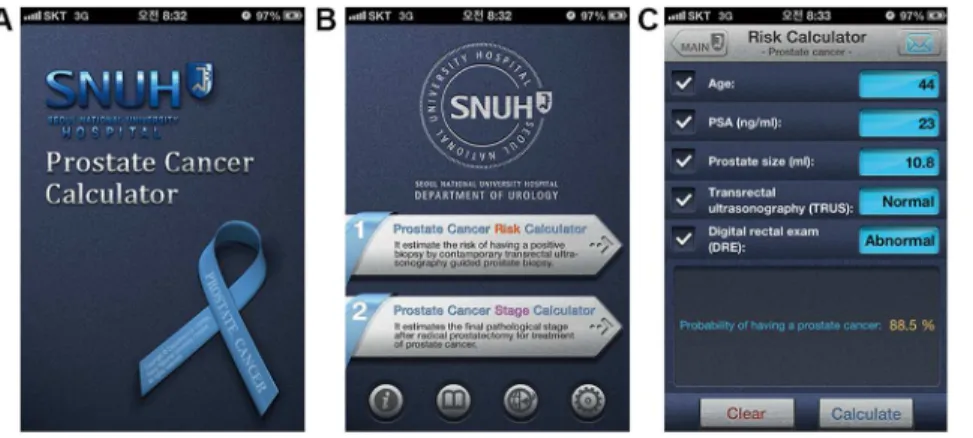
Objectives:We developed a mobile application-based Seoul National University Prostate Cancer Risk Calculator (SNUPC-RC) that predicts the probability of prostate cancer (PC) at the initial prostate biopsy in a Korean cohort. Additionally, the application was validated and subjected to head-to-head comparisons with internet-based Western risk calculators in a validation cohort. Here, we describe its development and validation.
Patients and Methods:As a retrospective study, consecutive men who underwent initial prostate biopsy with more than 12 cores at a tertiary center were included. In the development stage, 3,482 cases from May 2003 through November 2010 were analyzed. Clinical variables were evaluated, and the final prediction model was developed using the logistic regression model. In the validation stage, 1,112 cases from December 2010 through June 2012 were used. SNUPC-RC was compared with the European Randomized Study of Screening for PC Risk Calculator (ERSPC-RC) and the Prostate Cancer Prevention Trial Risk Calculator (PCPT-RC). The predictive accuracy was assessed using the area under the receiver operating characteristic curve (AUC). The clinical value was evaluated using decision curve analysis.
Results:PC was diagnosed in 1,240 (35.6%) and 417 (37.5%) men in the development and validation cohorts, respectively. Age, prostate-specific antigen level, prostate size, and abnormality on digital rectal examination or transrectal ultrasonography were significant factors of PC and were included in the final model. The predictive accuracy in the development cohort was 0.786. In the validation cohort, AUC was significantly higher for the SNUPC-RC (0.811) than for ERSPC-RC (0.768, p,0.001) and PCPT-RC (0.704, p,0.001). Decision curve analysis also showed higher net benefits with SNUPC-RC than with the other calculators.
Conclusions:SNUPC-RC has a higher predictive accuracy and clinical benefit than Western risk calculators. Furthermore, it is easy to use because it is available as a mobile application for smart devices.
Citation:Jeong CW, Lee S, Jung J-W, Lee BK, Jeong SJ, et al. (2014) Mobile Application-Based Seoul National University Prostate Cancer Risk Calculator: Development, Validation, and Comparative Analysis with Two Western Risk Calculators in Korean Men. PLoS ONE 9(4): e94441. doi:10.1371/journal.pone.0094441
Editor:Adriano Angelucci, University of L’Aquila, Italy
ReceivedOctober 3, 2013;AcceptedMarch 17, 2014;PublishedApril 7, 2014
Copyright:ß2014 Jeong et al. This is an open-access article distributed under the terms of the Creative Commons Attribution License, which permits
unrestricted use, distribution, and reproduction in any medium, provided the original author and source are credited.
Funding:The authors have no support or funding to report.
Competing Interests:The authors have declared that no competing interests exist.
* E-mail: [email protected]
Introduction
Prostate cancer (PC) is the second most common cancer and is associated with the sixth highest cancer-related mortality in men worldwide [1]. Incidence rates of PC have increased in most countries, except in a few developed Western countries. There is a clear trend of rapidly increasing PC incidence in Asian countries, including South Korea [2,3]. Thus, proper diagnosis of PC is a major problem in Asian countries. However, the use of transrectal ultrasonography (TRUS)-guided prostate needle biopsy (TRUS-Bx) to diagnose PC is accompanied by significant morbidity and mortality and is a considerable socio-economic burden [4]. For
these reasons, the decision of whether to conduct a biopsy is of the utmost importance in actual practice [5].
the initial biopsy in Korean men. We then converted this nomogram into a mobile application, ‘‘Seoul National University Prostate Cancer Risk Calculator (SNUPC-RC)’’ in 2013. It has now been incorporated into the application, ‘‘Seoul National University Prostate Cancer Calculator’’ (Fig. 1). It can be operated either in Android or in iOS and is freely available on Google play store and the Apple App store. It was additionally validated in a recent cohort of our institution and was subjected to head-to-head comparisons with the representative internet web-based Western risk calculators which were developed in Western population. The compared risk calculators were the European Randomized Study of Screening for PC Risk Calculator (ERSPC-RC) and the Prostate Cancer Prevention Trial Risk Calculator (PCPT-RC) [11,12]. Here, we describe its development and validation.
Materials and Methods
Ethics statement
The Institutional Review Board of Seoul National University Bundang Hospital (Seongnam, Republic of Korea) approved this study (approval number: B-1309/220-103). The need for informed consent from patients was waived by the Institutional Review Board because this was a retrospective analysis.
Patient population and TRUS-Bx
This is a retrospective study which used the data collected from 5,278 consecutive patients who underwent TRUS-Bx at a tertiary referral center in South Korea. The study was conducted in 2 stages, with a time interval of 2 years. In the development stage, 3,924 cases from May 2003 through November 2010 were included. In the validation stage, 1,354 cases from December 2010 through June 2012 were included. We selected only men who underwent an initial biopsy in their life. The exclusion criteria were age less than 40 years, prostate-specific antigen (PSA) level more than 100 ng/ml, cases with missing data, and a biopsy core number of less than 12.
We only evaluated the contemporary systematic 12-core plus additional target TRUS-Bx, because this is regarded as the best practice and is widely accepted [15]. This biopsy scheme allows for maximal cancer detection and avoids repeat biopsy with adequate information. In our center, 2 experienced uroradiologists consis-tently performed TRUS-Bx with the systematic 12-core scheme using an 18-gauge needle. If TRUS indicated a suspicious lesion, 1 or 2 additional target biopsies per lesion were obtained. The
prostate size was estimated using the prolate elliptical formula (height6width6length6p/6) in TRUS images [16]. Biopsy
specimens were also consistently processed and examined by a single experienced uropathologist. Specimen examination and reporting were performed according to up-to-date consensuses and recommendations [17,18].
Development of the Seoul National University Prostate Cancer Risk Calculator
We performed the developmental study in 2011 using the aforementioned patient population. Of 3,924 cases reviewed, 3,638 men underwent an initial biopsy. Cases with an age less than 40 years (N = 62), PSA level more than 100 ng/ml (N = 72), biopsy core number less than 12 (N = 19), or missing data (N = 3) were excluded; thus, the ‘‘development cohort’’ consisted of 3,482 men. Patients’ age, PSA level, prostate size, palpable nodule by digital rectal examination (DRE), and suspicious lesions on TRUS were evaluated by logistic regression analyses [11,19,20]. In all analyses and models, the PSA level and prostate size were normalized by log-transformation. Significant variables detected by univariate analysis (p-value of,0.05) were included in the final multivariate model. The nomogram predicting the probability of PC was developed using this final multivariate logistic regression model. The predictive accuracy of this nomogram was evaluated by the area under the receiver operating characteristic curve (AUC). The agreement between the predicted probability and the actual outcome was evaluated by calibration plotting using 200 boot-strapping. In 2013, we converted this nomogram into a mobile application, ‘‘SNUPC-RC,’’ for iOS and Android systems, to improve usability.
Validation and head-to-head comparison with ERSPC-RC and PCPT-RC
We conducted the validation study in 2013. Of 1,354 selected men, 1,161 underwent an initial biopsy. Cases with an age less than 40 years (N = 17), PSA level more than 100 ng/ml (N = 25), biopsy core number less than 12 (N = 2), or missing data (N = 2) were excluded, and 1,112 cases were finally analyzed as the ‘‘validation cohort.’’
Head-to-head comparisons of SNUPC-RC with ERSPC-RC and PCPT-RC were conducted using the validation cohort. The individual probability of harboring PC was automatically calcu-lated using the probability function of the model with the blinded
data. The logit of ERSPC-RC is calculated as22+1.16log2(PSA– 2)21.36log2 (prostate size–5.4)+0.86DRE+0.96TRUS [11]. An abnormal DRE was assigned a value of 1, and an abnormal TRUS was assigned a value of 1; they were otherwise assigned a value of 0. The logit of PCPT-RC was calculated as 21.80+0.856log10 (PSA)+0.276family history+0.916DRE20.456prior biopsy [12]. If there was a family history of PC or the DRE or prior biopsy was positive, the value of these parameters was 1, and otherwise, the value was 0. The probability function was calculated as exp (logit) / (1+ exp [logit]). The predictive accuracies measured by AUCs were compared using the DeLong method [21]. As a sub-population analysis, AUCs were also compared among an age group of 55–69 years (N = 553), because PSA screening is strongly recommended in this age group [22]. To test the clinical value of the predictive models, decision curve analyses (DCA) were conducted. The DCA visualizes the potential net benefit of the model at each threshold probability using a graph [23,24].
The threshold probability of SNUPC-RC could be determined by each user. The diagnostic performances of SNUPC-RC with an exemplary threshold probability of 30% and a traditional PSA cut-off,.4 ng/ml were compared to demonstrate how many patients could avoid unnecessary TRUS-Bx [20,25]. The diagnostic
performances of ERSPC-RC and PCPT-RC were additionally calculated with the same threshold probability of 30%.
All statistical analyses were performed using R for Windows, version 3.0.1 (http://www.r-progect.org/), except the DeLong test. The DeLong test was performed using MedCalc, version 12.7.1.0 (MedCalc Software, Ostend, Belgium). A 2-sided p-value of,0.05 was considered statistically significant.
Results
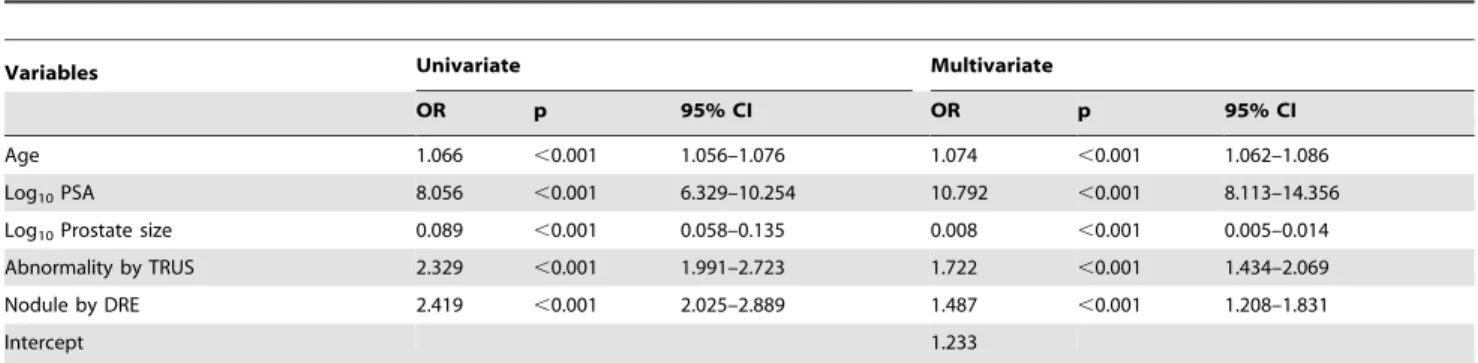
The basic characteristics of the development and validation cohorts are summarized in Table 1. All evaluated variables were significantly associated with detection of PC in univariate as well as multivariate logistic regression analyses (Table 2). A graphical nomogram predicting the probability of PC in Korean men was constructed based on the final multivariate logistic regression model (Fig. 2). The predictive accuracy of this nomogram was 0.786 (95% CI, 0.779–0.802) calculated by AUC. The calibration plot demonstrated an almost perfect agreement between the predicted probability and the observed outcome fitted to the ideal line (mean absolute error 0.011) (Fig. 3).
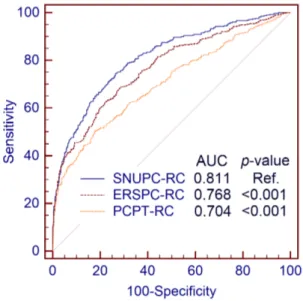
In the validation cohort, the predictive accuracy of SNUPC-RC (AUC: 0.811; 95% CI, 0.786–0.833) was significantly higher than that of ERSPC-RC (AUC: 0.768; 95% CI, 0.742–0.792; p,0.001) and PCPT-RC (AUC: 0.704; 95% CI, 0.676–0.731; p,0.001) (Fig. 4). The clinical value of SNUPC-RC was also higher than that of ERSPC-RC and PCPT-RC (Fig. 5). SNUPC-RC had a higher net benefit than the other tools for almost all threshold probabilities (e.g. 0%–65%). Among an age group of 55–69 year, the predictive accuracy of SNUPC-RC (AUC: 0.785; 95% CI, 0.748–0.818) was also statistically higher than that of ERSPC-RC (AUC: 0.764; 95% CI, 0.726–0.799; p = 0.025) and PCPT-RC (AUC: 0.668; 95% CI, 0.627–0.707; p,0.001).
When using 4 ng/ml as the cut-off level of PSA, the sensitivity, specificity, positive predictive value, and negative predictive value were 86.8%, 26.9%, 41.6%, and 77.3%, respectively. If we set the threshold probability of SNUPC-RC as 30%, they were 76.3%, 61.3%, 56.3%, and 85.7%, respectively. By use of SNUPC-RC, an additional 239 men (21.5%) who did not have PC could avoid TRUS-Bx, whereas the number of undetected PC cases was only 16 (1.4%) when comparing PSA level of.4 ng/ml.
With the same threshold probability of 30%, the sensitivity, specificity, positive predictive value, and negative predictive value of ERSPC-RC were 71.7%, 64.8%, 55.0%, and 79.2%, respec-tively. PCPT-RC had 97.6%, 6.04%, 38.4%, and 80.8% in the same order.
Table 1.The basic characteristics of the development and validation cohorts.
Development cohort Validation cohort
Patients (n) 3,482 1,112
Age (years) (mean6SD) 65.068.5 65.868.8
PSA (ng/ml) (mean6SD) 9.8611.5 10.7613.0
Prostate size (ml) (mean6SD) 46.6623.2 42.1619.9
Nodule by DRE (n) (%) 608 (17.5) 143 (12.8)
Abnormality by TRUS (n) (%) 875 (25.1) 216 (19.4)
Biopsy core number (n) (%)
12 2,251 (64.6) 912 (82.0)
13 617 (17.7) 181 (16.3)
14 353 (10.1) 17 (1.5)
.14 261 (7.5) 2 (0.2)
Cancer detection (n) (%) 1,240 (35.6) 417 (37.5)
DRE: digital rectal examination, SD: standard deviation, TRUS: transrectal ultrasonography.
doi:10.1371/journal.pone.0094441.t001
Table 2.Univariate logistic regression analyses and the final multivariate logistic regression model in the development cohort.
Variables Univariate Multivariate
OR p 95% CI OR p 95% CI
Age 1.066 ,0.001 1.056–1.076 1.074 ,0.001 1.062–1.086
Log10PSA 8.056 ,0.001 6.329–10.254 10.792 ,0.001 8.113–14.356
Log10Prostate size 0.089 ,0.001 0.058–0.135 0.008 ,0.001 0.005–0.014
Abnormality by TRUS 2.329 ,0.001 1.991–2.723 1.722 ,0.001 1.434–2.069
Nodule by DRE 2.419 ,0.001 2.025–2.889 1.487 ,0.001 1.208–1.831
Intercept 1.233
Discussion
PSA is an outstanding tumor marker among those for all malignancies. The PSA level is associated with the probability of PC diagnosis, prognosis, and treatment response [26]. To date, PSA represents the best surrogate marker for PC. Since the clinical application of PSA testing in the 1980s, the proportion of loco-regional PC has increased, whereas the incidence of metastatic
disease has decreased [27]. This stage migration has also resulted in improvements in PC-specific survival over the past decades [1,28]. Even though PSA is a good diagnostic marker for PC, the optimal cut-off value has not yet been established [20,26,29,30]. This is due to suboptimal diagnostic performance. The positive predictive value of the PSA-based diagnosis in contemporary series
Fig. 2. Seoul National University prostate cancer risk nomogram for prostate cancer probability prediction in Korean men. doi:10.1371/journal.pone.0094441.g002
Fig. 3. Calibration plot of the developed risk model. doi:10.1371/journal.pone.0094441.g003
Fig. 4. The receiver operating characteristic curves for the different calculators evaluated.Seoul National University prostate cancer risk calculator, European Randomized Study of Screening for Prostate Cancer Risk Calculator, and Prostate Cancer Prevention Trial Risk Calculator Were compared using the DeLong method.
is only 20–30% [20,26,29]. This means that approximately three-quarters of men undergo unnecessary TRUS-Bx, resulting in considerable social healthcare expenditure and unnecessary morbidity [4,5]. In particular, increasing bacterial resistance to prophylaxis has resulted in substantial increases in the incidence of urinary tract infection and urosepsis [4,31,32]. In this situation, the best strategy might be simply limiting unnecessary TRUS-Bx, and when undergoing TRUS-Bx, the contemporary systematic 12-core biopsy method should be used to fully evaluate the risk of PC [5]. Therefore, we need a more comprehensive prediction model incorporating not only the PSA level but also other clinical parameters in the setting of the systematic 12-core TRUS-Bx. Then we can provide more precise data to assist in the process of tailored, shared decision-making with patients.
Many predictive models to diagnosis PC at initial biopsy have been made mostly with Western data [6,8,11,12]. Even though these predictive tools have been validated in the Western population, their extrapolation to Asian, or more specifically to Korean patients should be done with caution [13,14]. The predictive accuracies of ERSPC-RC and PCPT-RC in their original cohorts were 0.79 and 0.70, respectively. When applying these 2 risk calculators to the validation cohort consisting of Korean men, the accuracies were 0.768 and 0.704, respectively. In contrast, SNUPC-RC statistically outperformed ERSPC-RC and PCPT-RC with an accuracy of 0.811. The DCA also indicated a higher clinical benefit with SNUPC-RC than with ERSPC-RC and PCPT-RC. In the sub-population analysis among an age group of 55–69 years, AUC of SNUPC-RC was also statistically higher than those of ERSPC-RC and PCPT-RC. We selected this age group as this has shown the most benefit for PSA screening in the ERSPC trial [33]. The outperformance of SNUPC-RC may be caused by the different characteristics of the population and different practice patterns. The PSA screening rate in Korea is still lower than that in Western countries [2]. Furthermore, healthy Korean men have lower normal levels of PSA than their
age-matched Western counterparts [34]. Another explanation is the difference in biopsy core number. In our cohort, we sampled 12 or more cores, whereas the ERSPC-RC and PCPT-RC are based on 6-core biopsies. Thus, the detection rates of these 2 Western series might be suboptimal. The variables in each risk calculator were somewhat different. We did not incorporate family history, because the incidence rate had been very low in Korea. We also left prior biopsy history out of SNUPC-RC, because the purpose of SNUPC-RC is to calculate the probability being diagnosed as PC by the initial biopsy not by repeat biopsy. In the context of clinical application, applying SNUPC-RC with a threshold probability of 30%, we could avoid unnecessary TRUS-Bx in approximately 20% of patients compared with PSA detection only. The diagnostic performance of SNUPC-RC was better than those of ERSPC-RC and PCPT with the same threshold probability of 30%. It could vary depending on the cut-off probability and shared decision-making process, we could always evade lots of unnecessary TRUS-Bx in reasonable range of threshold probability. We expect that we can provide better predictions and personalized shared decision-making for Korean men using SNUPC-RC. We will also be able to avoid unnecessary TRUS-Bx and reduce the socio-economic cost. Furthermore, SNUPC-RC has the potential to be used for other Asian populations after validation with their cohorts.
There were 1 Japanese nomogram and 1 Korean internet web-based risk calculator to predict the probability of PC in the Asian population; however, the numbers of biopsy cores used in developing these tools were 8 and 10, respectively. [35]. Western predictive tools are also seldom based on the contemporary 12-core biopsy [8,11,12], and their maximum 12-core number was 10 [6]. However, a 12-core systematic biopsy incorporating apical and far lateral cores in the template distribution is strongly recommended. This biopsy methodology has been proven to result in maximal cancer detection, to eliminate the need for repeat biopsies, and to provide adequate information for developing a treatment plan [15]. Thus, previous predictive tools based on sampling of 6 to 10 cores might be too outdated to apply to present practice. It is worth mentioning that SNUPC-RC was developed by only incorporating men who had undergone a contemporary systematic 12-core TRUS-Bx. Therefore, SNUPC-RC can be used in contemporary practice.
Currently used clinical decision aids are risk groupings, decision trees, probability look-up tables, classification and regression trees, artificial neural networks, and nomograms. Among these, the nomogram is an excellent risk evaluation tool and has the highest discriminating power [13]. Visualization of the effect size of predictors to the risk might be an advantage of the nomogram. However, this requires a printout or screen shot of the nomogram. Furthermore, the exact number cannot be read from a nomogram. In comparison, internet web-based risk estimation tools provide exact probability and an easy user experience [14]. However, they require access to a device, such as a personal computer, with an internet connection, web browser, and hyperlink or typing of internet address. A mobile application-based risk assessment tool, such as SNUPC-RC, will be an alternative, because smart mobile devices are now being increasingly used. SNUPC-RC is freely available, and it can be used without internet access once downloaded. It is virtually ready to use anytime, anywhere once you downloaded it to your smart phone. You can counsel your patients even at bedside with your mobile smart devices. It is very user-friendly and provides enhanced smart functions. One example is that you can directly send and share the calculated results through an e-mail. To our knowledge, this is the first report
regarding a mobile application-based cancer risk prediction tool in health care practice.
This study has many advantages. The risk model was developed and validated using large-scale cohorts that underwent the contemporary 12-core biopsy scheme, reflecting the current standard of care. Since the risk model was based on general clinical information, it could have a lower level of complexity. This report describes not only the development of SNUPC-RC, but also its additional validation and head-to-head comparison with Western internet web-based risk calculators over a long period. Clinical practice, TRUS-Bx, and pathologic examinations were consistently performed by experienced personnel according to up-to-date standards and recommendations. Furthermore, statistical analyses were performed at a high technical standard and were described in sufficient detail. We included the latest analytical techniques, such as DCA. We also adhered to standard guidelines in analyses and reporting of this field [36–38]. The current study also has several limitations. It depended on a retrospective methodological approach. Since our institution is a referral tertiary center, to use SNUPC-RC in a primary practice setting, it should be further validated in a primary practice cohort. Although SNUPC-RC better predicts the probability of PC, it does not establish the optimal cut-off level. Furthermore, it does
not discern between clinically significant and insignificant PC. Finally, the real clinical impact after application of SNUPC-RC should be further evaluated over a long period.
In summary, this is the first report describing smart mobile based decision aids in cancer care. This application-based SNUPC-RC has a higher predictive accuracy than ERSPC-RC and PCPT-ERSPC-RC for estimating the risk of PC in the Korean population. Furthermore, SNUPC-RC has a higher clinical value than these 2 risk calculators. When using SNUPC-RC, a significant proportion of Korean men can avoid unnecessary TRUS-Bx, with only a small portion of undetected PC cases. It will provide clinically meaningful data for physicians and Korean patients during personalized shared decision-making for TRUS-Bx. When validated in other Asian countries, SNUPC-RC may also have the potential to be used for other Asian populations.
Author Contributions
Conceived and designed the experiments: CWJ SEL. Performed the experiments: CWJ SL JWJ BKL. Analyzed the data: CWJ SJJ SKH SSB SEL. Contributed reagents/materials/analysis tools: SL JWJ BKL SJJ SKH SSB. Wrote the paper: CWJ. Critical revision of the manuscript for important intellectual content: SL JWJ BKL SJJ SKH SSB SEL.
References
1. Center MM, Jemal A, Lortet-Tieulent J, Ward E, Ferlay J, et al. (2012) International variation in prostate cancer incidence and mortality rates. Eur Urol 61: 1079–1092.
2. Cullen J, Elsamanoudi S, Brassell SA, Chen Y, Colombo M, et al. (2012) The burden of prostate cancer in Asian nations. J Carcinog 11: 7.
3. Jung KW, Won YJ, Kong HJ, Oh CM, Seo HG, et al. (2013) Cancer statistics in Korea: incidence, mortality, survival and prevalence in 2010. Cancer Res Treat 45: 1–14.
4. Batura D, Gopal Rao G (2013) The national burden of infections after prostate biopsy in England and Wales: a wake-up call for better prevention. J Antimicrob Chemother 68: 247–249.
5. Kibel AS (2013) To biopsy or not to biopsy: minimizing the risk of prostate needle biopsy. J Urol 189: 796–797.
6. Chun FK, Briganti A, Graefen M, Montorsi F, Porter C, et al. (2007) Development and external validation of an extended 10-core biopsy nomogram. Eur Urol 52: 436–444.
7. Chun FK, Briganti A, Graefen M, Porter C, Montorsi F, et al. (2007) Development and external validation of an extended repeat biopsy nomogram. J Urol 177: 510–515.
8. Karakiewicz PI, Benayoun S, Kattan MW, Perrotte P, Valiquette L, et al. (2005) Development and validation of a nomogram predicting the outcome of prostate biopsy based on patient age, digital rectal examination and serum prostate specific antigen. J Urol 173: 1930–1934.
9. Walz J, Graefen M, Chun FK, Erbersdobler A, Haese A, et al. (2006) High incidence of prostate cancer detected by saturation biopsy after previous negative biopsy series. Eur Urol 50: 498–505.
10. Yanke BV, Carver BS, Bianco FJ Jr, Simoneaux WJ, Venable DD, et al. (2006) African-American race is a predictor of prostate cancer detection: incorporation into a pre-biopsy nomogram. BJU Int 98: 783–787.
11. Kranse R, Roobol M, Schroder FH (2008) A graphical device to represent the outcomes of a logistic regression analysis. Prostate 68: 1674–1680.
12. Thompson IM, Ankerst DP, Chi C, Goodman PJ, Tangen CM, et al. (2006) Assessing prostate cancer risk: results from the Prostate Cancer Prevention Trial. J Natl Cancer Inst 98: 529–534.
13. Shariat SF, Karakiewicz PI, Suardi N, Kattan MW (2008) Comparison of nomograms with other methods for predicting outcomes in prostate cancer: a critical analysis of the literature. Clin Cancer Res 14: 4400–4407.
14. Yoon DK, Park JY, Yoon S, Park MS, Moon du G, et al. (2012) Can the prostate risk calculator based on Western population be applied to Asian population? Prostate 72: 721–729.
15. Bjurlin MA, Carter HB, Schellhammer P, Cookson MS, Gomella LG, et al. (2013) Optimization of initial prostate biopsy in clinical practice: sampling, labeling and specimen processing. J Urol 189: 2039–2046.
16. Jeong CW, Park HK, Hong SK, Byun SS, Lee HJ, et al. (2008) Comparison of prostate volume measured by transrectal ultrasonography and MRI with the actual prostate volume measured after radical prostatectomy. Urol Int 81: 179– 185.
17. Fine SW, Amin MB, Berney DM, Bjartell A, Egevad L, et al. (2012) A contemporary update on pathology reporting for prostate cancer: biopsy and radical prostatectomy specimens. Eur Urol 62: 20–39.
18. Epstein JI, Allsbrook WC Jr, Amin MB, Egevad LL, Committee IG (2005) The 2005 International Society of Urological Pathology (ISUP) Consensus Conference on Gleason Grading of Prostatic Carcinoma. Am J Surg Pathol 29: 1228–1242.
19. Porter CR, Gamito EJ, Crawford ED, Bartsch G, Presti JC Jr, et al. (2005) Model to predict prostate biopsy outcome in large screening population with independent validation in referral setting. Urology 65: 937–941.
20. Roobol MJ, Carlsson SV (2013) Risk stratification in prostate cancer screening. Nat Rev Urol 10: 38–48.
21. DeLong ER, DeLong DM, Clarke-Pearson DL (1988) Comparing the areas under two or more correlated receiver operating characteristic curves: a nonparametric approach. Biometrics 44: 837–845.
22. Carter HB, Albertsen PC, Barry MJ, Etzioni R, Freedland SJ, et al. (2013) Early detection of prostate cancer: AUA Guideline. J Urol 190: 419–426. 23. Steyerberg EW, Vickers AJ (2008) Decision curve analysis: a discussion. Med
Decis Making 28: 146–149.
24. Vickers AJ, Elkin EB (2006) Decision curve analysis: a novel method for evaluating prediction models. Med Decis Making 26: 565–574.
25. Catalona WJ, Smith DS, Ratliff TL, Dodds KM, Coplen DE, et al. (1991) Measurement of prostate-specific antigen in serum as a screening test for prostate cancer. N Engl J Med 324: 1156–1161.
26. Greene KL, Albertsen PC, Babaian RJ, Carter HB, Gann PH, et al. (2013) Prostate specific antigen best practice statement: 2009 update. J Urol 189: S2– S11.
27. Falzarano SM, Magi-Galluzzi C (2011) Prostate cancer staging and grading at radical prostatectomy over time. Adv Anat Pathol 18: 159–164.
28. Siegel R, DeSantis C, Virgo K, Stein K, Mariotto A, et al. (2012) Cancer treatment and survivorship statistics, 2012. CA Cancer J Clin 62: 220–241. 29. Thompson IM, Ankerst DP, Chi C, Lucia MS, Goodman PJ, et al. (2005)
Operating characteristics of prostate-specific antigen in men with an initial PSA level of 3.0 ng/ml or lower. JAMA 294: 66–70.
30. Welch HG, Schwartz LM, Woloshin S (2005) Prostate-specific antigen levels in the United States: implications of various definitions for abnormal. J Natl Cancer Inst 97: 1132–1137.
31. Carignan A, Roussy JF, Lapointe V, Valiquette L, Sabbagh R, et al. (2012) Increasing risk of infectious complications after transrectal ultrasound-guided prostate biopsies: time to reassess antimicrobial prophylaxis? Eur Urol 62: 453– 459.
32. Nam RK, Saskin R, Lee Y, Liu Y, Law C, et al. (2010) Increasing hospital admission rates for urological complications after transrectal ultrasound guided prostate biopsy. J Urol 183: 963–968.
33. Schroder FH, Hugosson J, Roobol MJ, Tammela TL, Ciatto S, et al. (2012) Prostate-cancer mortality at 11 years of follow-up. N Engl J Med 366: 981–990. 34. Ku JH, Ahn JO, Lee CH, Lee NK, Park YH, et al. (2002) Distribution of serum prostate-specific antigen in healthy Korean men: influence of ethnicity. Urology 60: 475–479.
36. Moons KG, Kengne AP, Woodward M, Royston P, Vergouwe Y, et al. (2012) Risk prediction models: I. Development, internal validation, and assessing the incremental value of a new (bio)marker. Heart 98: 683–690.
37. Moons KG, Kengne AP, Grobbee DE, Royston P, Vergouwe Y, et al. (2012) Risk prediction models: II. External validation, model updating, and impact assessment. Heart 98: 691–698.