Different Effects of Three Polymorphisms in MicroRNAs
on Cancer Risk in Asian Population: Evidence from
Published Literatures
Yeqiong Xu1., Ling Gu2., Yuqin Pan1
, Rui Li2, Tianyi Gao1, Guoqi Song1, Zhenlin Nie1, Liping Chen2, Shukui Wang1*", Bangshun He1
*"
1The Central Laboratory of Nanjing First Hospital, Nanjing Medical University, Nanjing, China,2Department of Life Sciences, Nanjing Normal University, Nanjing, Jiangsu Province, China
Abstract
MicroRNAs (miRNAs) are a class of small non-protein-coding RNAs, which have emerged as integrated and important post-transcriptional regulators of gene expression. It has been demonstrated that single nucleotide polymorphisms (SNPs) exist in protein-coding genes. Accumulated studies have evaluated the association of miRNA SNPs with cancer risk, especially in Asian population, which included a series of related studies. However, the results remain controversial for the different genetic backgrounds, living habits and environment exposed. To evaluate the relationship between SNPs in miRNAs and cancer risk, 21 studies focused on Asian population were enrolled for the pooled analysis for three polymorphisms rs2910164, rs11614913, rs3746444 in three miRNAs miR-146aG.C, miR-196a2C.T, miR-499A.G using odds ratios (ORs) with 95% confidence intervals (CIs). For rs2910164 polymorphism, C allele was observed association with decreased overall cancer risk. In addition, subgroup analysis revealed of rs2910164 C allele decreased hepatocellular carcinoma (HCC), cervical cancer and prostate cancer risk among Chinese population. For rs11614913 polymorphism, TT genotype was observed to be associated with decreased cancer risk, especially for cancer type of colorectal cancer (CRC), lung cancer and country of Korea, North India. Whereas, rs3746444 G allele was an increased cancer risk factor in Chinese population, especially for breast cancer. In conclusion, this meta-analysis indicated that rs2910164 C allele was associated with decreased cancer risk in Chinese population. However, the association varied from different cancer types. Furthermore, TT genotype of rs11614913 was associated with decreased cancer risk. While different cancer types and countries contributed to different effects. Whereas, rs3746444 G allele was a risk factor in Chinese population, and the association varied from different cancer types.
Citation:Xu Y, Gu L, Pan Y, Li R, Gao T, et al. (2013) Different Effects of Three Polymorphisms in MicroRNAs on Cancer Risk in Asian Population: Evidence from Published Literatures. PLoS ONE 8(6): e65123. doi:10.1371/journal.pone.0065123
Editor:Sadashiva Karnik, Cleveland Clinic Lerner Research Institute, United States of America ReceivedNovember 19, 2012;AcceptedApril 22, 2013;PublishedJune 4, 2013
Copyright:ß2013 Xu et al. This is an open-access article distributed under the terms of the Creative Commons Attribution License, which permits unrestricted
use, distribution, and reproduction in any medium, provided the original author and source are credited.
Funding:This project was supported by grants from The National Nature Science Foundation of China (81172141, 81200401), Jiangsu Provincial Key Medical Talents to SK Wang, Program of Healthy Talents’ Cultivation for Nanjing City to BS He, and Medical Science and technology development Foundation, Nanjing Department of Health (QYK11175) to BS He. The funders had no role in study design, data collection and analysis, decision to publish, or preparation of the manuscript.
Competing Interests:The authors have declared that no competing interests exist. * E-mail: [email protected] (BSH); [email protected] (SKW)
.These authors contributed equally to this work. "These authors also contributed equally to this work.
Introduction
MicroRNAs (MiRNAs) are a family of naturally occurring, small noncoding RNAs of 21–24 nucleotides in length that regulate gene expression by base pairing with target mRNAs at the 39UTR, leading to mRNA cleavage or translational repression [1,2]. MiRNAs encoded in the genome are transcribed by RNA polymerase II or RNA polymerase III in the nucleus, where they cleaved by Drosha and Dicer sequentially [3,4]. It has been suggested that miRNAs are important post-transcriptional regu-lators of gene expression that control diverse physiological and pathological processes. Accumulating evidence indicates that aberrant expressions of miRNAs were indicated to involve in tumorigenesis, development and prognosis of many cancers [5,6,7,8,9].
Single nucleotide polymorphisms (SNPs) were found in most genes, and recently SNPs of miRNAs have been paid much more attention. Studies have reported that miRNA SNPs could alter expressions or functions of miRNAs, and related to cancer risk. Meanwhile, studies have reported polymorphisms in miRNA genes, biogenesis pathway of miRNAs and their target binding sites. Moreover, polymorphisms in miRNA genes could directly influence the expressions and functions of miRNAs. Recently, miR-146aG.C (rs2910164), miR-196a2C.T (rs11614913) and miR-499A.G (rs3746444) were drawed close attention and were expected to demonstrate the association with many cancers [10,11,12,13,14,15,16,17]. However, the results were generally inconsistent and inconclusive. Therefore, this meta-analysis focused on these three polymorphisms to deliberate their associations with cancer risk, which have surveyed in many populations. According
to the recent studies, consistent conclusions were observed in Caucasian population while conflicting results were found in Asian population [13,18,19,20,21,22,23] due to the different countries, the numbers of study population, cancer types. To draw a conclusion of three polymorphisms and cancer risk in Asian population, an analysis of pooled published studies was required. This meta-analysis explored the associations between polymor-phisms of three miRNAs and cancer in Asian population.
Materials and Methods
Literature and Inclusion Criteria
Using the combined words ‘‘miR-146a/miR-196a2/miR-499’’, ‘‘cancer’’ or ‘‘carcinoma’’, ‘‘genetic variation’’ or ‘‘polymor-phism’’, a comprehensive systematic bibliographic searching was applied through the medical databases PubMed, EMBASE and Web of Science for all medical published up to October 15th, 2012. In addition, studies were identified by manual search of the reference listed in the retrieved studies. Data from studies were accepted in our meta-analysis only if the study met all of the following criteria: (1) published in English; (2) available cancer risk and miR-146a/miR-499/miR-196a2 polymorphism data related to Asian population; (3) case-control studies; (4) sources of cases and sufficient available data to estimate an odds ratio (OR) with 95% confidence interval (CI); (5) available genotype frequency. Moreover, the studies were eliminated if there are no raw data in the studies, or they are case-only studies, case reports, editorials, and review articles (including meta-analyses).
Data Extraction
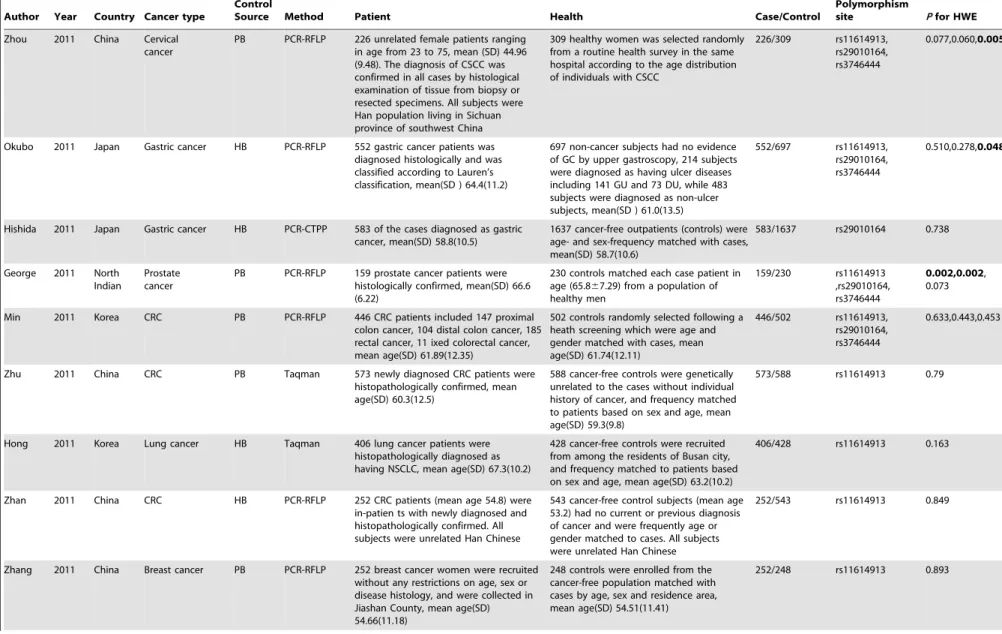
Information was reviewed carefully extracted from all the eligible articles independently by two of the authors (Yeqiong Xu and Ling Gu) according to the inclusion criteria listed above. The characteristics information of enrolled studies was extracted from the study: the first author’s last name, year of publications, country of subjects, cancer type, the source of controls, genotyping method, matching numbers of genotyped cases and controls, polymorphism site andPfor HWE (Table 1). If discrepancies and differences were existed after data collection, discussion was carried out to get consensus.
Statistical Analysis
The strength of association between the three SNPs and cancer risk was assessed by odds ratios (ORs) with 95% confidence intervals (CIs). The pooled ORs were estimated for dominant model, recessive model, homozygote comparison, heterozygote comparison and allelic comparison, respectively. Stratified anal-yses were also performed by cancer type (HCC, CRC, cervical cancer, prostate cancer, breast cancer, gastric cancer, lung cancer, and other cancers group which combined the cancer types containing less than two individual studies), country (China, Korea, Japan, North India and other countries group which combined the countries containing less than two individual studies) source of control and genotyping method. Heterogeneity across the studies was evaluated by using the Chi-square test based Q-statistic test, and it was considered significant whenPheterogeneity(Ph)
,0.05. The data were combined using both fixed-effects (the Mantel-Haenszel method) and random effects (the DerSimonian and Laird method) models. A random-effect model was employed when heterogeneity existed [24–25], Otherwise, the fixed-effect model was employed to pool the results [26]. Moreover, to assess the stability of the results, a sensitivity analysis was performed. Publication bias was checked graphically by using funnel plots and statistically using the Egger’s linear regression test. For the
controls of each study, the genotype frequencies of the three polymorphisms of miRNA were assessed for Hardy-Weinberg equilibrium using a web-based program (http://ihg.gsf.de/cgi-bin/hw/hwa1.pl). All statistical tests were performed with STATA 10.0 and all thePvalues were two-sided.
Results
Characteristics of Studies
This study enrolled 31 eligible papers (Figure 1) according to the inclusion criteria. For rs2910164 polymorphism, 21 studies with available data were enrolled in the pooled analysis. These studies consisted of China (13 studies), Korea (2 studies), North India (3 studies) and Japan (2 studies) related to HCC (4 studies), gastric cancer (4 studies), cervical cancer (2 studies), prostate cancer (2 studies), breast cancer (2 studies) and other cancers (7 studies). In addition, the controls of most studies were population-based, and the main genotyping method was PCR-RFLP (Table 1).
For rs11614913 polymorphism, 21 studies provided available data, which were classified into CRC (4 studies), HCC (3 studies), breast cancer (3 studies), lung cancer (3 studies), gastric cancer (2 studies) and other cancers (6 studies). Meanwhile, these studies with data of 12 studies of Chinese population, 4 studies of Korean population, 3 studies of North Indian population and 2 studies of other countries. To analyze polymorphisms, genotyping by polymerase chain reaction-restriction fragment length polymor-phism (PCR-RFLP) were performed by the most studies, in which 16 were population-based and 5 were hospital-based (Table 1).
For rs3746444 polymorphism, 13 studies covered China (6 studies), Korea (2 studies), North India (3 studies) and other countries (2 studies) related to HCC (3 studies), breast cancer (2 studies) and other cancers (8 studies) were included in the pooled analysis. What’s more, these studies contained 11 of population-based controls and 2 of hospital-population-based controls.
Main Results
For rs2910164 polymorphism, results of pooled analysis revealed significantly decreased risk was observed for the the comparison of homozygote model (CC vs GG: OR = 0.83, 95% CI: 0.70–0.99, Ph= 0.000), heterozygote model (GC vs GG:
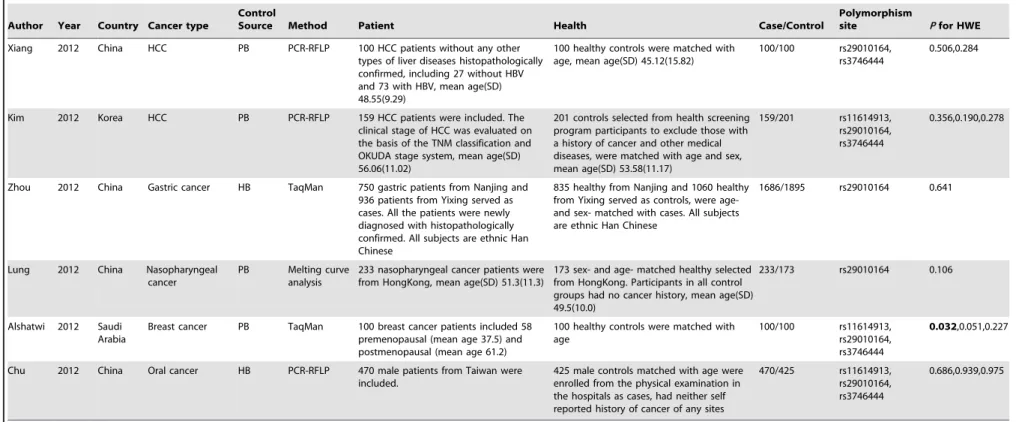
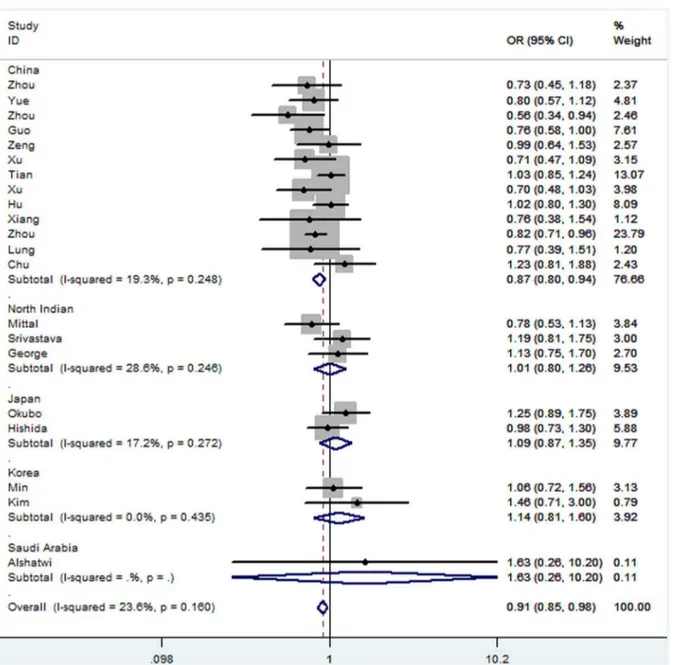
OR = 0.91, 95% CI: 0.85–0.98, Ph= 0.160) (Figure 2) and
dominant model (CC+GC vs GG: OR = 0.89, 95% CI: 0.80– 1.00,Z= 2.06,P= 0.040, Ph= 0.004). Cancer subgroup analysis
revealed an obvious decreased risk was found in cervical cancer for all four comparison models (CC vs GG: OR = 0.50, 95% CI: 0.37–0.68,Ph= 0.814; GC vs GG: OR = 0.72, 95% CI: 0.55–0.95,
Ph= 0.254; CC+GC vs GG: OR = 0.63, 95% CI: 0.49–0.82,
Ph= 0.382; CC vs GG+GC: OR = 0.65, 95% CI: 0.52–0.82,
Ph= 0.359). Similarly, decreased cancer risk was observed when
compared of homozygote model and recessive model in prostate cancer (CC vs GG: OR = 0.54, 95% CI: 0.34–0.87, Ph= 0.425;
CC vs GG+GC: OR = 0.65, 95% CI: 0.44–0.96, Ph= 0.699).
Moreover, a decreased risk was observed in HCC for the comparison of homozygote model and dominant model (CC vs GG: OR = 0.75, 95% CI: 0.57–0.98,Ph= 0.213; CC+GC vs GG:
OR = 0.77, 95% CI: 0.61–0.98, Ph= 0.284) as well. Country
subgroup analysis revealed that rs2910164 C allele was associated with a decreased risk of cancer in Chinese population (CC vs GG: OR = 0.73, 95% CI: 0.60–0.88, Ph= 0.000; GC vs GG:
OR = 0.87, 95% CI: 0.80–0.94, Ph= 0.248; CC+GC vs GG:
OR = 0.81, 95% CI: 0.72–0.92, Ph= 0.032; CC vs GG+GC:
OR = 0.83, 95% CI: 0.71–0.97,Ph= 0.000). Moreover, a
signif-icantly decreased risk was found for the comparison of homozy-gote model (CC vs GG: OR = 0.79, 95% CI: 0.64–0.98,
MicroRNA Polymorphisms Effect on Cancer Risk
Table 1.Characteristics of studies included in the meta-analysis.
Author Year Country Cancer type
Control
Source Method Patient Health Case/Control
Polymorphism
site Pfor HWE
Xu 2008 China HCC PB PCR-RFLP 479 HCC patients were diagnosed histopathologically, lived in Guangzhou or the surrounding regions, mean age (SD) 45.2(12.1)
504 cancer-free controls were collected in the same period as patients, frequency-matched to the cases on age and sex, mean age (SD) 44.6(11.4)
479/504 rs29010164 0.119
Hu 2008 China Breast cancer PB PCR-RFLP 1009 newly diagnosed and histopathologically confirmed breast cancer patients from Nanjing, including 998 invasive, 28 ductal carcinoma, and 3 lobular carcinoma, mean age (SD) 51.60(11.08)
1093 cancer-free control women, frequency-matched to the cases on age and residential area, mean age (SD) 51.77(11.19)
1009/1093 rs11614913, rs29010164, rs3746444
0.207,0.221,0.057
Tian 2009 China Lung cancer PB PCR-RFLP 1058 lung cancer patients were histopathologically diagnosed, lived in Nanjing, without the restrictions of age, sex, and histology, mean age (SD) 59.78(10.04)
1035 cancer-free controls conducted in Jiangsu Province during the same period as the cases were recruited. The control subjects had no history of cancer and were frequency matched to the cases on age, sex, and residential area, mean age (SD) 59.66(9.83)
1058/1035 rs11614913, rs29010164, rs3746444
0.700,0.853,0.404
Guo 2010 China Esophageal cancer PB SNPshot 444 ESCC patients were from Chongqing City and the surrounding regions and were histopathologically diagnosed without the restrictions of age and sex
468 Cancer-free controls, having no history or family history of cancer and other genetic disease, and were frequency matched to the cases on age, gender, and residential area
444/468 rs29010164 0.12
Zeng 2010 China Gastric cancer HB PCR-RFLP 304 gastric cancer patients (mean age 59, age range 51–66) were from Jiangsu Province, and all confirmed by endoscopic biopsy or surgical specimens
304 cancer-free controls (mean age 58, age range 50–66) matched to gastric cancer cases by gender and age, were selected from patients hospitalized
304/304 rs29010164 0.122
Srivastava 2010 North Indian
Gallbladder cancer PB PCR-RFLP 230 gallbladder cancer patients were diagnosis and confirmed for all cases by fine needle aspirated cell cytology and histopathology
230 control subjects were healthy adults without a history of cancer, who were randomly selected from general population and were frequency matched to cancer cases on age and gender
230/230 rs11614913, rs29010164, rs3746444
0.068,0.080,0.566
Xu 2010 China Prostate cancer PB PCR-RFLP 251 prostate cancer patients were confirmed by biopsy, lived in Nanjing
280 controls were age-matched, and the subjects were healthy checkup examinees without cancer history and were collected in the same period
251/280 rs29010164 0.191
Chen 2010 China CRC PB PCR–LDR 126 CRC patients had undergone surgery and been histopat hologically confirmed. The mean age was 57.9.All cases were ethnically Chinese
407 controls were free of disease on health check-up. They were matched with the case patients by age and sex. The mean age was 55.6. All controls were ethnically Chinese
126/407 rs11614913 0.789
Li 2010 China HCC HB PCR-RFLP 310 cirrhosis patients (mean age 49) with HCC served as cases were diagnosed via histopathology. The subjects were all Han Chinese
222 cirrhosis patients (mean age 50) without HCC served as controls. The subjects were all Han Chinese
310/222 rs11614913 0.402
Table 1.Cont.
Author Year Country Cancer type
Control
Source Method Patient Health Case/Control
Polymorphism
site Pfor HWE
Yoo 2010 Korea Lung cancer PB Melting curve analysis
654 newly diagnosed lung cancer patients included 287 squamous cell carcinomas, 246 adenocarcinomas, 10 large cell carcinomas, and 101 small cell carcinomas. There were no gender, histologic, or stage restrictions, mean age (SD) 61.1(9.0). All patients were ethnic Koreans who resided in Daegu City or the surrounding regions
640 control subjects were frequency-matched to the cases based on gender and age, mean age (SD) 60.5(9.4). All controls were ethnic Koreans who resided in Daegu City or the surrounding regions
654/640 rs11614913 0.126
Dou 2010 China Glioma PB PCR–LDR 670 newly diagnosed glioma cancer patients confirmed via histopathology, including 246 astrocytomas, 204 glioblastoma, 193 other gliomas. All the subjects were Han Chinese origin. Among them, 643 cases were
genotyped successfully
680 cancer-free controls were frequency matched to the cases with the same age, sex, and residence area. All the subjects were Han Chinese origin.Among them, 656 controls were genotyped successfully
643/656 rs11614913 0.119
Qi 2010 China HCC PB PCR–LDR 361 HCC patients (mean age 49) with chronic HBV infection were designated as cases. The diagnosis of HCC was histopathologically confirmed, All subjects were Han Chinese
391 healthy volunteers (mean age 35) served as healthy controls. All subjects were Han Chinese
361/391 rs11614913 0.869
Peng 2010 China Gastric cancer PB PCR-RFLP 213 gastric cancer were inpatients newly diagnosed and histopathologically confirmed. The subjects in this study were unrelated Han Chinese, mean age (SD) 58(12)
213 cancer-free controls had no current or previous diagnosis of cancer and were frequency matched to cases on age and gender. The subjects in this study were unrelated Han Chinese, mean age (SD) 58.3(11.8)
213/213 rs11614913 0.936
Zhou 2011 China HCC PB PCR-RFLP 186 patients with primary liver cancer were diagnosed either by
histopathologic or imaging evidence, mean age (SD) 52.10(15.20)
483 healthy individuals undergoing routine medical examination without any medical illness, matched with patients by age and gender
186/483 rs29010164, rs3746444
0.056,0.100
Yue 2011 China Cervical cancer
PB PCR-RFLP 447 cervical cancer patients were newly diagnosed and histologically confirmed. All subjects were genetically-unrelated Han Chinese, mean age (SD) 46.38(8.98)
443 cancer-free controls consisted of women in good health and with no malignancy history. They were frequency-matched to the cases by age, with people who were being recruited during the same time. All subjects were genetically-unrelated Han Chinese, mean age (SD) 46.38(8.98)
447/443 rs29010164 0.285
Mittal 2011 North India
Bladder cancer
PB PCR-RFLP 212 histologically confirmed patients with UBC (mean age 59.0 years; 187 men and 25 women) were unrelated North Indian.
250 healthy and genetically unrelated were recruited as the control (mean age 57.8 years, 215 men and 35 women). All the controls were age, sex matched, of similar ethnicity, and had no evidence of malignancy or chronic disease
Table 1.Cont.
Author Year Country Cancer type
Control
Source Method Patient Health Case/Control
Polymorphism
site Pfor HWE
Zhou 2011 China Cervical cancer
PB PCR-RFLP 226 unrelated female patients ranging in age from 23 to 75, mean (SD) 44.96 (9.48). The diagnosis of CSCC was confirmed in all cases by histological examination of tissue from biopsy or resected specimens. All subjects were Han population living in Sichuan province of southwest China
309 healthy women was selected randomly from a routine health survey in the same hospital according to the age distribution of individuals with CSCC
226/309 rs11614913, rs29010164, rs3746444
0.077,0.060,0.005
Okubo 2011 Japan Gastric cancer HB PCR-RFLP 552 gastric cancer patients was diagnosed histologically and was classified according to Lauren’s classification, mean(SD ) 64.4(11.2)
697 non-cancer subjects had no evidence of GC by upper gastroscopy, 214 subjects were diagnosed as having ulcer diseases including 141 GU and 73 DU, while 483 subjects were diagnosed as non-ulcer subjects, mean(SD ) 61.0(13.5)
552/697 rs11614913, rs29010164, rs3746444
0.510,0.278,0.048
Hishida 2011 Japan Gastric cancer HB PCR-CTPP 583 of the cases diagnosed as gastric cancer, mean(SD) 58.8(10.5)
1637 cancer-free outpatients (controls) were age- and sex-frequency matched with cases, mean(SD) 58.7(10.6)
583/1637 rs29010164 0.738
George 2011 North Indian
Prostate cancer
PB PCR-RFLP 159 prostate cancer patients were histologically confirmed, mean(SD) 66.6 (6.22)
230 controls matched each case patient in age (65.867.29) from a population of healthy men 159/230 rs11614913 ,rs29010164, rs3746444 0.002,0.002, 0.073
Min 2011 Korea CRC PB PCR-RFLP 446 CRC patients included 147 proximal colon cancer, 104 distal colon cancer, 185 rectal cancer, 11 ixed colorectal cancer, mean age(SD) 61.89(12.35)
502 controls randomly selected following a heath screening which were age and gender matched with cases, mean age(SD) 61.74(12.11)
446/502 rs11614913, rs29010164, rs3746444
0.633,0.443,0.453
Zhu 2011 China CRC PB Taqman 573 newly diagnosed CRC patients were histopathologically confirmed, mean age(SD) 60.3(12.5)
588 cancer-free controls were genetically unrelated to the cases without individual history of cancer, and frequency matched to patients based on sex and age, mean age(SD) 59.3(9.8)
573/588 rs11614913 0.79
Hong 2011 Korea Lung cancer HB Taqman 406 lung cancer patients were histopathologically diagnosed as having NSCLC, mean age(SD) 67.3(10.2)
428 cancer-free controls were recruited from among the residents of Busan city, and frequency matched to patients based on sex and age, mean age(SD) 63.2(10.2)
406/428 rs11614913 0.163
Zhan 2011 China CRC HB PCR-RFLP 252 CRC patients (mean age 54.8) were in-patien ts with newly diagnosed and histopathologically confirmed. All subjects were unrelated Han Chinese
543 cancer-free control subjects (mean age 53.2) had no current or previous diagnosis of cancer and were frequently age or gender matched to cases. All subjects were unrelated Han Chinese
252/543 rs11614913 0.849
Zhang 2011 China Breast cancer PB PCR-RFLP 252 breast cancer women were recruited without any restrictions on age, sex or disease histology, and were collected in Jiashan County, mean age(SD) 54.66(11.18)
248 controls were enrolled from the cancer-free population matched with cases by age, sex and residence area, mean age(SD) 54.51(11.41)
252/248 rs11614913 0.893
Table 1.Cont.
Author Year Country Cancer type
Control
Source Method Patient Health Case/Control
Polymorphism
site Pfor HWE
Xiang 2012 China HCC PB PCR-RFLP 100 HCC patients without any other types of liver diseases histopathologically confirmed, including 27 without HBV and 73 with HBV, mean age(SD) 48.55(9.29)
100 healthy controls were matched with age, mean age(SD) 45.12(15.82)
100/100 rs29010164, rs3746444
0.506,0.284
Kim 2012 Korea HCC PB PCR-RFLP 159 HCC patients were included. The clinical stage of HCC was evaluated on the basis of the TNM classification and OKUDA stage system, mean age(SD) 56.06(11.02)
201 controls selected from health screening program participants to exclude those with a history of cancer and other medical diseases, were matched with age and sex, mean age(SD) 53.58(11.17)
159/201 rs11614913, rs29010164, rs3746444
0.356,0.190,0.278
Zhou 2012 China Gastric cancer HB TaqMan 750 gastric patients from Nanjing and 936 patients from Yixing served as cases. All the patients were newly diagnosed with histopathologically confirmed. All subjects are ethnic Han Chinese
835 healthy from Nanjing and 1060 healthy from Yixing served as controls, were age-and sex- matched with cases. All subjects are ethnic Han Chinese
1686/1895 rs29010164 0.641
Lung 2012 China Nasopharyngeal cancer
PB Melting curve analysis
233 nasopharyngeal cancer patients were from HongKong, mean age(SD) 51.3(11.3)
173 sex- and age- matched healthy selected from HongKong. Participants in all control groups had no cancer history, mean age(SD) 49.5(10.0)
233/173 rs29010164 0.106
Alshatwi 2012 Saudi Arabia
Breast cancer PB TaqMan 100 breast cancer patients included 58 premenopausal (mean age 37.5) and postmenopausal (mean age 61.2)
100 healthy controls were matched with age
100/100 rs11614913, rs29010164, rs3746444
0.032,0.051,0.227
Chu 2012 China Oral cancer HB PCR-RFLP 470 male patients from Taiwan were included.
425 male controls matched with age were enrolled from the physical examination in the hospitals as cases, had neither self reported history of cancer of any sites
470/425 rs11614913, rs29010164, rs3746444
0.686,0.939,0.975
HCC: hepatocellular carcinoma; CRC: colorectal cancer; HB: hospital based; PB: population based; PCR-RFLP: polymerase chain reaction–restriction fragment length polymorphism; PCR-CTPP: polymerase chain reaction with confronting two-pair primers; PCR-LDR: ligation detection reaction; HWE: Hardy-Weinberg equilibrium.
doi:10.1371/journal.pone.0065123.t001 MicroRNA
Polymorp
hisms
Effect
on
Cancer
Risk
PLOS
ONE
|
www.ploson
e.org
6
June
2013
|
Volume
8
|
Issue
6
|
Ph= 0.001), heterozygote model (GC vs GG: OR = 0.90, 95% CI:
0.83–0.99, Ph= 0.232) and dominant model (CC+GC vs GG:
OR = 0.86, 95% CI: 0.75–0.98, Ph= 0.021) in population-based
controls. Finally, genotyping method subgroup analysis revealed a decreased cancer risk determined by Taqman in all four comparion models (CC vs GG: OR = 0.70, 95% CI: 0.58–0.85,
Ph= 0.450; GC vs GG: OR = 0.92, 95% CI: 0.85–0.98,
Ph= 0.467; CC+GC vs GG: OR = 0.79, 95% CI: 0.69–0.91,
Ph= 0.479; CC vs GG+GC: OR = 0.79, 95% CI: 0.67–0.93,
Ph= 0.667), as summarized in Table 2.
For rs11614913 polymorphism, decreased risk associations were observed in the overall pooled analysis for the comparison of homozygote model (TT vs CC: OR = 0.84, 95% CI: 0.74–0.95,
Ph= 0.029) and recessive model (TT vs CC+CT: OR = 0.86, 95%
CI: 0.80–0.92, Ph= 0.389) (Figure 3). Cancer types subgroup
analysis revealed a significant association in the comparison of homozygote model (TT vs CC: OR = 0.70, 95% CI: 0.57–0.85,
Ph= 0.284), heterozygote model (CT vs CC: OR = 0.81, 95% CI:
0.68–0.97, Ph= 0.367), dominant model (TT+CT vs CC:
OR = 0.77, 95% CI: 0.65–0.91, Ph= 0.377) and recessive model
(TT vs CC+CT: OR = 0.80, 95% CI: 0.69–0.94, Ph= 0.198) in
colorectal cancer. Similarly, a decreased risk was observed for the comparison of homozygote model (TT vs CC: OR = 0.77, 95% CI: 0.65–0.91, Ph= 0.895), dominant model (TT+CT vs CC:
OR = 0.85, 95% CI: 0.74–0.98, Ph= 0.289) and recessive model
(TT vs CC+CT: OR = 0.83, 95% CI: 0.73–0.95, Ph= 0.281) in
lung cancer and homozygote model (TT vs CC: OR = 0.79, 95% CI: 0.63–0.99, Ph= 0.127) in breast cancer. In contrast, an
increased risk was observed in other cancers (CT vs CC: OR = 1.49, 95% CI: 1.28–1.74, Ph= 0.178; TT+CT vs CC:
OR = 1.39, 95% CI: 1.20–1.61,Ph= 0.226). Subgroup analysis by
country revealed a decreased risk for the comparison of recessive model in China (TT vs CC+CT: OR = 0.87, 95% CI: 0.80–0.94,
Ph= 0.252) and Korea (OR = 0.83, 95% CI: 0.72–0.97,
Ph= 0.327). In addition, the decreased risk was also observed for
comparison of homozygote model (TT vs CC: OR = 0.77, 95% CI: 0.64–0.93,Ph= 0.616) and dominant model (TT+CT vs CC:
OR = 0.84, 95% CI: 0.72–0.98,Ph= 0.162) in Korea. However,
an increased risk was observed in North India (CT vs CC:
OR = 1.53, 95% CI: 1.22–1.93, Ph= 0.832; TT +CT vs CC:
OR = 1.43, 95% CI: 1.15–1.79,Ph= 0.796). Subgroup analysis by
the source of control revealed significant decrease risk for the comparison of recessive model not only in the hospital-population based controls (TT vs CC+CT: OR = 0.79, 95% CI: 0.69–0.90,
Ph= 0.295) but also in population-based controls (TT vs CC+CT:
OR = 0.88, 95% CI: 0.81–0.95,Ph= 0.509), and a decreased risk
for the comparison of homozygote model (TT vs CC: OR = 0.82, 95% CI: 0.74–0.91,Ph= 0.226) was revealed in population-based
controls as well. Subgroup analysis determined by genotyping method showed a significant association between the polymor-phism and cancer risk in both PCR-RFLP and Taqman group for the comparison of homozygote model (TT vs CC: OR = 0.81, 95% CI: 0.69–0.96,Ph= 0.044; OR = 0.71, 95% CI: 0.55–0.91,
Ph= 0.740, respectively) and recessive model (TT vs CC+CT:
OR = 0.87, 95% CI: 0.80–0.94,Ph= 0.444; OR = 0.69, 95% CI:
0.57–0.85,Ph= 0.903, respectively), as summarized in Table 3.
For rs3746444 polymorphism, an increased risk was revealed for the comparison of homozygote model (GG vs AA: OR = 1.25, 95% CI: 1.03–1.52,Ph= 0.073), heterozygote model (GA vs AA:
OR = 1.28, 95% CI: 1.08–1.53,Ph= 0.000) and dominant model
(GG+GA vs AA: OR = 1.27, 95% CI: 1.08–1.50, Ph= 0.000)
(Figure 4) in the overall analysis. In the stratified analysis by cancer type, an increased risk was observed in breast cancer for the comparison of dominant model (GG+GA vs AA: OR = 1.31, 95% CI: 1.09–1.57,Ph= 0.182). Meanwhile, an increased risk was also
found in other cancers (GA vs AA: OR = 1.32, 95% CI: 1.05–1.67,
Ph= 0.000; GG+GA vs AA: OR = 1.29, 95% CI: 1.05–1.59,
Ph= 0.001). In addition, sesults of subgroup analysis of country
revealed increased cancer risk in China (GA vs AA: OR = 1.36, 95% CI: 1.06–1.75,Ph= 0.002; GG+GA vs AA: OR = 1.40, 95%
CI: 1.08–1.82,Ph= 0.000; GG vs AA+GA: OR = 1.41, 95% CI:
1.06–1.87, Ph= 0.050) and North India (GG+GA vs AA:
OR = 1.33, 95% CI: 1.07–1.66, Ph= 0.150). Similarly, an
increased cancer risk association was observed in the subgroup analysis of source of controls. Subgroup analysis of population-based controls group showed the increased cancer risk for the comparison of heterozygote model (GA vs AA: OR = 1.27, 95% CI: 1.05–1.54, Ph= 0.000) and dominant model (GG+GA vs Figure 1. Flow chart of studies identified according to inclusion and exclusion criteria.
doi:10.1371/journal.pone.0065123.g001
MicroRNA Polymorphisms Effect on Cancer Risk
AA: OR = 1.24, 95% CI: 1.04–1.47, Ph= 0.002). Furthermore,
subgroup analysis of hospital-based controls group showed the increased cancer risk for the comparison of homozygote model (GG vs AA: OR = 1.70, 95% CI: 1.09–2.67, Ph= 0.121) and
recessive model (GG vs AA+GA: OR = 1.67, 95% CI: 1.07–2.61,
Ph= 0.176), as summarized in Table 4.
Overall Effects for Alleles
Allele comparisons were also conducted in this meta-analysis. For allele comparison of rs2910164 polymorphism, a decreased cancer risk was observed in C allele (OR = 0.92, 95% CI: 0.85– 1.00,Z= 2.00,P= 0.046,Ph= 0.000) for pooled analysis. In the
subgroup analysis of cancer type, a decreased risk was observed in HCC (OR = 0.88, 95% CI: 0.78–1.00, Z= 1.99, P= 0.046,
Ph= 0.245) and cervical cancer (OR = 0.72, 95% CI: 0.62–0.84,
Ph= 0.796). Country subgroup analysis revealed C allele was
associated with decreased cancer risk in Chinese population
(OR = 0.87, 95% CI: 0.79–0.95, Ph= 0.000). When stratified
analysis by genotyping method, C allele was associated with obvious decreased cancer risk by Taqman (OR = 0.84, 95% CI: 0.76–0.92,Ph= 0.570).
There was no evidence that rs11614913 T allele associated with the risk of cancer. Meanwhile we conducted subgroup analysis of cancer type, country, source of controls and genotyping method. In the subgroup analysis of cancer type, a decreased risk was observed in CRC (OR = 0.84, 95% CI: 0.76–0.92,Ph= 0.281) and
lung cancer (OR = 0.87, 95% CI: 0.80–0.95,Ph= 0.854). Country
subgroup analysis revealed T allele was associated with decreased cancer risk in Korean population (OR = 0.87, 95% CI: 0.79–0.96,
Ph= 0.608). In the subgroup analysis of genotyping method
indicated a decreased cancer risk with T allele determined by Taqman (OR = 0.87, 95% CI: 0.77–0.98,Ph= 0.191).
For rs3746444 polymorphism, a significant increased cancer risk was found in the population with G allele (OR = 1.18, 95%
Figure 2. Forest plots of effect estimates for rs2910164 stratified by country (GC vs GG).For each studies, the estimate of OR and its 95% CI is plotted with aboxand ahorizontal line.Filled diamondpooled OR and its 95% CI.
doi:10.1371/journal.pone.0065123.g002
MicroRNA Polymorphisms Effect on Cancer Risk
Table 2.Stratified analyses of the miR-146aG.C (rs2910164) polymorphism and cancer risk.
Variables na CC vs GG GC vs GG CC+GC vs GG CC vs GG+GC C allele vs G allele
OR(95%CI) Pb I2
OR(95%CI) Pb I2
OR(95%CI) Pb I2
OR(95%CI) Pb I2
OR(95%CI) Pb I2
Total 21 0.83(0.70,0.99)c 0.000 65.8 0.91(0.85,0.98) 0.160 23.6 0.89(0.80,1.00)c 0.004 50.7 0.89(0.79,1.01)c 0.000 65.4 0.92(0.85,1.00)c 0.000 69.3
Cancer type
HCC 4 0.75(0.57,0.98) 0.213 33.1 0.79(0.61,1.02) 0.343 10.0 0.77(0.61,0.98) 0.284 21.0 0.88(0.73,1.05) 0.234 29.7 0.88(0.78,1.00) 0.245 27.8
Cervical cancer 2 0.50(0.37,0.68) 0.814 0.0 0.72(0.55,0.95) 0.254 23.1 0.63(0.49,0.82) 0.382 0.0 0.65(0.52,0.82) 0.359 0.0 0.72(0.62,0.84) 0.796 0.0
Prostate cancer 2 0.54(0.34,0.87) 0.425 0.0 0.91(0.67,1.22) 0.131 56.1 0.85(0.64,1.13) 0.062 71.4 0.65(0.44,0.96) 0.699 0.0 0.83(0.69,1.01) 0.071 69.3
Breast cancer 2 1.00(0.77,1.29) 0.708 0.0 1.03(0.81,1.31) 0.619 0.0 1.02(0.81,1.28) 0.662 0.0 0.97(0.81,1.15) 0.745 0.0 0.99(0.88,1.11) 0.854 0.0
Gastric cancer 4 0.92(0.63,1.34)c 0.000 84.1 0.91(0.81,1.02) 0.136 45.8 0.96(0.74,1.24)c 0.011 73.1 0.92(0.70,1.21)c 0.000 83.5 0.95(0.78,1.16)c 0.000 86.4
Other cancers 7 0.97(0.72,1.32)c 0.030 57.0 0.96(0.85,1.09) 0.256 22.7 0.96(0.86,1.08) 0.119 40.8 1.00(0.75,1.34)c 0.002 71.6 0.99(0.85,1.14)c 0.004 69.1
Country
China 13 0.73(0.60,0.88)c 0.000 66.7 0.87(0.80,0.94) 0.248 19.3 0.81(0.72,0.92)c 0.032 46.6 0.83(0.71,0.97)c 0.000 70.5 0.87(0.79,0.95)c 0.000 70.3
Korea 2 0.98(0.69,1.39) 0.367 0.0 1.14(0.81,1.60) 0.435 0.0 1.07(0.77,1.48) 0.380 0.0 0.88(0.70,1.11) 0.658 0.0 0.96(0.82,1.12) 0.491 0.0
North India 3 1.30(0.69,2.48) 0.382 0.0 1.01(0.80,1.26) 0.246 28.6 1.03(0.82,1.28) 0.195 38.7 1.29(0.68,2.44) 0.441 0.0 1.04(0.87,1.25) 0.204 37.1
Japan 2 1.21(0.97,1.52) 0.069 69.8 1.09(0.87,1.35) 0.272 17.2 1.15(0.93,1.41) 0.123 57.9 1.14(0.98,1.32) 0.130 56.4 1.11(1.00,1.23) 0.058 72.3
Source of controls
Population based 16 0.79(0.64,0.98)c 0.001 61.4 0.90(0.83,0.99) 0.232 19.4 0.86(0.75,0.98)c 0.021 46.6 0.88(0.76,1.03)c 0.001 61.5 0.91(0.83,1.00)c 0.000 65.1
Hospital based 5 0.93(0.68,1.27)c 0.001 79.3 0.93(0.83,1.04) 0.114 46.4 0.98(0.78,1.23)c 0.014 67.8 0.91(0.73,1.13)c 0.001 78.5 0.95(0.81,1.12)c 0.000 81.9
Genotyping method
PCR-RFLP 16 0.84(0.69,1.03)c 0.000 65.6 0.96(0.88,1.05) 0.153 26.9 0.91(0.80,1.04)c 0.007 52.9 0.88(0.77,1.00)c 0.002 58.7 0.92(0.84,1.01)c 0.000 66.7
Taqman 2 0.70(0.58,0.85) 0.450 0.0 0.92(0.85,0.98) 0.467 0.0 0.79(0.69,0.91) 0.479 0.0 0.79(0.67,0.93) 0.667 0.0 0.84(0.76,0.92) 0.570 0.0
Other methods 3 0.85(0.45,1.62)c 0.008 79.5 0.85(0.70,1.02) 0.441 0.0 0.85(0.71,1.01) 0.160 45.5 1.00(0.55,1.80)c 0.001 86.7 1.00(0.73,1.37)c 0.001 86.0
HCC: hepatocellular carcinoma; PCR-RFLP: polymerase chain reaction–restriction fragment length polymorphism.
a
Number of included studies.
bPvalue ofQtest for heterogeneity test.
cRandom-effect model was used when P value for heterogeneity,0.05; otherwise, fixed-effect model was used.
Statistically significant results were in bold. doi:10.1371/journal.pone.0065123.t002
MicroRNA
Polymorp
hisms
Effect
on
Cancer
Risk
PLOS
ONE
|
www.ploson
e.org
9
June
2013
|
Volume
8
|
Issue
6
|
CI: 1.04–1.34, Ph= 0.000). In addition, cancer type subgroup
analysis G allele was associated with increased breast cancer (OR = 1.26, 95% CI: 1.08–1.47, Ph= 0.760) and other cancers
(OR = 1.18, 95% CI: 1.02–1.37,Ph= 0.006) risk. In the subgroup
analysis of country, obvious increased cancer risk was observed in Chinese population (OR = 1.36, 95% CI: 1.07–1.72,Ph= 0.000).
Meanwhile, borderline increased cancer risk was observed in population- based controls with G allele (OR = 1.14, 95% CI: 1.00–1.29,Z= 1.98,P= 0.047,Ph= 0.012).
Test of Heterogeneity
For overall studies, there were significant heterogeneity observed in rs2910164, rs11614913 and rs3746444 polymor-phisms. The source of the heterogeneity was evaluated for dominant model comparison by subgroups (cancer, country, source of controls and genotyping method). For rs2910164 polymorphism, the test revealed country (x2= 11.64, df = 4,
P= 0.020) but not cancer type (x2= 11.03, df = 5, P= 0.051),
source of controls (x2= 0.05, df = 1, P= 0.832) and method
(x2= 4.54, df = 2, P= 0.103) contributed to substantial
heteroge-neity. For rs11614913 polymorphism, cancer type (x2= 36.27,
df = 5, P= 0.000) and country (x2= 16.54, df = 3,P= 0.001) but
not source of controls (x2= 0.36, df = 1,P= 0.550) and genotyping
method (x2= 7.59, df = 3,P= 0.055) were found to contribute to
substantial heterogeneity. For rs3746444 polymorphism, the source of heterogeneity was not observed in all subgroups.
Sensitivity Analysis
Sensitivity analysis was performed to assess the stability of the results and assess the source of the heterogeneity by sequential removal of individual eligible study. For rs2910164 polymorphism, studies by Okubo [14] and Tian [10] were the main origin of heterogeneity. The heterogeneity was decreased when these two studies removed (CC+GC vs GG: Ph= 0.067, I2= 34.9%). For
rs11614913 polymorphism, sensitivity analysis indicated that studies by Chu [15], Dou [16], George [17] and Srivastava [24] were the main origin of heterogeneity. The heterogeneity was decreased when these four studies removed (TT+CT vs CC:
Ph= 0.054,I2= 38.4%). For rs3746444 polymorphism, sensitivity
analysis indicated that studies by Tian [10], Chu [15], Kim [25] and Okubo [14] were the main origin of heterogeneity. The heterogeneity was decreased when these four studies removed
Figure 3. Forest plots of effect estimates for rs11614913 stratified by country (TT vs CC+CT).For each studies, the estimate of OR and its 95% CI is plotted with aboxand ahorizontal line.Filled diamondpooled OR and its 95% CI.
doi:10.1371/journal.pone.0065123.g003
MicroRNA Polymorphisms Effect on Cancer Risk
Table 3.Stratified analyses of the miR-196a2C.T (rs11614913) polymorphism and cancer risk.
Variables na TT vs CC CT vs CC TT+CT vs CC TT vs CC+CT T allele vs C allele
OR(95%CI) Pb I2
OR(95%CI) Pb I2
OR(95%CI) Pb I2
OR(95%CI) Pb I2
OR(95%CI) Pb I2
Total 21 0.84(0.74,0.95)c 0.029 40.4 1.05(0.92,1.20)c 0.000 66.5 1.00(0.88,1.14)c 0.000 66.9 0.86(0.80,0.92) 0.389 5.4 0.94(0.88,1.00)c 0.007 48.3
Cancer type
CRC 4 0.70(0.57,0.85) 0.284 21.1 0.81(0.68,0.97) 0.367 5.2 0.77(0.65,0.91) 0.377 3.1 0.80(0.69,0.94) 0.198 35.7 0.84(0.76,0.92) 0.281 21.6
HCC 3 0.89(0.67,1.17) 0.088 58.9 0.95(0.74,1.21) 0.643 0.0 0.92(0.73,1.17) 0.277 22.2 0.92(0.74,1.14) 0.113 54.1 0.94(0.82,1.08) 0.069 62.5
Breast cancer 3 0.79(0.63,0.99) 0.127 51.5 0.96(0.78,1.17) 0.059 64.6 1.18(0.68,2.03)c 0.028 72.0 0.89(0.75,1.04) 0.114 53.9 1.05(0.78,1.40)c 0.028 72.1
Gastric cancer 2 0.80(0.61,1.06) 0.306 4.5 0.84(0.65,1.08) 0.163 48.5 0.82(0.65,1.04) 0.162 48.8 0.89(0.72,1.11) 0.698 0.0 0.89(0.78,1.02) 0.230 30.5
Lung cancer 3 0.77(0.65,0.91) 0.895 0.0 0.90(0.77,1.04) 0.098 57.0 0.85(0.74,0.98) 0.289 19.4 0.83(0.73,0.95) 0.281 21.3 0.87(0.80,0.95) 0.854 0.0
Other cancers 6 1.12(0.91,1.38) 0.238 26.2 1.49(1.28,1.74) 0.178 34.4 1.39(1.20,1.61) 0.226 27.8 0.87(0.75,1.02) 0.624 0.0 1.08(0.99,1.19) 0.752 0.0
Country
China 12 0.87(0.72,1.05)c 0.002 62.8 0.99(0.83,1.18)c 0.001 66.4 0.94(0.79,1.12)c 0.000 69.0 0.87(0.80,0.94) 0.252 19.5 0.92(0.85,1.00)c 0.007 57.5
Korea 4 0.77(0.64,0.93) 0.616 0.0 0.89(0.75,1.05) 0.053 60.9 0.84(0.72,0.98) 0.162 41.6 0.83(0.72,0.97) 0.327 13.2 0.87(0.79,0.96) 0.608 0.0
North India 3 0.74(0.44,1.26) 0.571 0.0 1.53(1.22,1.93) 0.832 0.0 1.43(1.15,1.79) 0.796 0.0 0.61(0.36,1.02) 0.438 0.0 1.17(0.99,1.38) 0.880 0.0
Other countries 2 0.87(0.63,1.20) 0.749 0.0 1.07(0.82,1.40) 0.093 64.6 1.03(0.80,1.33) 0.096 63.8 0.90(0.71,1.15) 0.481 0.0 0.97(0.84,1.13) 0.236 28.9
Source of controls
Population based 16 0.82(0.74,0.91) 0.226 20.0 1.03(0.89,1.20)c 0.000 63.8 1.00(0.86,1.15)c 0.000 64.0 0.88(0.81,0.95) 0.509 0.0 0.96(0.89,1.03)c 0.028 44.6
Hospital based 5 0.82(0.58,1.16)c 0.005 72.9 1.10(0.78,1.53)c 0.002 76.3 0.99(0.71,1.37)c 0.001 78.2 0.79(0.69,0.90) 0.295 18.8 0.89(0.77,1.03)c 0.024 64.5
Genotyping method
PCR-RFLP 14 0.81(0.69,0.96)c 0.044 42.9 1.02(0.85,1.23)c 0.000 71.8 0.98(0.82,1.17)c 0.000 72.0
0.87(0.80,0.94) 0.444 0.3 0.94(0.87,1.02)c 0.009 53.4
Taqman 3 0.71(0.55,0.91) 0.740 0.0 1.09(0.89,1.35) 0.099 56.7 0.97(0.80,1.18) 0.080 60.5 0.69(0.57,0.85) 0.903 0.0 0.87(0.77,0.98) 0.191 39.6
PCR–LDR 3 1.14(0.91,1.44) 0.972 0.0 1.23(1.00,1.51) 0.287 19.8 1.19(0.98,1.45) 0.517 0.0 0.98(0.82,1.16) 0.576 0.0 1.05(0.94,1.18) 0.994 0.0
CRC: colorectal cancer; HCC: hepatocellular carcinoma; PCR-RFLP: polymerase chain reaction–restriction fragment length polymorphism; PCR-LDR: ligation detection reaction.
aNumber of included studies.
bPvalue ofQtest for heterogeneity test.
cRandom-effect model was used when P value for heterogeneity,0.05; otherwise, fixed-effect model was used.
Statistically significant results were in bold. doi:10.1371/journal.pone.0065123.t003
MicroRNA
Polymorp
hisms
Effect
on
Cancer
Risk
PLOS
ONE
|
www.ploson
e.org
11
June
2013
|
Volume
8
|
Issue
6
|
(GG+GA vs AA: Ph= 0.066, I2= 45.4%). In addition, no other
single study was observed to impact the pooled OR by sensitivity analysis.
Publication Bias
Begg’s funnel plot and Egger’s test were performed to assess the publication bias of enrolled literature. The shape of the funnel plot indicated obvious asymmetry in rs11614913 dominant model comparison (Figure 5A). Thus, Egger’s test was used to provide statistical evidence of funnel plot asymmetry (t= 2.15, P= 0.045) (shown in Table 5), which suggested the existence of publication bias in this meta-analysis. To adjust this bias, a trim-and-fill method illustrated by Duval and Tweedie [26] was utilized (Figure 5B). As a result, the conclusion with or without the trim-and-fill method did not change, which indicated that our results were statistically robust. While all models of rs2910164 and rs3746444 didn’t show any publication bias (P.0.05) (shown in Table 5).
Discussion
As we all know, the association between the SNPs in protein-coding genes and the risk of cancer has been explained thoroughly, little cancer association studies concerning miRNA SNPs have been reported. In the present case-control study, associations of three miRNA polymorphisms (miR-146aG.C, rs2910164;miR-196a2C.T, rs11614913; miR-499A.G, rs3746444;) and cancer susceptibility were estimated. The polymorphisms of these three miRNAs may influence the effect of their targets, which contributed to the tumorigenesis, development and prognosis of many cancers. It is believed that tumor necrosis factor receptor-associated factor 6 and interleukin-1 receptor-receptor-associated kinase 1 are two potential targets of miR-146a [27], which could decrease the levels of these two proteins and reduce the activity of the
NF-kB signaling pathway involving in tumorigenesis [28]. The main
targets of miR-196a2 are homeobox (HOX) gene cluster and Annexin A1 (ANXA1). HOX genes include HOXB8, HOXC8, HOXD8, and HOXA7, which are known regulators of oncogen-esis [29]. Meanwhile, ANXA1 is known as a mediator of apoptosis and an inhibitor of cell proliferation [30]. MiR-499 mainly targets to transcriptional repressor SOX6 [31], which reduce the level of
Figure 4. Forest plots of effect estimates for rs3746444 stratified by country (GG+GA vs AA).For each studies, the estimate of OR and its 95% CI is plotted with aboxand ahorizontal line.Filled diamondpooled OR and its 95% CI.
doi:10.1371/journal.pone.0065123.g004
MicroRNA Polymorphisms Effect on Cancer Risk
Table 4.Stratified analyses of the miR-499A.G (rs3746444) polymorphism and cancer risk.
Variables na GG vs AA GA vs AA GG+GA vs AA GG vs AA+GA G allele vs A allele
OR(95%CI) Pb I2 OR(95%CI) Pb I2 OR(95%CI) Pb I2 OR(95%CI) Pb I2 OR(95%CI) Pb I2
Total 13 1.25(1.03,1.52) 0.073 39.1 1.28(1.08,1.53)c 0.000 71.1 1.27(1.08.1.50)c 0.000 69.4 1.07(0.80,1.44)c 0.013 52.8
1.18(1.04,1.34)c 0.000 65.7
Cancer type
HCC 3 1.25(0.36,4.34)c 0.023 73.6 1.00(0.76,1.31) 0.074 61.6 1.12(0.63,1.99)c 0.009 78.8 1.51(0.87,2.62) 0.062 64.0 1.13(0.64,2.01)c 0.001 85.0
Breast cancer 2 1.50(0.98,2.30) 0.157 50.0 1.57(0.83,2.95)c 0.044 75.4 1.31(1.09,1.57) 0.182 43.8 0.97(0.29,3.19)c 0.019 81.7 1.26(1.08,1.47) 0.760 0.0
Other cancers 8 1.14(0.90,1.44) 0.334 12.3 1.32(1.05,1.67)c 0.000 76.7 1.29(1.05,1.59)c 0.001 73.0 1.02(0.81,1.28) 0.092 43.0 1.18(1.02,1.37)c 0.006 64.9
Country
China 6 1.54(0.93,2.56)c 0.029 59.8 1.36(1.06,1.75)c 0.002 74.0 1.40(1.08,1.82)c 0.000 77.9 1.41(1.06,1.87)c 0.050 54.8 1.36(1.07,1.72)c 0.000 79.8
Korea 2 0.81(0.41,1.59) 0.366 0.0 0.94(0.74,1.19) 0.126 57.2 0.93(0.74,1.17) 0.098 63.5 0.83(0.42,1.62) 0.461 0.0 0.93(0.76,1.14) 0.103 62.4
North India 3 1.02(0.70,1.50) 0.439 0.0 1.46(0.95,2.22)c 0.038 69.4 1.33(1.07,1.66) 0.150 47.3 0.83(0.58,1.18) 0.110 54.6 1.13(0.96,1.33) 0.726 0.0
Other countries 2 1.27(0.82,1.97) 0.293 9.5 1.44(0.62,3.35)c 0.010 85.0 1.14(0.91,1.41) 0.059 72.0 0.91(0.32,2.58)c 0.040 76.3 1.11(0.93,1.33) 0.728 0.0
Source of controls
Population based 11 1.17(0.94,1.44) 0.115 35.4 1.27(1.05,1.54)c 0.000 68.5 1.24(1.04,1.47)c 0.002 64.8 0.98(0.71,1.34)c 0.027 50.6 1.14(1.00,1.29)c 0.012 56.1
Hospital based 2 1.70(1.09,2.67) 0.121 58.3 1.35(0.70,2.58)c 0.002 89.5 1.43(0.76,2.69)c 0.002 89.9 1.67(1.07,2.61) 0.176 45.4 1.44(0.82,2.52)c 0.002 89.7
HCC: hepatocellular carcinoma.
aNumber of included studies.
bPvalue ofQtest for heterogeneity test.
cRandom-effect model was used when P value for heterogeneity,0.05; otherwise, fixed-effect model was used.
Statistically significant results were in bold. doi:10.1371/journal.pone.0065123.t004
MicroRNA
Polymorp
hisms
Effect
on
Cancer
Risk
PLOS
ONE
|
www.ploson
e.org
13
June
2013
|
Volume
8
|
Issue
6
|
fibroblast growth factor (FGF)-3 affecting cell proliferation and differentiation [32,33]. In this meta-analysis, 31 eligible studies were enrolled to assess the association between three miRNA
polymorphisms and cancer risk. We demonstrated that rs2910164 C allele, rs3746444 A allele and rs11614913 TT genotype were associated with significantly decreased risk of cancer.
Figure 5. Begg’s funnel plot of Egger’s test for publication bias test for rs.Eachcirclerepresents as an independent study for the indicated association. Log[OR], natural logarithm of OR.Horizontal linesmean effect size. A: Begg’s funnel plot of publication bias test. B : Begg’s funnel plot of publication bias test after trim-and-fill method.
doi:10.1371/journal.pone.0065123.g005
Table 5.Egger’s test for three polymorphisms of miRNAs.
Polymorphism Egger’s test Homozygote Heterozygote Dominant Recessive
rs11614913 t 0.44 1.81 2.15 20.92
P 0.662 0.086 0.045 0.369
rs2910164 t 0.08 0.32 0.39 20.32
P 0.939 0.755 0.700 0.753
rs3746444 t 20.36 1.86 1.6 20.55
P 0.727 0.089 0.138 0.590
Statistically significant results which means the shape of the funnel plot indicated obvious asymmetry were in bold. doi:10.1371/journal.pone.0065123.t005
MicroRNA Polymorphisms Effect on Cancer Risk
Former studies regarding G to C variation in the miR-146a precursor showed that G-allelic miR-146a precursor displayed increased production of mature miR-146a compared with C-allelic and G allele in rs2910164 was associated with the predisposition of several cancers [18,34,35]. In overall pooled results from 21 studies, we concluded rs2910164 C allele was associated with decreased cancer risk. Furthermore, stratified analyses by cancer type revealed that rs2910164 CC genotype reduced risk of HCC, cervical cancer and prostate cancer, however no significant associations were observed in breast cancer and gastric cancer, which indicated that rs2910164 polymorphism might have different effects in distinct cancers. The results were consistent with the previous studies [13,18,36,37]. While disac-cords appeared in gastric cancer [14,38,39]. Inconsistent results might be caused by limited studies enrolled in this meta-analysis. Different study design and approach to select participants should also be taken into account. Followed stratified analyses by country indicated decreased cancer risk were discovered only in Chinese population, which reflected differences in genetic background and the environment exposured might produce different effects on cancer risk. At last, source of controls and genotyping method stratified analyses were also conducted in this meta-analysis. The results showed that different sources and methods could play different roles in cancer risk. As age and gender are risk factors for many cancers, which must be considered in this meta-analysis. The study conducted by Zeng et al [38] concluded that rs2910164 GG+GC genotype among males and subjects aged#58 years was associtated with increased gastric cancer risk. The similar phenomenon was observed in the study by Zhou et al [39], which showed elevated gastric cancer risk was more evident among younger subjects (,65 years) with rs2910164 GG genotype. However, they observed no significant difference in the stratifica-tion of sex. As age increases, accumulated exposure to environ-mental carcinogens and genomic alterations would facilitate carcinogenesis [39]. Therefore, the age is believed to be an important risk factor for cancers, which was inconsistent with our results. More genomic alterations and environmental carcinogens may contribute to late-onset gastric cancer and stratification analysis by age should be more cautious. As for the pre-miR-146a sex-specific effect, the exact mechanism remains unclear. There-fore, well-designed, unbiased, large case-control studies were urgently needed to achieve a more accurately result.
Recently, rs11614913 polymorphism in pre-miRNAs has been reported to contribute to susceptibility of breast cancer [13], lung cancer [10], glioma [16], and influence survival of non-small cell lung cancer [40] by altering the expression of mature miR-196a and its binding to target mRNA. Our results showed that TT genotype was associated with decreased risk of CRC, breast cancer and lung cancer, which was consistent with previous findings [20,23,41,42]. The controversy between our study were also apparent, no correlations were achieved between rs11614913 polymorphism and susceptibility of HCC and gastric cancer, while Li et al [12] and Okubo et al [14] presented contrary opinions respectively. In addition, contrast to Chinese and Korean population, rs11614913 CT genotype trend to increase cancer risk in North Indian population. Based on the above points, we deduced that cancer type and country differences made rs11614913 polymorphism have distinct effects. Cancer was a complex disease, and numerous factors would lead to tumorigen-esis. Meanwhile, different cancers had different pathogentumorigen-esis. Therefore, rs11614913 polymorphism might have distinct effects according to cancer types. Inconsistent results about different countries might be caused by differences in living habit, genetic
background and the environment. In addition, this meta-analysis enrolled only 21 studies for rs11614913 polymorphism, inadequate study would be an influence factor. At the same time, the results also showed that different sources and methods contributed to different cancer risk. To further reveal the association between rs11614913 polymorphism and cancer risk, more well-designed studies based on homogeneous cancer patients and unbiased larger sample sizes were wanted.
As for rs3746444 G allele, an increased cancer risk was discovered in the pooled analysis. And subgroup analyses of cancer type and country showed that rs3746444 G allele association with increased risks were observed in breast cancer and Chinese population respectively. Meanwhile, a significant association was also observed for comparison of GG+GA vs AA in North Indian population. The results suggested different cancer types and countries could lead to distinct effects of rs3746444 polymorphism. Hu et al [13] showed that significantly increased breast cancer risk was associated with variant genotypes of hsa-mir-499 rs3746444 in Chinese women, which consistent with our results. Finally,source of controls stratified analysis was also conducted. The results indicated distinct source of controls was also an important influence factor to affect the association between rs3746444 polymorphism and cancer risk. However, the results were based on 13 studies enrolled in the analysis, which could affect the results owing to small amount of studies. To draw a more precise conclusion, more related studies needed.
According to the test of heterogeneity conducted above, it’s not difficult to perceive different countries contributed to heterogene-ity of rs11614913 and rs2910164 polymorphisms, which indicated miRNAs might play different roles according to countries. Meanwhile, different cancer types were also a main factor contributed to heterogeneity. Significantly decreased associations were found mainly in HCC, lung cancer, cervical cancer, which suggested miRNAs might have different affections in different cancer types.
After all, this meta-analysis still existed some limitations. Firstly, publication bias which we have detected in rs11614913 polymor-phism, and in other polymorphisms publication bias might also exist while we didn’t detect owing to quantitative restrictions of studies. Secondly, there was no uniform definition of controls, although most of the controls were mainly selected from healthy populations, a few of them were patients. Thirdly, the detailed information (such as age, sex, menstrual history, life-style and environmental factors) was not considered so that our unadjusted estimates should be confirmed by further studies.
In conclusion, this meta-analysis measured the association of three miRNA polymorphisms and cancer risk. We observed TT genotype of rs11614913 polymorphism was associated with decreased cancer risk, especially for CRC and lung cancer in Korean and North Indian population. Moreover, rs2910164 C allele was associated with decreased overall cancer risk especially for HCC, cervical cancer and prostate cancer risk in Chinese population. Whereas, rs3746444 G allele was a risk factor in Chinese population, especially for breast cancer. However, further studies based on larger, stratified population to facilitate evaluation the association between miRNAs and cancer risk.
Author Contributions
Conceived and designed the experiments: SKW BSH. Performed the experiments: LG YQX YUP RL TYG ZLN LPC GQS. Analyzed the data: BSH YQX. Contributed reagents/materials/analysis tools: LG YQX. Wrote the paper: SKW BSH YQX LG.
MicroRNA Polymorphisms Effect on Cancer Risk
References
1. Lagos-Quintana M, Rauhut R, Lendeckel W, Tuschl T (2001) Identification of novel genes coding for small expressed RNAs. Science 294: 853–858. 2. Lau NC, Lim LP, Weinstein EG, Bartel DP (2001) An abundant class of tiny
RNAs with probable regulatory roles in Caenorhabditis elegans. Science 294: 858–862.
3. Lee Y, Kim M, Han J, Yeom KH, Lee S, et al. (2004) MicroRNA genes are transcribed by RNA polymerase II. EMBO J 23: 4051–4060.
4. Borchert GM, Lanier W, Davidson BL (2006) RNA polymerase III transcribes human microRNAs. Nat Struct Mol Biol 13: 1097–1101.
5. Wienholds E, Plasterk RH (2005) MicroRNA function in animal development. FEBS Lett 579: 5911–5922.
6. Chen JF, Mandel EM, Thomson JM, Wu Q, Callis TE, et al. (2006) The role of microRNA-1 and microRNA-133 in skeletal muscle proliferation and differen-tiation. Nat Genet 38: 228–233.
7. Brennecke J, Hipfner DR, Stark A, Russell RB, Cohen SM (2003) bantam encodes a developmentally regulated microRNA that controls cell proliferation and regulates the proapoptotic gene hid in Drosophila. Cell 113: 25–36. 8. Cimmino A, Calin GA, Fabbri M, Iorio MV, Ferracin M, et al. (2005) miR-15
and miR-16 induce apoptosis by targeting BCL2. Proc Natl Acad Sci U S A 102: 13944–13949.
9. Hatfield SD, Shcherbata HR, Fischer KA, Nakahara K, Carthew RW, et al. (2005) Stem cell division is regulated by the microRNA pathway. Nature 435: 974–978.
10. Tian T, Shu Y, Chen J, Hu Z, Xu L, et al. (2009) A functional genetic variant in microRNA-196a2 is associated with increased susceptibility of lung cancer in Chinese. Cancer Epidemiol Biomarkers Prev 18: 1183–1187.
11. Min KT, Kim JW, Jeon YJ, Jang MJ, Chong SY, et al. (2012) Association of the miR-146aC.G, 149C.T, 196a2C.T, and 499A.G polymorphisms with colorectal cancer in the Korean population. Mol Carcinog 51 Suppl 1: E65–73. 12. Li XD, Li ZG, Song XX, Liu CF (2010) A variant in microRNA-196a2 is associated with susceptibility to hepatocellular carcinoma in Chinese patients with cirrhosis. Pathology 42: 669–673.
13. Hu Z, Liang J, Wang Z, Tian T, Zhou X, et al. (2009) Common genetic variants in pre-microRNAs were associated with increased risk of breast cancer in Chinese women. Hum Mutat 30: 79–84.
14. Okubo M, Tahara T, Shibata T, Yamashita H, Nakamura M, et al. (2010) Association between common genetic variants in pre-microRNAs and gastric cancer risk in Japanese population. Helicobacter 15: 524–531.
15. Chu YH, Tzeng SL, Lin CW, Chien MH, Chen MK, et al. (2012) Impacts of microRNA gene polymorphisms on the susceptibility of environmental factors leading to carcinogenesis in oral cancer. PLoS One 7: e39777.
16. Dou T, Wu Q, Chen X, Ribas J, Ni X, et al. (2010) A polymorphism of microRNA196a genome region was associated with decreased risk of glioma in Chinese population. J Cancer Res Clin Oncol 136: 1853–1859.
17. George GP, Gangwar R, Mandal RK, Sankhwar SN, Mittal RD (2011) Genetic variation in microRNA genes and prostate cancer risk in North Indian population. Mol Biol Rep 38: 1609–1615.
18. Xu T, Zhu Y, Wei QK, Yuan Y, Zhou F, et al. (2008) A functional polymorphism in the miR-146a gene is associated with the risk for hepatocellular carcinoma. Carcinogenesis 29: 2126–2131.
19. Chen H, Sun LY, Chen LL, Zheng HQ, Zhang QF (2012) A variant in microRNA-196a2 is not associated with susceptibility to and progression of colorectal cancer in Chinese. Intern Med J 42: e115–119.
20. Zhu L, Chu H, Gu D, Ma L, Shi D, et al. (2012) A functional polymorphism in miRNA-196a2 is associated with colorectal cancer risk in a Chinese population. DNA Cell Biol 31: 350–354.
21. Zhou J, Lv R, Song X, Li D, Hu X, et al. (2012) Association between two genetic variants in miRNA and primary liver cancer risk in the Chinese population. DNA Cell Biol 31: 524–530.
22. Zhang M, Jin M, Yu Y, Zhang S, Wu Y, et al. (2012) Associations of miRNA polymorphisms and female physiological characteristics with breast cancer risk in Chinese population. Eur J Cancer Care (Engl) 21: 274–280.
23. Alshatwi AA, Shafi G, Hasan TN, Syed NA, Al-Hazzani AA, et al. (2012) Differential expression profile and genetic variants of microRNAs sequences in breast cancer patients. PLoS One 7: e30049.
24. Srivastava K, Srivastava A, Mittal B (2010) Common genetic variants in pre-microRNAs and risk of gallbladder cancer in North Indian population. J Hum Genet 55: 495–499.
25. Kim WH, Min KT, Jeon YJ, Kwon CI, Ko KH, et al. (2012) Association study of microRNA polymorphisms with hepatocellular carcinoma in Korean population. Gene 504: 92–97.
26. Duval S, Tweedie R (2000) Trim and fill: A simple funnel-plot-based method of testing and adjusting for publication bias in meta-analysis. Biometrics 56: 455– 463.
27. Taganov KD, Boldin MP, Chang KJ, Baltimore D (2006) NF-kappaB-dependent induction of microRNA miR-146, an inhibitor targeted to signaling proteins of innate immune responses. Proc Natl Acad Sci U S A 103: 12481– 12486.
28. Punj V, Matta H, Schamus S, Tamewitz A, Anyang B, et al. (2010) Kaposi’s sarcoma-associated herpesvirus-encoded viral FLICE inhibitory protein (vFLIP) K13 suppresses CXCR4 expression by upregulating miR-146a. Oncogene 29: 1835–1844.
29. Wynter CV (2006) The dialectics of cancer: A theory of the initiation and development of cancer through errors in RNAi. Med Hypotheses 66: 612–635. 30. Yang YC, Wang SW, Wu IC, Chang CC, Huang YL, et al. (2009) A tumorigenic homeobox (HOX) gene expressing human gastric cell line derived from putative gastric stem cell. Eur J Gastroenterol Hepatol 21: 1016–1023. 31. Sluijter JP, van Mil A, van Vliet P, Metz CH, Liu J, et al. (2010) MicroRNA-1
and -499 regulate differentiation and proliferation in human-derived cardiomy-ocyte progenitor cells. Arterioscler Thromb Vasc Biol 30: 859–868. 32. Murakami A, Ishida S, Thurlow J, Revest JM, Dickson C (2001) SOX6 binds
CtBP2 to repress transcription from the Fgf-3 promoter. Nucleic Acids Res 29: 3347–3355.
33. Jakobovits A, Shackleford GM, Varmus HE, Martin GR (1986) Two proto-oncogenes implicated in mammary carcinogenesis, int-1 and int-2, are independently regulated during mouse development. Proc Natl Acad Sci U S A 83: 7806–7810.
34. Jazdzewski K, Murray EL, Franssila K, Jarzab B, Schoenberg DR, et al. (2008) Common SNP in pre-miR-146a decreases mature miR expression and predisposes to papillary thyroid carcinoma. Proc Natl Acad Sci U S A 105: 7269–7274.
35. Lung RW, Wang X, Tong JH, Chau SL, Lau KM, et al. (2012) A single nucleotide polymorphism in microRNA-146a is associated with the risk for nasopharyngeal carcinoma. Mol Carcinog.
36. Zhou B, Wang K, Wang Y, Xi M, Zhang Z, et al. (2011) Common genetic polymorphisms in pre-microRNAs and risk of cervical squamous cell carcinoma. Mol Carcinog 50: 499–505.
37. Xu B, Feng NH, Li PC, Tao J, Wu D, et al. (2010) A functional polymorphism in Pre-146a gene is associated with prostate cancer risk and mature miR-146a expression in vivo. Prostate 70: 467–472.
38. Zeng Y, Sun QM, Liu NN, Dong GH, Chen J, et al. (2010) Correlation between pre-miR-146a C/G polymorphism and gastric cancer risk in Chinese population. World J Gastroenterol 16: 3578–3583.
39. Zhou F, Zhu H, Luo D, Wang M, Dong X, et al. (2012) A functional polymorphism in Pre-miR-146a is associated with susceptibility to gastric cancer in a Chinese population. DNA Cell Biol 31: 1290–1295.
40. Hu Z, Chen J, Tian T, Zhou X, Gu H, et al. (2008) Genetic variants of miRNA sequences and non-small cell lung cancer survival. J Clin Invest 118: 2600–2608. 41. Zhan JF, Chen LH, Chen ZX, Yuan YW, Xie GZ, et al. (2011) A functional variant in microRNA-196a2 is associated with susceptibility of colorectal cancer in a Chinese population. Arch Med Res 42: 144–148.
42. Hong YS, Kang HJ, Kwak JY, Park BL, You CH, et al. (2011) Association between microRNA196a2 rs11614913 genotypes and the risk of non-small cell lung cancer in Korean population. J Prev Med Public Health 44: 125–130.
MicroRNA Polymorphisms Effect on Cancer Risk