165
www.e-afr.org
Genetic diversity in Populus nigra plantations from
west of Iran
A. Alimohamadi, F. Asadi, R.T. Aghdaei
Alimohamadi A., Asadi F., Aghdaei R.T., 2012. Genetic diversity in Populus nigra plantations from west of Iran. Ann. For. Res. 56(1): 165-178, 2012.
Abstract. In order to adopt strategies for forest conservation and develop-ment, it is necessary to estimate the amount and distribution of genetic di-versity in existing populations of poplar in Iran. In this study, the genetic diversity between eight stands of Populus nigra established in Kermanshah province was evaluated on the basis of molecular and morphological mark-ers. To amplify microsatellite loci (WPMS09, WPMS16 and WPMS18), DNA extraction from young and fresh leaveswas done. Various conditions of the PCR assay were examined and to evaluate the morphological vari-ation of the morphological characters leaves (consist of 19 traits) were measured. In addition, height growth was measured, to evaluate the growth function of the stands in homogeneous conditions. Genetic diversity in term of polymorphic loci was 0%, because three investigated microsatellite loci were monomorphic. The total number of alleles for 3 microsatellite loci was 6 (na = 2, ne = 2, heo = 1, hee = 0.51). Genetic identity based on Nei was 100%, so genetic distance was 0%. The whole sampled trees rep-resented the same thus the genotype. No significant differences between the mean values of all morphological characters and height growth were revealed. Observed genetic similarity gave indication that same ramets had been selected to plant in poplar plantation established in Kermanshah prov-ince. These results suggest the need for an initial evaluation of the genetic diversity in selected ramets for planting in plantation to avoid repetition. Keywords genetic inventory, microsatellite markers, leaf traits, height growth, Populus nigra, Iran.
Authors. Afrooz Alimohamadi ([email protected]) - Forest Genetic, Is-lamic Azad University, Hesarak Ave, Tehran, Iran, Farhad Asadi - Scientifi c board member of Research Institute of Forest and Rangelands, P.O. Box 13185-116, Te-hran, Iran, Reza Tabaie Aghdaei - Scientifi c board member of Research Institute of Forest and Rangelands, P.O. Box 13185 -116, Tehran, Iran.
Introduction
Hyrcanian forests (established in the north of Iran), are relics from the Tertiary and they are rich in species including rare, threatened and endemic species (over 80 trees and 50 shrubs species are recognized)(Mohajer 2006). They are the only commercial forests in Iran and because of their importance and for achieving sustainable forestry, it is essential that an alter-native source for wood production have been appreciated. Poplar plantations can be consid-ered as an appropriate alternative, due to its properties, like wide geographical distribution in Iran, fast growth, ease of propagation and good economical revenue. The genus Popu-lus L. (Salicaceae), in addition to its value for wood products, provides a range of ecological services, including carbon sequestration, biore-mediation, nutrient cycling, and biofi ltration (Brenner et al. 2004, Taylor 2002). Because of these, Populus species, especially Populus ni-gra, have been planted in Iran for many years, one of the main regions of Populus nigra cuti-vations is being Kermanshah province (Nori et al, 2008). In Iran, genetic diversity of Populus nigra stands has been endangered by vegeta-tive propagation, because the reduction of the level of genetic diversity (Asadi et al. 2005). Genetic diversity is a basic necessity for spe-cies, to evolve in their changing environment. The basic prerequisite for genetic improve-ment and protection of genetic resources is the study of genetic variability (Bakshi & Kon-nert 2011). It is essential to assess the amount and distribution of genetic diversity in existing black poplar stands in this region. Molecular genetic is a keystone to evaluate the genetic diversity of P. nigra populations (Gaudet et al. 2008). Microsatellite markers or simple se-quence repeats (SSRs) are co-dominant molec-ular markers, and the most appropriate mark-ers for population genetic studies and clone identifi cation (Suvanto & Latva-Karjanmaa 2005). Molecular markers have been applied to assess genetic diversity of natural or
breed-ing poplar populations (Lefevre et al. 2002, Suvanto & Latva-Karjanmaa 2005, Li et al. 2006, Smulders et al. 2008b). These are also useful for differentiating and detecting clones, cultivars, varieties, hybrids and species (Chen et al. 2007, Jianming et al. 2007, Smulders et al. 2008a), investigating gene fl ow (Fossati et al. 2003, Imbert & lefevre 2003, Rathmacher et al. 2010), detecting probable introgression (Krystufek et al. 2002) and for investigating mating systems (Smulders et al. 2002, Vanden Broeck et al. 2002).
In addition to the molecular markers, there are other markers used to estimate diversity, such as the morphological markers. In the same environment, it is possible to assess the genetic diversity based on leaf characteristics (Storme et al. 2002). There are some studies on the development of morphological markers for assessing diversity in poplar populations (Lopez et al. 2004, Asadi et al. 2005, Ballian et al. 2006). These markers can be used as tools for defi ning in situ conservation units in en-dangered or marginal populations (Lopez et al. 2004) and for separating various populations (Calagari et al. 2006).
167
Materials and methods
Site description
Kermanshah province is located on 34°23’N/ 47°03’ E, northwest Iran. The average eleva-tion is 1200 m above sea level. Kermanshah is a mountainous area, with mean annual rainfall ranging 400 to 500 mm. Mean annual tempera-ture of 14o C and
Plant material and experimental design
A total of 24 individuals of P. nigra (3 indi-viduals per stand) were sampled from 8 artifi -cial stands in Kermanshah province. Sampled stands separated by a distance of more than 3.5 km, in order to retain independence. Lo-cation of Kermanshah province and position of selected stands are shown in Figure 1, geo-graphical and soil characteristics of the sam-pling stands are shown in Table 1. Cuttings of the sampled trees were collected during the winter. In order to have a homogeneous mate-rial, the cuttings were grown in the nursery for one growing season. Following the successful propagation, they were established in a fi eld
trial, as a randomized complete block design with 3 replications.
Microsatellites analysis
For DNA extraction, young, not fully expand-ed, leaves were collected for each ramet, a to-tal of 24 ramets: 3 ramets per stand (8 stands in total), frozen immediately in liquid nitrogen and stored at -20˚C. DNA extraction was done with Sarkosyl method (Apples 1997). DNA concentration was determined by agarose gel electrophoresis and ethidium bromide stain-ing. Samples were analyzed on 3 microsatel-lite loci: WPMS09, WPMS16, WPMS18 (Van der Schoot et al. 2000, Smulders et al. 2001) to provide multilocus genotype for each indi-vidual (Table 2). In order to optimize the PCR assay and to create large amounts of a desired product, seven protocols and two thermal pro-fi les were examined (Table 3). The fi rst pro-tocol (propro-tocol no. 1, Table 3) was based on other fi ndings (Van der Schoot et al. 2000, Smulders et al. 2001, Asadi et al. 2005), but for reason of producing allelic patterns with a poor quality, some modifi cations in the vol-umes of PCR reaction components were made
Location of Kermanshah province in Iran (right) and position of selected stands (■) in Kerman-shah province (left).
experimentally, to improve the product yield and quality (protocols no. 2 to no. 7, Table 3). The amplifi cation products were separated in a 1.5% high-resolution agarose gel, for picking the best protocol. Because of producing high yields of desired PCR product, the seventh protocol was known as the best one, so it was applied to do PCR for all extracted DNA. The amplifi ed PCR products were separated on 6 % w/v denaturing polyacrylamide gels (National Diagnostics).
Morphological analysis
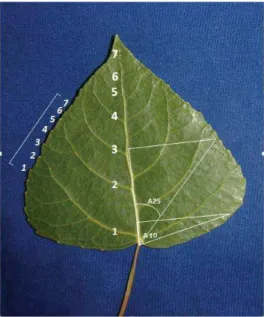
In middle August 9, fully expanded leaves in the central part of per ramet (a total of 24 ra-mets, 3 ramets per stand) were randomly col-lected and pressed (a total of 216 leaves). The following leaf morphological characters were measured manually: the angle between the sec-ond lower lateral vein and midrib (β), the angle between the fi rst lower lateral vein and midrib (α), the angle at 10% of leaf length (A10), the angle at 25% of the leaf length (A25), the apex
The geographical and soil characteristics of the sampling stands Table 1
Characterization of the microsatellite markers Table 2
Note: 1 - Quality 1, weak stutter bands, well scorable Stand code Sample
size (m²)
Altitude (m)
pH of paste
Organic carbon (%)
Total nitrogen (%)
Sand (%)
Silt (%)
Clay (%)
Soil texture
1 11300 1325 7.1 3.3 0.3 8 44 48 Silt-Clay
2 11080 1400 7.3 2.1 0.2 29 44 27 Loam
3 10120 1720 7.6 1.2 0.1 19 38 43 Clay
4 9520 1680 7.6 2.2 0.2 18 39 43 Clay
5 11800 1690 7.5 2.9 0.3 13 45 42 Silt-Clay
6 11960 1850 7.6 1.1 0.1 10 46 44 Silt-Clay
7 6040 1390 7.5 2.1 0.2 24 44 32 Clay-Loam
8 6100 1460 7.8 1.3 0.1 32 33 35 Clay-Loam
Reference
Quality of patterns in P. nigra
Expected product length
Allelic range
Primer sequences
(forward, reverse) Repeat Locus
Van der Schoot et al. (2000)
1 295
246-298
F: 5’ –CTGCTTGCTACCGTGG R: 5’-AAGCAATTTGGGTCTGA GTATCTG-3’
(GT)21
(GA)24 WPMS09
Smulders et
al. (2001) 1 158
131-166
F: 5’-CTCGTACTATTTCCGATG TGACC-3’ R:5’-
AGATTATTAGGTGGGCCA AGGACT-3’
(GTC)8
(ATCCTC)5WPMS16
Smulders et
al. (2001) 1 245
217-253
F: 5’-CTTCACTAGGACATAGCA GCATC-3’
R: 5’-CACCAGAGTCATCACC AGTTATTG-3’
169 angle (AA), the base angle (BA), the leaf length
(LL), the leaf width (LW), distance between the leaf widest part and the leaf base (DBW), the ratio between leaf length and leaf width (LR), the petiole length (LP), the ratio between peti-ole length and leaf length (PR), the leaf width at 50% of leaf length (BW50), the leaf width at 90% of leaf length (BW90), the leaf width at 1 cm from the leaf tip (LT), the leaf area (LA), the number of teeth on the middle one third of the leaf edge (NT), the depth of teeth on middle one third of the leaf edge (DT), the number of veins (NV). Presentation of the mea-sured leaf morphological traits were shown in Figures 2, 3 and 4.
The height from ground level to the base of the apical bud on the terminal shoot (H) was measured on 1 June and 1 September, in order to measure height growth.
Data analysis
For the data analysis in the molecular study, an alphabetical letter was assigned to each al-lele. Alphabet was started with the uppercase A letter for the largest one. This process avoids the need to estimate the exact size in terms of base pairs of each allele; moreover the data recorded can be directly used for population studies when a software package such as POP-GENE 1.32 is employed (Fossati et al. 2005).
The genetic parameters (average number of observed alleles, expected alleles, observed heterozygosity, expected heterozygosity, ge-netic identity based on Nei and proportion of sample required to represent all genotypes) were obtained via POPGENE 1.32 software. In order to compare the means of morpho-logiacal traits and the height growth of every population, an analysis of variance was done using MSTATC computer software. To sum-marize the variability of different morphologi-cal traits, as well as the relationships between traits, a multivariate analysis (Principal Com-ponent Analysis-PCA) was performed using SPSS 16. After Varimax axis rotation, compo-nent scores and PC loadings were determined.
Results
Analysis of molecular markers
Results of employing different PCR proto-cols showed that four protoproto-cols (1 to 4) did not produce any bands. Two protocols (5 & 6) produced some faint unspecifi c bands but PCR protocol 7 gave best results without any un-specifi c bands. The analysis of three loci used in the microsatellite analysis indicated het-erozygosity in all produced bands but all loci were monomorphic (Figure 5) so this analysis
Concentrates and volumes of PCR reaction components for seven protocols and steps of two ther-mal profi les used in PCR reaction
Table 3
Variables Template DNA
Taq DNA
polymerasedNTP Primer
MgCl2
Buffer WaterTotal volume
Amplifi cation condition2 Concentrates
& volumes protocols
C ng
V μL
C unit
V μL
C mM
V μL
C pmol/μL
V μL
C mM
V μL
C x
V μL
V μL
V μL
identifi ed one genotype in all sampled trees of 8 stands. Proportion of sample required to rep-resent all genotypes was 0.04 (1 genotype out of 24 trees).
The average number of observed alleles (na), expected alleles (ne), observed heterozy-gosity (heo) and expected heterozyheterozy-gosity (hee) are shown in Table 4. Genetic identity, based on Nei, was 100%, so the genetic distance was 0%. The genetic diversity assessed in terms of the number of alleles per locus, was low. The total number of alleles for 3 microsatellite loci was 6: M and b alleles in WPMS09 locus, D and F alleles in WPMS16 locus I and J alleles in WPMS18 locus. These results are in contrast to the results of several researches which have shown a higher frequency of alleles in Populus nigra stands, such as the work of Cottrell et al.
(2002) which based on the three microsatellite loci (WPMS09, WPMS16 and WPMS18, the same loci as the loci used in the present study) revealed 15 alleles: Z, W, Q, B, T, X, e and a alleles in WPMS09 locus, E, G and H alleles in WPMS16 locus and G, D, H and I alleles in WPMS18 locus and based on these alleles revealed 15 different genotypes whereas in the present study was shown that all sampled trees represent a genotype.
Analysis of morphological traits
The results of taking the measurements of leaf morphological characters indicated that leaf area (LA) varied from 39.3 cm² (in stand K3) to 12.1 cm² (in stand K3). Leaf length (LL) ranged from 8.5 cm (in stand K3) to 5.1 cm (in
Presentation of the assessed leaf param-eters: length - (LL), leaf width - (LW), leaf width at 50% of leaf length - (BW50), leaf width at 90% of leaf length - (BW90), dis-tance between the leaf widest part and the leaf base - (DBW) leaf width at 1 cm from the leaf tip - (LT) and petiole length - (LP)
Figure 2 Presentation of the assessed leaf
171 stand K3). Leaf width (LW) ranged from 7.6
cm (in stand K8) to 3.9 cm (in stand K3). Peti-ole length (LP) varied from 4.0 cm (in stand K8) to 2.6 cm (in stand K3). Ratio between petiole length and leaf length (PR) varied from 0.5 (in stands K7 & K2) to 0.4 (in stand K8). Ratio between leaf length and leaf width (LR) varied from 1.4 (in stand K1) to 1.0 (in stand K8). Angle between the second lower lateral vein and midrib (β) ranged from 63.7 (in stand K3) to 50.0 (in stand K4). Angle between the
fi rst lower lateral vein and midrib (α) ranged from 63.9 (in stand K8) to 45.9 (in stand K7). Angle at 10% of leaf length (A10) ranged from 76.7 (in stand K8) to 63.3 (in stand K3). Angle at 25% of leaf length (A25) ranged from 63.0 (in stand K8) to 53.3 (in stand K3). Apex angle (AA) ranged from 45.1 (in stand K1) to 14.7 (in stand K6). Base angle (BA) ranged from 110.6 (in stands K8 & K3) to 61.1 (in stand K7). The largest and the smallest number of teeth on the middle one third of the leaf edge (NT) were
Revealed bands at the 3 different loci: WPMS09 (on the left), WPMS16 (on the mid) and WPMS18 (on the right) Figure 5
Presentation of the assessed leaf pa-rameters: apex angle - (AA), base angle - (BA), angle between the fi rst lower lat-eral vein and midrib - (α), and angle be-tween the second lower lateral vein and midrib - (β). Note: It is not possible to show these morphological traits in a fi g-ure: ratio between petiol length and leaf length - (PR), ratio between leaf length and leaf width - (LR) and leaf area - (LA) Figure 4
The mean value of observed and expected homo - and heterozygosities across all loci Table 4
Locus Sample size na ne heo hee
WPMS09 48 2 2 1 0.51
WPMS16 48 2 2 1 0.51
seen in stand K7 (21.1) and K3 (8.2), respec-tively. Depth of teeth on middle one third of the leaf edge (DT) varied from 2.4 cm (in stand K6) to 0.7 cm (in stand K6). Leaf width at 1 cm from the leaf tip (LT) ranged from 2.0 cm (in stand K1) to 0.9 cm (in stand K7). Distance between the leaf widest part and the leaf base (DBW) varied from 2.5 cm (in stand K7) to 1.5 cm (in stand K6). The largest and the smallest number of veins (NV) were seen in stand K8 (12.9) and K2 (9.4), respectively. Leaf width at 50% of leaf length (BW50) varied from 6.6 cm (in stand K8) to 3.2 cm (in stand K3) and leaf width at 90% of leaf length (BW90) var-ied from 1.2 cm (in stand K1) to 0.5 cm (in stand K8). The Bar charts of the means of dif-ferent foliar traits in the eight stands are shown in Table 5. The results of using analysis of variance showed no signifi cant differences be-tween mean values of the eight stands for all of the leaf morphological character (Table 6). As shown in Table 7 (the correlations
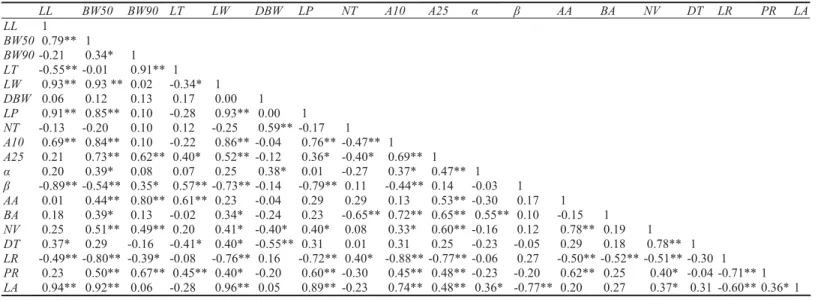
be-tween morphological traits) leaf width at 50% of leaf length (BW50) and angle at 25% of leaf length (A25) correlated with 14 traits. Leaf width (LW), ratio between leaf length and leaf width (LR) and angle at 10% of leaf length (A10) correlated with 13 traits. Number of veins (NV) correlated with 12 traits. Ratio be-tween petiole length and leaf length (PR) and leaf area (LA) correlated with 11 traits. Peti-ole length (LP) correlated with 10 traits. Leaf length (LL) correlated with 9 traits. Leaf width at 90% of leaf length (BW90), leaf tip (LT) and angle between the second lower lateral vein and midrib (β) correlated with 8 traits. Apex angle (AA) and leaf width at 1 cm from the base angle (BA) correlated with 7 traits. Angle between the fi rst lower lateral vein and midrib (α) correlated with 6 traits. Number of teeth on the middle one third of the leaf edge (NT) and depth of teeth on middle one third of the leaf edge (DT) correlated with 5 traits. Distance between the leaf widest part and the
The means and standard deviation (SD) of different foliar traits in the eight stands of Populus nigra
Table 5
Stands 1 2 3 4 5 6 7 8
Mean SD Mean SD Mean SD Mean SD Mean SD Mean SD Mean SD Mean SD
LL 6.38 0.39 6.40 0.32 6.50 0.89 6.75 0.70 6.88 0.61 6.53 0.78 6.62 0.61 6.62 0.92
BW50 4.54 0.62 4.35 0.35 4.46 0.84 4.69 0.78 4.68 0.62 4.46 0.86 4.59 0.67 4.68 1.06
BW90 0.80 0.24 0.72 0.10 0.74 0.16 0.76 0.15 0.71 0.09 0.68 0.20 0.77 0.21 0.77 0.21
LT 1.42 0.30 1.27 0.16 1.34 0.16 1.28 0.17 1.18 0.08 1.21 0.25 1.35 0.30 1.33 0.26
LW 5.24 0.59 5.09 0.41 5.21 0.99 5.63 0.88 5.64 0.78 5.29 1.04 5.37 0.76 5.48 1.20
DBW 1.97 0.17 1.92 0.18 1.94 0.17 1.92 0.21 1.96 0.19 1.97 0.27 2.02 0.24 1.95 0.20
LP 3.21 0.28 3.17 0.14 3.21 0.37 3.44 0.33 3.41 0.25 3.18 0.36 3.31 0.35 3.26 0.37
NT 11.31 0.71 11.91 1.01 11.25 1.33 11.21 1.20 11.36 1.37 11.52 1.22 12.41 3.42 11.68 1.94
A10 70.96 3.50 69.36 2.70 69.46 3.43 71.43 2.77 71.75 1.98 70.20 3.31 69.94 3.13 70.72 4.79
A25 58.19 2.15 56.42 1.57 56.85 1.63 57.83 1.76 57.43 1.90 56.72 2.04 56.83 1.71 58.43 2.43 α 57.00 2.49 55.32 1.96 56.72 4.25 55.49 3.19 57.31 1.60 56.56 3.11 56.22 4.39 57.17 4.19 β 59.46 2.36 59.30 1.89 58.62 3.54 58.17 3.79 57.96 2.33 58.67 2.71 58.41 2.17 59.06 1.21
AA 29.49 8.24 28.52 5.17 27.02 5.25 31.68 5.92 25.90 4.22 25.37 7.79 30.86 8.05 31.53 6.65
BA 93.65 8.17 89.85 6.60 89.84 8.31 90.74 8.38 93.67 8.37 89.58 9.86 87.70 11.43 91.36 10.40
LA 20.82 3.49 19.94 2.67 21.61 7.44 23.28 6.30 23.71 5.15 21.11 7.26 22.12 5.35 22.80 8.15
NV 10.70 0.80 10.78 0.85 10.63 0.94 10.84 0.43 10.72 0.62 10.57 0.77 10.70 0.83 10.91 1.01
DT 1.08 0.27 1.25 0.21 1.07 0.29 1.23 0.41 1.21 0.36 1.13 0.53 1.09 0.23 1.28 0.48
LR 1.23 0.11 1.27 0.05 1.27 0.06 1.21 0.07 1.24 0.08 1.26 0.10 1.25 0.08 1.24 0.10
173 leaf base (DBW) correlated with 4 traits.
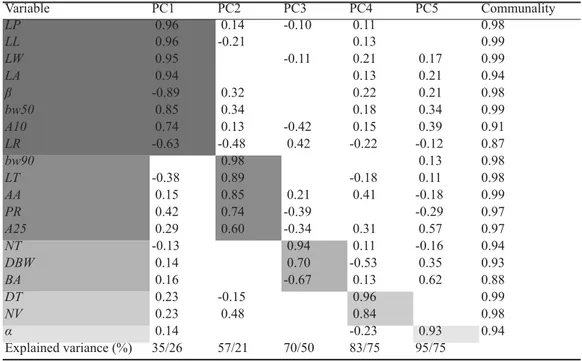
Principal component analysis reduced 19 input variables to 5 PCs, explaining 95/75% of the total variance. The relationship of the original variables with PCs is indicated by PC loadings (Table 8). Communality values for all factors were greater than 0.90 with the excep-tion of ratio between leaf length and leaf width (LR) and base angle (BA). Scores in PC1 were positively related to petiole length (LP), leaf length (LL), leaf width (LW), leaf area (LA), leaf width at 50% of leaf length (BW50) and angle at 10% of leaf length (A10) as well as negatively related to angle between the second lower lateral vein and midrib (β) and ratio be-tween leaf length and leaf width (LR). Petiole length (LP) was the more heavily weighted variable in PC1. Scores in PC2 were positive-ly related to leaf width at 90% of leaf length (BW90), leaf width at 1 cm from the leaf tip (LT), apex angle (AA), ratio between petiole length and leaf length (PR) and angle at 25% of leaf length (A25). Scores in PC3 were posi-tively related to number of teeth on the middle one third of the leaf edge (NT) and distance between the leaf widest part and the leaf base (DBW) as well as negatively related to base angle (BA). Scores in PC4 were positively related to depth of teeth on middle one third of the leaf edge (DT), number of veins (NV). Scores in PC5 were positively related to angle between the fi rst lower lateral vein and midrib (α). Plant height ranged from 84.9 cm (in stand K8) to 61.4 cm (in stand K6). There were no signifi cant differences between mean values of
height growth in all stands.
Discussion
The two marker systems (leaf morphology and microsatellites) to assess the genetic variation of Populus nigra plantations established in Kermanshah province of Iran showed similar results. That is, the analyzed 8 stands do not contain an appreciable amount of genetic di-versity.
Morphological analysis revealed no signifi -cant variation between poplar plantations (Ta-ble 5). In spite of these results, several other authors (Ballian et al. 2006, Gebhardt et al. 2002, Kajba & Romanic 2002) revealed sig-nifi cant differences between populations of P. nigra based on leaf morphological characters. Principal component analysis indicated that variation in all input variables was explained by 5 principal components. There are relation-ships among the whole of morphological traits (Table 6). This may show that similar genetic factors controls the studied leaf traits. The finding relationships between morphologi-cal traits are in agreement with othev fi ndings Safavi 2011, which has shown a high positive correlation between leaf width (LW) and peti-ole length (LP) in Populus euramericana and Populus deltoides.
The usefulness of leaf morphology for evaluating genetic diversity within popula-tions is not obvious yet. Some studies have already shown that it is possible to estimate
Inter-stands variability of the black poplar leaf morphological characters and height growth (F -value)
Table 6
Morphological and growth characters
characters β α A10 A25 AA BA LL
F- value 0.55ns 0.73ns 1.66ns 1.98ns 1.14ns 0.84ns 0.77ns
characters LW DBW LR LP PR BW50 BW90
F- value 0.75ns 0.27ns 0.76ns 1.53ns 0.41ns 0.40ns 0.57ns
characters LT LA NT DT NV H
or
. R
es. 56(1): 1
65-1 78, 20 12 R esear ch ar
Pearson coeffi cient of correlation between pairs of leaf morphological traits. (leaf length - LL, leaf width at 50% of leaf length - BW50, leaf width at 90% of leaf length - BW90, leaf width at 1 cm from the leaf tip - LT, leaf width - LW, distance between the leaf widest part and the leaf base - DBW, petiole length - LP, number of teeth on the middle one third of the leaf edge - NT, angle at 10% of leaf length - A10, angle at 25% of leaf length - A25, angle between the fi rst lower lateral vein and midrib - α, and angle between the second lower lateral vein and midrib - β, apex angle - AA, base angle - BA, number of veins - NV, depth of teeth on middle one third of the leaf edge - DT, ratio between leaf length and leaf width - LR, ratio between petiole length and leaf length - PR, and leaf area - LA
175 the genetic diversity based on leaf traits and
this marker is a useful tool in genetic variation studies (Alba et al. 2002, Storme et al. 2002). Safavi (2011) revealed also a signifi cant vari-ation among poplar genotypes for some mor-phological traits such as leaf width (LW) and petiole length (LP) and high heritability for the traits such as leaf length (LL), leaf width (LW) and petiole length (LP). On the other hand, it has been shown morphological markers is not useful for estimating genetic diversity because the plants with the same genetic composition (clones), grown in different fi eld tests differ signifi cantly for this characters, therefore the differences in morphology of the samples do not have a genetic basis (van Dom et al. 2002). In present research the result of using molecu-lar markers confi rmed the result of using leaf morphological characters, so this marker can be used as easy and cheap marker to fi nd out about genetic diversity initially. In fact mor-phological and molecular information does not
cancel each other out, but they support each other and one of the two cannot fully substitute the other (Fossati et al. 2005).
On the basis of microsatellite markers, ge-netic diversity in term of polymorphic loci was 0%. There are several studies that have been shown high level of genotypic diversity in poplar population based on microsatellite markers (Storme et al. 2002, Smulders et al. 2002, van Dam 2002), although it is not easy to compare different genetical studies because of the factors that may affect the fi ndings such as number and kind of loci. Proportion of sample required to represent all genotypes was 0.04. This is comparable to the obtained value in the work of Cottrell et al. (2002) which was 0.21. Whereas they expressed this value is the lowest proportion in comparison the results of other researches which had been shown almost every sampled tree represented a unique geno-type.
The total number of alleles for 3
microsatel-Principal components (PC) solution of 19 leaf morphological traits. The loadings are shown in gray scale; the communalities were determined after Varimax axis rotation
Table 8
Variable PC1 PC2 PC3 PC4 PC5 Communality
LP 0.96 0.14 -0.10 0.11 0.98
LL 0.96 -0.21 0.13 0.99
LW 0.95 -0.11 0.21 0.17 0.99
LA 0.94 0.13 0.21 0.94
β -0.89 0.32 0.22 0.21 0.98
bw50 0.85 0.34 0.18 0.34 0.99
A10 0.74 0.13 -0.42 0.15 0.39 0.91
LR -0.63 -0.48 0.42 -0.22 -0.12 0.87
bw90 0.98 0.13 0.98
LT -0.38 0.89 -0.18 0.11 0.98
AA 0.15 0.85 0.21 0.41 -0.18 0.99
PR 0.42 0.74 -0.39 -0.29 0.97
A25 0.29 0.60 -0.34 0.31 0.57 0.97
NT -0.13 0.94 0.11 -0.16 0.94
DBW 0.14 0.70 -0.53 0.35 0.93
BA 0.16 -0.67 0.13 0.62 0.88
DT 0.23 -0.15 0.96 0.99
NV 0.23 0.48 0.84 0.98
α 0.14 -0.23 0.93 0.94
lite loci was 6 (Table 4). This value is com-parable to the estimates obtained for P.nigra using the same microsatellite loci (7 allels in studied populations established in Iran, Asadi et al. 2005). In total whole sampled trees have the same genotype. These results with the re-sult of morphological markers showed the lev-el of genetic diversity present in the P. nigra populations established in Iran is low. In a pop-ulation of a cross–pollinating species, sexually propagated individuals usually have a certain genetic distance from each other. Sister plants may share between 0% and 100% of the alle-les they inherit from their parents. But only few couples will have a genetic similarity above 0.90, while a genetic similarity above 0.95 is extremely rare. Vegetative propagation leads to a genetic similarity of 1.00. Therefore, the distinction between clonal plants and sexually derived genotypes will, in principle, be clear (Smulder et al. 2002). Based on this fi nding, it can be assumed that poplar populations in Kermanshah province have been propagated of identical clones because of observed genetic identity (100%). So, the trees showed the same patterns in height growth and leaf morphologi-cal characters. Low level of genotypic diver-sity in poplar population has been indicated in some studies (Arens et al. 1998, Cottrell et al. 2002, Barsoum et al. 2004,Brundu et al. 2008, Smulders et al. 2008b).
For a long-term survival of poplar popu-lations having suffi cient genetic diversity is of great signifi cance. Considering the strong vegetative reproduction ability of poplars, the individual cuttings sampled from a population should be separated by a distance great enough (Peng et al. 2005). To avoid the decrease of ge-netic diversity in poplar population established in Iran, it is essential to control clonal repro-duction. For this purpose molecular markers are useful tools that be able to establish the extent of clonal propagation, while the mor-phological markers can be used as cheap diag-nostic markers in early identifi cation of clones for further selection (Lopez et al. 2004).
Conclusions
In this study, using the molecular and morpho-logical markers it was revealed the low level of genetic variation in P. nigra stands in Ker-manshah province of Iran. Monomorphics was shown at 3 investigated microsatellite loci and there were no signifi cant differences between mean values of all morphological characters. These results indicate that studied stands are not in a good state of conservation. Since pop-lar plantations are threaten with environmental pressures which cause harmful effects on the growth and productivity of crops, genetic vari-ation is essential for the long-term survival in these situations. For conservation strategy at least two conclusions can be drawn from these results: the fi rst recommendation would be to avoid sampling the same ramets for planting in a poplar plantation. The second recommenda-tion would be to increase the genetic richness of exiting population through providing con-ditions for sexual reproduction and planting seedlings with different genomes.
In conclusion, efforts should be made to op-timize the level of genetic diversity in poplar populations established in Kermanshah prov-ince, in order to allow them to survive and re-produce under changing environmental condi-tions. This is a primary step to make effective use of these resources possible.
Acknowledgements
The authors wish to thank to Research Institute of Forests and Rangelands and Azad Univer-sity for ex tending fi nancial support to run this project and to Dr. Berthold Heinze for his valu-able help.
References
Bor-177 dacs S., (eds.), Towards the: Generic diversity in river
populations of european black poplar: implications for riparian ecosystem management. Proceedings of an in-ternational symposium held Csiszàr Nyomda, Hungary, pp. 125-136.
Apples R., 1997. DNA technology. A master class in new technologies for the measurement of biodiversity. The University Pertanian Malaysia, Serdang, Malaysia. Arens P., Coops H., Jansen J., Vosman B., 1998.
Molecu-lar genetic analysis of black popMolecu-lar (Populus nigra L.) along Dutch rivers. Molecular Ecology 7: 11-18. Asadi F., Naderi-Shahab M.A., Mirzaie-Nodoushan H.,
2005. Identity and genetic diversity of populus species clones using microsatellite marker. Pajouhesh Sazan-degi 66: 49-55 (In Persian).
Bakshi M., Konnert M., 2011. Genetic diversity and dif-ferentiation through isozymes in natural populations of Pinus wallichiana A.B. Jacks (Blue Pine) in India. An-nals of Forest Research 54: 23-37.
Ballian D., Kajba D., Idzojtic M., 2006. Morphologi-cal diversity of hairy european black poplar (Populus nigra subsp. caudina) in Bosnia and Herzegovina.
Ори иналнинаучнира 5: 13-22.
Barsoum N., Muller E., Skot L., 2004. Variations in levels of clonality among Populus nigra L. stands of different ages. Evolutionary Ecology 18: 601-624.
Brenner AM., Busov VB., Strauss SH., 2004. Poplar ge-nome sequence: functional genomics in an ecologically dominant plant species. Trends in Plant Sciemces 9: 49-56.
Brundu G., Lupi R., Zapelli I., Fossati T., Patrignani G., Camarda I., Sala F., Castiglione S., 2008. The Origin of Clonal Diversity and Structure of Populus alba in Sar-dinia: Evidence from Nuclear and Plastid Microsatellite Markers. Annals of Botany 102: 997-1006.
Calagari M., Modirrahmati A.R., Asadi F., 2006. Morpho-logical variation in leaf trait of Populus euphratica Oliv. natural populations. International journal of Agriculture and Biology 6: 754-758.
Chen K., Peng Y., Wang Y., Korpelainen H. Li C., 2007. Genetic relationships among poplar species in section Tacamahaca (Populus L.) from western Sichusn, China. Plant Sicence 172: 196-203.
Cottrell J.E., Tabbener H.E., Forrest G.I., 2002. Distri-bution of variation in british black poplar: the role of human management. In: van Dam B.C., Bordacs S., (eds.), Towards the: Generic diversity in river popula-tions of european black poplar: implicapopula-tions for riparian ecosystem management. Proceedings of an international symposium held Csiszàr Nyomda, Hungary, pp. 73-84. Fossati T., Zapelli I. Bisoffi S., 2005. Genetic relationship
and clonal identity in a collection of commercially rel-evant poplar cultivars assessed by AFLP and SSR. Tree Genetic & Genomes 1: 11-19.
Fossati T., Grassi F., Sala F. Castiglione S., 2003. Molecu-lar analysis of natural population of Populus nigra L. intermingled with cultivated hybrids. Molecular Ecol-ogy 12: 2033-2043.
Gaudet M., Jorge V., Paolucci I., Beritognolo I., Scarascia Mugnozza G., Sabatti M. 2008. Genetic linkage maps of Populus nigra L. including AFLPs, SSRs, SNPs, and sex trait. Tree Genetics & Genomes 4: 25-36. Gebhardt K., Pohland A., Vornam, B., 2002. Genetic
in-ventory of black poplar population in the Upper Rhine Floodplains: conclution for conservation of an endan-gered plant species. In: van Dam B.C., Bordacs S., (eds.), Towards the generic diversity in river popula-tions of european black poplar: implicapopula-tions for ripar-ian ecosystem management. Proceedings of an interna-tional symposium held Csiszàr Nyomda, Hungary, pp. 145-156.
Jianming G., Shougong Z., Liwang Q., Yong Z., Chunguo W., ruiyang C., Wenqin S., 2007. AFLP fi ngerprinting of elite varieties (clones) from the genus Populus. Fron-tiers of Forestry in China 2: 204-209.
Kajba D., Romanic B., 2002. Morphological leaf variabil-ity of the european black poplar (Populus nigra L.) in natural populations in the Drava River Basin in Croatia. In: van Dam B.C., Bordacs S., (eds.), Towards the: Ge-neric diversity in river populations of european black poplar: implications for riparian ecosystem manage-ment. Proceedings of an international symposium held Csiszàr Nyomda, Hungary, pp. 221-227.
Khan I.A., Awan F.S., Ahmad A., Khan A.A., 2004. A Modifi ed mini-prep method for economical and rapid extraction of genomic DNA in plants. Plant Molecular Biology Reporter 22: 89a-89e.
Krystufek V., Fluch S., Burg K., 2002. Artifi cial yet natu-ral: colonization of an artifi cial island in the river Dan-ube in Vienna. . In: van Dam B.C., Bordacs S., (eds.), Towards the: Generic diversity in river populations of european black poplar: implications for riparian ecosys-tem management. Proceedings of an international sym-posium held Csiszàr Nyomda, Hungary, pp. 137-144. Lefevre F., Achard P., Azasis D., Smulder M.J.M., Van der
Schoot J., Bovenschen J., Ivens B., Storme V., Fluch S., Krystufek V., Castiglione S., 2002. Distribution of Populus nigra genetic diversity within France and its consequences for ex-situ conservation strategy. In: van Dam B.C., Bordacs S., (eds.), Towards the generic di-versity in river populations of european black poplar: implications for riparian ecosystem management. Pro-ceedings of an international symposium held Csiszàr Nyomda, Hungary, pp. 85-91.
Li S., Zhang Bo., Yin C., Pan H., Minren H., 2006. Analy-sis of genetic diversity of Populus deltoides germplasm by SSRs. International Poplar Symposium, China. Lopez D.H., Sierra U.R., Cristobal M.D., 2004. A
compar-ison of isozyme and morphological markers to assess the within population variation in small populations of European aspen (Populus tremula L.) in Spain. Silvae Genetica 53: 227-233.
Mohajer M.R., 2006. Silviculture, 2th edition, Tehran Uni-versity, Tehran (In Persian).
char-acteristics and wood production of 12 poplar clones open crown Populus deltoides and Populus eurameri-can. Proceedings of the Second National Congress On Polar and Potential Use in Poplar Plantation, pp. 129-139.
Peng Y.H., Lu Z.X., Chen K., Luukkanen O., Korpelainen H., Li C.Y., 2005. Population genetic survey of Popu-lus cathayana originating from southeastern Qinghai- Tibetan plateau of China based on SSR markers. Silvae Genetica 54: 116-122.
Rathmacher G., Niggemann M., Köhnen M., Ziegenha-gen1 B., Bialozyt R., 2010. Short-distance gene fl ow in Populus nigra L. accounts for small-scale spatial genetic structures: implications for in situ conservation measures. Conservation Genetics 11: 1327-1338. Safavi S.M., 2011.Estimation of genetic parameters
re-lated to morphological traits in poplar clones. American Journal of Scientifi c Research 27: 105-110.
Smulders M.J.M., Beringen R., Volosyanchuk R., Vanden Broeck A., Van der Schoot J., Arens P., Vosman B., 2008a. Natural hybridisation between Populus nigra L. and P. xcanadensis Moench. Hybrid offspring competes for nichesalong the Rhine river in the Netherlands. Tree Genetics & Genomes 4: 663-675.
Smulders M.J.M., Cottrell JE., Lefèvre F., Van der Schoot J., Arens P., Vosman B., Tabbener HE., Grassi F., Fos-sati T., Castiglione S., Krystufek V., Fluch S., Burg K., Vornam B., Pohl A., Gebhardt K., Alba N., Agúndez D., Maestro C., Notivol E., Volosyanchuk R., Pospíšková M., Bordács S., Bovenschen J., van Dam BC., Koelewi-jn HP., Halfmaerten D., Ivens B., van Slycken J., Van-den Broeck A., Storme V., Boerjan W., 2008b. Struc-ture of the genetic diversity in black poplar (Populus nigra L.) populations across European river systems: consequences for conservation and restoration. Forest Ecology and Management 255: 1388-1399.
Smulders M.J.M., Van der Schoot J., Ivens B., Storme V., Castiglione S., Grassi F., Fossati T., Bovenschen J., van Dam BC., Vosman B., 2002. Clonal propagation in black poplar (Populus nigra). In: van Dam B.C., Bor-dacs S., (eds.), Towards the generic diversity in river populations of European black poplar: implications for riparian ecosystem management. Proceedings of an
in-ternational symposium held Csiszàr Nyomda, Hungary, pp. 39-52.
Smulders M.J.M., Van der Schoot J., Arens P., Vosman B., 2001. Trinucleotide repeat microsatellite markers for black poplar (Populus nigra L). Molecular Ecology 1: 188-190.
Storme V., Vanden Broeck A.H., Ivens B., Smulders M.J.M., Halfmaerten D., Van Slycken J., Boerjan, W., 2002. Ex situ conservation of black poplar in Belgium, the margin of the geographical distribution area of the species. In: van Dam B.C., Bordacs S., (eds.), Towards the generic diversity in river populations of european black poplar: implications for riparian ecosystem man-agement. Proceedings of an international symposium held Csiszàr Nyomda, Hungary, pp. 61-72.
Suvanto LI., Latva-Karjanmaa T., 2005. Clone identifi ca-tion and clonal structure of the European aspen ( Popu-lus tremula L.). Molecular Ecology 14: 2851-2860. Taylor G., 2002. Populus: arabidopsis for forestry. Do we
need a model tree? Annals of Botany 90: 681-689. Vanden Broeck A.H., Storme V., Cox K., Quataert P.,
Iv-ens B., Hostyn V., Halfmaerten D., Boerjan W., Van Slycken, J., 2002. Mating system of Populus nigra in a mixed poplar sand composed of P. nigra, P. deltoids and P.x euramericana. In: van Dam B.C., Bordacs S., (eds.), Towards the generic diversity in river popula-tions of european black poplar: implicapopula-tions for ripar-ian ecosystem management. Proceedings of an interna-tional symposium held Csiszàr Nyomda, Hungary, pp. 53-60.
Van Dam B.C., 2002. EUROPOP: Genetic diversity in river population of european black poplar for evalution of biodiversity, conservation strategies, nature develop-ment and genetic improvedevelop-ment. In: van Dam B.C., Bor-dacs S., (eds.), Towards the generic diversity in river populations of european black poplar: implications for riparian ecosystem management. Proceedings of an in-ternational symposium held Csiszàr Nyomda, Hungary, pp. 15-32.