Do dividends signal more earnings?
A theoretical analysis
Aloisio Araujo
Instituto Nacional de Matemática Pura e Aplicada (IMPA) and Escola de Pós-Graduação em Economia
Fundação Getulio Vargas (EPGEjFGV)
Humberto Moreira
Escola de Pós-Graduação em Economia Fundação Getulio Vargas (EPGEjFGV)Marcos H. Tsuchida
* Escola de Pós-Graduação em EconomiaFundação Getulio Vargas (EPGEjFGV)
This Version: February 2003
Do dividends signal more earnings?
A theoretical analysis
Abstract
The signaling models have contributed to the literature of corporate finance by the formalization of "the informational content of dividends hy-pothesis". However, these models are under criticism of empirical works, as weak evidences were found supporting one of the main predictions: the positive relation between changes in dividends and changes in earnings. We claim that the failure to verify this prediction does not invalidate the signaling approach. The mo deIs developed up to now assume or derive utility functions with the single-crossing property. We show that signaling is possible in the absence of this property and, in this case, changes in dividend and changes in earnings can be positively or negatively related.
Keywords: Dividend policy, non-monotone contracts, signaling, single-crossing property.
The information content of dividends is a controversial issue in corporate fi-nance. The research started when Miller and Modigliani (1961) suggested that managers use dividend policy to convey their expectations of future prospects of the firmo With this hypothesis they proposed to explain the effect of div-idend changes on the prices of shares. Since then, theoretical and empirical research advanced. Signaling mo deIs were the main to oI that formalized the original intuition. Bhattacharya (1979), Miller and Rock (1985), and John and Williams (1985) were the initiators of a long list of signaling models1 . The basic idea is that firm managers possess private information about future earnings and they like to convey it to the market. However, they cannot simply announce their expectations of future earnings publicly because every firm could imitate them. The information is conveyed by a costly signal. In the cited models, the respective costs are: financing of a committed leveI of dividend, suboptimal investment and tax on dividends.
On the empirical side, researchers tries to verify the testable implications derived from the models. In all these mo deIs the single-crossing property holds. As a consequence, the models predict that dividends, market price and future or current earnings are positively related. The correlation between dividend and returns was a strongly established result even before the signaling models have appeared. Aharony and Swary (1980) show that announcements of divi-dend increases or decreases result in, respectively, positive or negative abnormal returns.
The controversy lays on the relationship between dividends and subsequent earnings. Watts (1973) analysis found the positive relation, however, the effect was very small and not conclusive. Healy and Palepu (1988) found a signif-icant relation, but they focused in the particular situation of initiation and omission of dividend payment. Exploring a larger data set Benartzi, Michaely and Thaler (1997) found no significant relation between dividends and future earnings and concluded that dividends are more related to past and present
earnings. More recently, Nissim and Ziv (2001) using an improved measure of future earnings concluded that dividends matters for earnings prediction. Many other works contributed to this debate and a definitive conclusion seems far to be reached.
We claim that the lack of a clear relation between dividends and earnings is not incompatible with information content of dividends. Common to all the previous models of signaling is the existence of single-crossing in the objec-tive function of manager, i.e., the marginal cost of signaling is monotonic in the type of firms. This property generates the monotonic relationship between dividends and earnings. In this work, we drop this assumption and develop a model employing the techniques presented in Araujo and Moreira (2001a). In non-single-crossing signaling, a new kind of equilibrium may existo In this equilibrium the relation between firms earnings and dividends is U-shaped, so that two types of firms signal with the same leveI of dividendo The two types are indistinguishable by the market and this situation can be interpreted as low types pretending to be high types. The market value of shares is an average of the values of two types and increases with dividendo 80, signaling models may provide a positive relation between dividends and market price and, at same time, an ambiguous relation between dividends and earnings.
The model is presented in section 1 and it is similar to the model of Miller and Rock (1985). For concreteness, we assume a quadratic production function, in section 2, and discuss an example. Computations are performed for a range of parameters values and results are presented in section 3. The conclusions are presented in section 4.
1 The IDodel
may sell their shares, dividends are distributed and X - Dare invested. At the end of period 1, the firm production is subject to a multiplicative shock, ó> O, so that
Y = óF(X -D),
where O ::; D ::; X. At period 2 the earnings are distributed and the firm is disassembled. The information asymmetry is on the knowledge of X, which we assume randomly distributed on [Xl, X2 ], with density p(X). Consistent with the terminology used in theory of contracts, we refer to X as the type of the firmo At period 1, managers know X before the dividend announcement, but the market does not, and managers cannot credibly convey their private information to the market. The shock Ó is unknown to both manager and market, but may be correlated with X.
Assumption 1 The shocks are correlated,
E[8IX] = é(X)
>
O.1.1
The value of the firm
At period 1, managers estimate the fundamental cum-dividend value of the firm as the present value of dividend fiow:
V(X, D)
=
D+
-11 . E[8F(X - D)IX]+2
1
=
D+
-1 -.é(X)F(X - D).+2
(1)Under symmetric information, this would be the value of shares and the manager would choose the investment in order to maximize V. The first-best dividend leveI, D*, would be given by the Kuhn-Tucker conditions:
F X-D '( *) - - -1
+
i{=
0, if D*> 0,
é(X) セ@ 0, if D*
=
O. (2)But under asymmetric information, the market value may not coincide with V. Let
vm
denote the market value. We will assume thatvm
is determined as a signaling equilibrium, that is, firms signal to the market by the choice of dividend leveI and market estimates the value observing the dividend choice. The firms will choose dividend above the optimal leveI, paying an underinvestment cost for signaling.Shareholders want to maximize V if they keep the share with them until period 2. The ones who intend to seU at period 1 prefer the maximization of the mar ket vaI ue,
vm.
As in MiUer and Rock (1985), we assume the firm' s managers are maximizing a welfare function that aggregates the interests of shareholders that desire to seU the shares and the ones who do noto Let k E (0,1] be the fraction of shareholders that seU at period 1. This fraction is exogenous and can be motivated by necessity of liquidity by shareholders. The welfare function isW(X,D, Vm
For the purpose of signaling analysis, we are interested on marginal rate of substitution between V1n and D. Since W is quasi-linear with respect to Vm , all the properties are found in marginal welfare of D,
WD(X, D)
=
(1-k) (1- 1セ@
/(X)F'(X - D)) .The dependence of productivity shock on type may make W D non-monotone on type. More precisely, higher X increases é, but reduces F', for the same leveI of dividendo
In terms of the cross-derivative of W,
WXD(X, D) = 11-
セ@
[-é(X)F"(X - D) - é'(X)F'(X - D)l, (3)+z
may change its signo We can define two regions a in X x D plan, according to this signo
Definition 1 The CS+ region (resp. CS- region) is the set of points in X x D
plan such that WXD
>
O (resp. WXD< O).
In equation (3), the first term in the brackets is the investment effect. Firms with higher earnings invest more and have lower marginal product. Conse-quently, the marginal cost of dividend is lower for higher types. The second term is the productivity effect. Firm earnings provide information about the future productivity, which affect the expected marginal cost of the signal.
Negative correlation between earnings and productivity
When é'(X) S; O, higher earnings reduce the expected productivity and the cost of signaling is lower. Welfare function has the single-crossing property since both productivity and investment effects collaborate on WXD
> O. The results
are, therefore, similar to the ones found by Miller and Rock (1985).Positive correlation between earnings and productivity
WXD
<
o
and higher types will be more reluctant to pay dividends because of lost of investment opportunities. Conversely, WXD>
O holds when investmenteffect dominates. In this case, lower types are more reluctant to pay dividends because they have lesser investment resources. Note that from (2) the first-best dividend as a function of types, D* (X), is increasing for W X D
>
O and decreas-ing for WXD< O.
If investment effect dominates, firms with higher earnings may pay more dividends and, if productivity effect dominates, they should in-vest more paying less dividends. When e'(X)>
O is such that the signal ofWXD is ambiguous, the single-crossing propriety does not hold. The assump-tion on the constancy of sign (for instance in Riley (1979)) for cross-derivative of objective function is then violated and we need another approach developed in Araujo and Moreira (200la,b).
1.2 The signaling equilibrium
As usual, the signaling equilibrium is a perfect Bayesian one (the formal defin-ition is provided in appendix A.l). The basic description remains. The market generates a value function, Vm (.), and each type offirm, X, chooses a dividend leveI, D, that maximizes W. We have an equilibrium if zero expected profit condition holds, that is,
Vm(D)
=
ED[V(X, D)], (4)where ED denotes the expectation taken on the Bayesian updated distribution on X. The market value Vm should be the expected value of the firm with respect to the probability distribution of X, resulting from the Bayesian update given the choice of D by the firmo
Define the welfare of type X firm that declares to be type
X
as W(X,X)=
W(X, D(X), Vm(D(X)))= kVm(D(X))
+
(1-k)V(X, D(X)).In order to be incentive compatible, each firm should prefer to tell the truth, that is
W(X,X) セ@ W(X,X), (5)
for all X,X E [Xl,X2]. A differential equation for D is derived from the first order condition
àW
- , (X,X) =0.
àX (6)
It should be noted that the first order condition is not sufficient condition for implementability when single-crossing property does not hold. Incentive com-patibility should be checked globally after a candidate for equilibrium is oh-tained.
Additionally, the second order condition constrains D'(X):
Proposition 1 In signaling equilibrium, D(X) is non-decreasing in CS+
re-gion and non-increasing in C S - region.
Proo!: See the appendix.
When single-crossing property is present, CS+ and CS- do not show up simultaneously and contracts should be monotone. As a consequence, types are separated when D'(X) -=/= O, or a interval of types is bunched when D'(X) = O. When single-crossing property does not hold, monotonicity is not assured and the relationship between type and signal may be, for example, U-shaped and a disconnected set of types may signal with the same dividend level.
1.3 Equilibria diversity
Definition 2 The pooling set, 6(D), is the set of types whose signal is D, that is,
e
=
{X E [X1,X21IV(X)=
D}.In particular, in a separating equilibrium, 6(D) is singleton for every D that is chosen by a firmo
Definition 3 The type X is separated if 6(V(X)) = {X}. A separating
equi-librium is a signaling equiequi-librium sueh that every X is separated.
When X is separated, market correctly infers the type by the observation of
D. 80 Vm(D) = V(X, D), where Xis the type that choose dividend leveI D.
Proposition 2 In a interval of separated types, D(X) follows the differential
equation
Proof: 8ee the appendix.
V'(X) = -kVx(X, V(X))
VD(X, V(X)) (7)
As in the single-crossing case, a pooling equilibrium may be characterized by a continuum of types that chooses the same signallevel.
Definition 4 The type X is continuously pooled, if 6(V(X)) is a eontinuous
set. A eontinuous pooling equilibrium is a signaling equilibrium sue h that for
In signaling games without single-crossing condition, a new kind of pooling arises. As in the continuous pooling, some values of D will be chosen by more than one type of firmo However, the number of pooling types may be finite.
Definition 5 The type X is diseretely pooled, if 6(D(X)) is a discrete and
finite set.
The property aggregating the discretely pooled types is that they must have the same marginal welfare W D.
Proposition 3 If X a and Xb are discretely pooled and D = V(Xa) = V(Xb)
=I-0, then
Proof: See the appendix.
Equation (8) gives E(Xa)F'(Xa - D)
=
E(Xb)F'(Xb - D). So different types can choose the same leveI of dividend when, for higher types, the higherproductivity shock compensate the reduction in marginal productivity resulted
from higher investment. In the discrete pooling, dividend choice does not fully
reveal the type of the firmo The market knows the set of possible types but
it cannot distinguish one type from the other. This fact is taken into account
when the market estimates the value, so ED[V(X, D)] is the average value of types in the pool.
Assumption 2 The type X is uniformly distributed on interval [X1,X2].
With assumption 2, each type has the same probability. In particular, when
there are only two types in the pool, the expected value of firms is
1 1
ED[V(X, D)] =
'2
V(Xa, D)+
'2
V(Xb, D),where Xa and Xb are the types that choose D.
Proposition 4 Under assumption 2, in a interval with discretely pooled types,
if exactly two types chooses the same dividend, V(X) follows the differential equation
v'
_
-k [Vx(X, V)+
Vx(X(X, V), V)Xx(X, V)]- kVx(X(X, V), V)XD(X, V)
+
2VD(X, V) , (9)where X(X, D), derived from (8), is the type pooled together with type X, when dividend D is chosen.
Proof: See the appendix.
1.4 Equilibrium refinement
The disturbing fact in any signaling model is the existence of many equilibria.
For the same parameters, different kinds of equilibrium may exist, and the choice
of initial conditions may generate a continuum of equilibria. At this point a
choose, among different kinds of equilibria, the one that minimizes pooling and maximizes efficiency.
Assumption 3 Separability degree 01 a continuous pooled type, a discretely
pooled type, and a separated type are, respectively, 1, 2, and 3.
Definition 6 Let II(d) = {X E [X1,X2lIX has separability degree d}.
Therefore II(l) is the set of continuously pooled types, II(2) is the set of discretely pooled types and II(3) is the set of separated types.
Definition 7 The separation fioor 01 a signaling equilibrium is the lowest
sep-arability degree associated to a type in [Xl, X2
l.
Definition 8 A pro-separation equilibrium is a signaling equilibrium with
sepa-rating fioor <p, such that (a) there is no other equilibrium with higher separation fioor; (b) among equilibria with same separation fioor, there is no other with lower probability of II(<p), according to density p(.); and (c) among equilibria with same separation fioor and same probability of II( <p), there is no other equi-libria with higher expected value, according to density p(. ).
Therefore, pro-separation equilibrium criterion chooses an equilibrium elim-inating poorly separated equilibria and taking the most efficient among the surviving equilibria.
2
The quadratic case
For the computations we consider a quadratic production function
F(I) = aI(b - 1), (10)
where O::; I ::; b/2, a
> O, and
b> O. We assume a linear expected productivity
shockc(X) = g+hX, (11)
The cross-derivative of welfare function of the firms is
w
= 4ah(1 - k)(x
_
D _ セ@.2..-).
XD 1
+
i 2 4+
2hThe CS+/CS- frontier is a straight line and is described by
(12)
and C S
+
region is observed for X above or D below the frontier. Only two types can be present in the discrete pooling equilibrium, and types are associated by the function X, derived from marginal condition (8), i.e.,- 9 b
X(X, D) =
-h
+
2
+
D - X.For a given levei of dividend, higher type in CS+ region pools with lower type in CS- region. The marginal cost of signaling is decreasing for high types, due to high investment, and is increasing for low types, due to productivity shock.
The differential equation for separating equilibrium is derived from (7),
I -ka [-3hX2
+
2(2h'O+
hb - g)X - h'02+
(2g - hb)'O+
bg] (13)'O = -2a(hX
+
g)'O + a(2hX2 + (2g - hb)X - bg) + 1 + i 'and, from (9), the differential equation for discrete pooling equilibrium is
where
R(X, D) =(4 - 3k)X2 - [(2 - k)(b
+
2D) - 4(1- k)*J X _ (2 _ k)(b+
2D)!l..+
k (b2 _ g2) + -.:2(,-1_+-:..i)h 4 h2 ah·
2.1
An example
(14)
In this example, we assume the following parameter values: a = 1, b = 4, i = 0,
k = セL@ 9 =
°
and h = 1, that is,P(I)
=
1(4 - I),where
o :::;
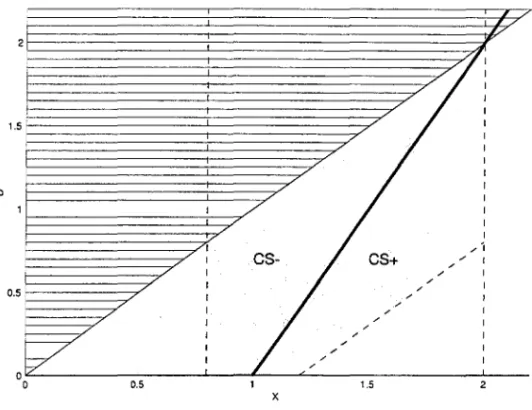
I:::; 2, and X uniformly distributed over [Xl, X2] = [0.8,2]. In this context we haveWXD =2X-D-2
and the CS+ region is defined by X > セ@
+
1. The thick line in figure 1 divides the the X x D plan in CS+ and CS- regions. Note that we cannot have equilibrium in region above D = X, since dividend must be lesser than earnings in period 1.The distribution of probabilities of types imposes more restrictions on the possible contracts. The grayed area in figure 1 is the region where the discrete pooling is possible for our choice of support. For each leveI of dividend, every type, X, in grayed area has a correspondent type, X(X,D) = D+2-X, inside the support of the distribution function. Note that for low dividend, high types cannot discretely pool because the correspondent type is out of the interval of possible types.
From (13), the differential equation for separating equilibria is
Vf = 3X2 - 4(V
+
2)X+
V(V+
4)2-4X(2-X+V) ,
and, from (14), the differential equation for discrete pooling is
Vf = -2(V
+
2)X+
(V+ 2)2 5X2 - 6(V+
2)X+
8(15)
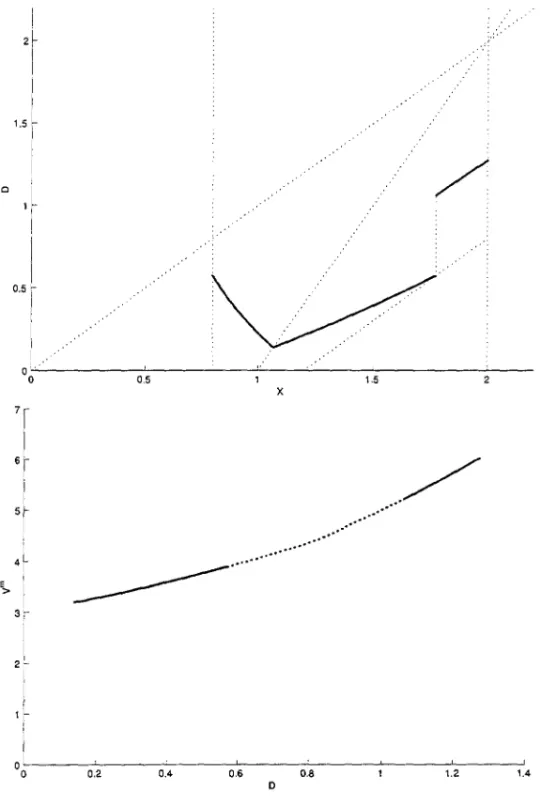
(16) Figure 2 shows some possible paths derived from equation (16), which has a singularity point at D
=
-2+
セjゥT@ セ@ 0.1381. Only paths on or above the saddle point are implementable, as they satisfy second order condition. The dashed curve is the first-best optimal dividend leveI given by equation (2). That is, for X E [1- 4,1+
4] the firm should not pay dividend and invest all the earnings. For all other types D* = X - 2+
RセN@efficient signaling is the path crossing the singularity point because this is the path eloser to the optimal dividend leveI, if the market knows types.
The efficient discrete pooling path does not cover all types. Denote as Xs
the type on which the saddle path crosses the boundary of grayed area. For types higher than Xs the matching types are out of the support of distribution.
These types must be covered by a separating equilibrium that is a solution of the differential equation (15). The initial dividend leveI for the separating schedule should not break incentive compatibility. This dividend leveI should be on the indifference curve of Xs type that passes through the last point of discrete
pooling schedule and satisfy zero-profit condition for separating equilibrium. The optimal contract is plotted on D x Vm plan of figure 3. Observe that there is a jump in dividend and in value at type Xs assigned contract. The
intermediate values can be filled by any contract that is not preferred for any type. In particular, the dotted curve is the lower envelope of the indifference curves that crosses the pair (D, Vm ) assigned to each type by the signaling schedule.
On the X x D plan there is a jump when equilibrium changes from pooling to separating. This jump does not exist if the distribution were continuous and equal to zero at Xl' Separating equilibrium is full informative and market knows that only higher types are selected. Then, dividends must be higher in separating equilibrium than in discrete pooling to satisfy zero profit.
In discrete pooling equilibrium, lower types pools with higher types because, in C S -, benefits from being treated equally as higher types compensates the cost of higher dividend distribution. The market knows the disguising behavior and adjust the evaluation, but signaling is preserved since lower types do not reduce the expect valuation to the point that incentives are broken.
situation does not occur in the example illustrated in figure 3). If incentive compatibility does not hold for the saddle path, there exist paths above it that satisfy global incentive compatibility. The lowest of these paths is chosen as the equilibrium of our model.
2.2
Other cases
The combination of discrete pooling with separating equilibrium is not the only equilibrium case for this model. Depending on the support of distribution and parameter values, other kinds of equilibrium may arise. Figure 4 shows other three cases of equilibrium. In graph (a) the CS-set is small and a separating equilibrium schedule exists is CS+ region. In graphs (b) and (c) the saddle path cross the upper limit of discrete pooling region and the contract is not implementable because dividends exceed earnings or because correspondent type is above support. In this case a combination of discrete pooling with continuous pooling may be a bunching equilibrium. Graph (b) shows a discrete pooling with bunching. A continuum of low types pools with a continuum of higher types so that the value of the pool coincides with the value of discrete pool, for the same leveI of dividendo In graph (c), the saddle path requires a higher leveI of dividend, such that discrete pooling is not possible even with bunching. The equilibrium is a continuous pooling of all types at efRcient dividend leveI. Graph (d) shows the three cases on D x Vm plano
3
Results
increases the probability of violation of global incentive compatibility condition. Consequently, the equilibrium path is higher and the set of separated types is shorter. On the other side, if k is high enough, the lowest types cannot pay the dividends required for eliminating continuous pooling and the equilibrium with bunching occurs.
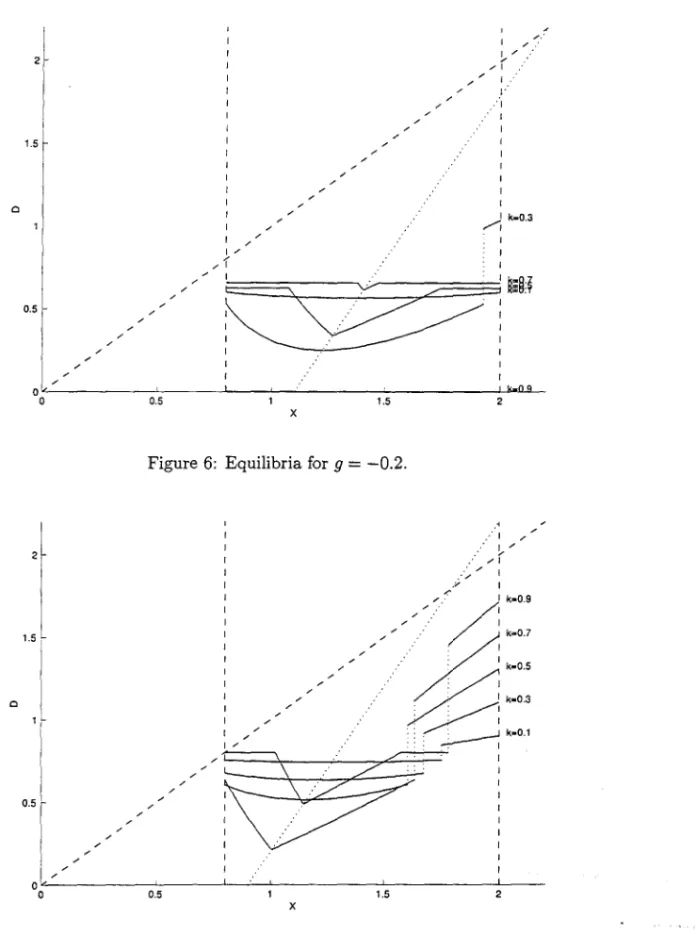
The influence of parameters g, h and b on equilibrium is mainly by the placement of CS+/CS- frontier. By equation (12), higher b, lower g, higher
h for positive g or lower h for negative g moves the frontier to right and CS-region enlarges. Consequently, separating equilibria is less frequent and con-tinuous pooling more common. On the other side, with changes of parameters in opposite direction, CS+ region enlarges and separating equilibrium is more frequento Discrete pooling is an intermediate case and will be present when C S
+
and C S - coexist in a favorable way. We verify this effect in figures 6 and 7. They repeat equilibria of figure 5 for g = -0.2 and g = 0.2. For g = -0.2 we observe more instances of bunching. Continuum set of high types pools with types lower than the types on the decreasing side of discrete pooling.4
Conclusion
Traditional models of signaling satisfy the single-crossing property for the oh-jective function of the firmo This property leads to a monotone relationship between types and signals. We believe that this assumption is not essential and the results derived from non-single-crossing signaling are also plausible. For instance, in our dividend signaling model, low quality firms may pay high divi-dends in order to be considered as high quality firms. The general result is that the monotone relationship between type (earnings) and signal (dividends) is not assured.
This result has impact on empirical works that test for the presence of asym-metric information assuming single-crossing2. Critics on the informational con-tents of dividends claim that statistical evidences of positive relation between
dividends and earnings are weak. But, as we have shown, this is an expected result when discrete pooling equilibrium occurs.
We believe that the absence of the single-crossing property is not an uncom-mon situation and empirical research must take this possibility into account. The presence of discrete pooling enriches the interrelation among variables in signaling models and tests based on monotonicity should not be used to reject asymmetric information.
A
Appendix
A.I
The perfect Bayesian equilibrium
A perfect Bayesian equilibrium (PBE) for dividend signaling model is a profile of strategies {c(X) = ('D(X), Vm(X))}xE[X
"X2J and ex-post beliefs f.L(·lc) such that the following conditions are satisfied:
1. Zero expected profit constraint:
2. Maximization of firm welfare:
X E arg . max kVm(X)
+
(1-k)V(X, 'D(X)) XE[X"X2J
3. Consistence of beliefs: f.L(Xlc) is the Bayesian updating given 1 and 2, Le., it is the probability a posteriori of X given c.
A.2
Proof of propositions
A.2.1 Proof of proposition 1
The first order condition, (6) can be written as
whose derivative is
WXD(X, D(X))D'(X)
+
[WVv(X, D(X))+
kVml/(D(X)))] (D'(X)?+ [WV(X, D(X)))
+
kVm'(D(X))] DI/(X) = O. From definition of W,(17)
ô2
;-V
(X, X)=
[WVD(X, D(X))+
kVml/(D(X)))] (D'(X))2ÔX2 (18)
+ [Wv(X,D(X))) +kVm'(D(X))] DI/(X).
Equations (17) and (18) simp1ifies second order condition to
which proves the proposition.
A.2.2 Proof of proposition 2
Since type is perfect1y revea1ed by observation of D, the market correct1y eva1-uate the firm, that is, Vm(D) = V(X,D), where X = D-1(D). The we1fare is
W(X, X)
=
kV(X, D(X))+
(1-k)V(X, D(X)),and the first order condition (6), resu1ts (7).
A.2.3 Proof of proposition 3
The first order condition is
WD(X, D(X))D'(X)
+
kVm'(D(X))D'(X) = 0, and, since D(X) =1= 0,-kVm'(D(X)) = Wv(X, D(X)).
A.2.4 Proof of proposition 4
Let X be the lowest type that chooses D and X(X, D) the highest. The market value is an average of the value of the types pooled in the same dividend leveI,
Vm(V(X)) =
セ@
V(X, V(X))+
セvHxHxL@
V(X)), V(X)),and the welfare as a function of declaration is
• k . . k _ . . . •
W(X, X) =
'2
V(X, V(X))+
'2
V(X(X, V(X)), V(X))+
(1 - k)V(X, V(X)). Derivating inX
and taking into account that (8) implies VD(X, V(X)) = VD(X(X, V(X)), V(X)), condition (6) results (9).References
Aharony, J., and L Swary, 1980, "Quarterly dividend and earnings an-nouncements and stockholders' returns: an empirical analysis", Journal of
Finance, 35, 1-12.
Allen, F., R. Michaely, 1995, Dividend Policy, in: R. Jarrowet aI. (eds.),
Handbooks in OR & MS, voI. 9, EIsevier, New York, 793-837.
Araujo, A., and H. Moreira, 2001a, "Adverse selection problems without the Spence-Mirrlees condition", EPGE Ensaios Econômicos, n. 425. Araujo, A., and H. Moreira, 200lb, "Non-monotone insurance contracts and their empirical consequences", mimeo, EPGE.
Benartzi, S., R. Michaely, and R. H. Thaler, 1997, "Do changes in dividends signal the future or the past?", Journal of Finance, 52, 1007-1034. Bhattacharya, S., 1979, "Imperfect information, dividend policy, and 'the bird in the hand' fallacy", Bell Journal of Economics, 10, 259-270. Healy, P. M., and K. G. Palepu, 1988, "Earnings information conveyed by dividend initiations and omissions", Journal of Financiai Economics, 21, 149-175.
John, K, and J. Williams, 1985, "Dividends, dilution, and taxes: a sig-nalling equilibrium", Journal oi Finance, 40, 1053-1070.
Nissim, D., and A. Ziv, 2001, "Dividend changes and future profitability",
Journal oi Finance, 56, 2111-2133.
Miller, M. H., and F. Modigliani, 1961, "Dividend policy, growth, and the valuation of shares", Journal oi Business, 34, 411-433.
Miller, M. H., and K Rock, 1985, "Dividend policy under asymmetric information", Journal oi Finance, 40, 1031-1051.
Riley, J. G., 1979, "Informational equilibrium", Econometrica, 47, 331-359. Watts, R., 1973, "The informational content of dividends", Journal oi
c
c
0.5
I
..-r
/
/
0.5
x
Figure 1: CS split and discrete pooling region.
0.5 1.5 x, 2
x
I
1.5 セ@
I
I
c
l
1
1
I
0.5 セ@i
I
I I .. '
i .. ····
ッセMMMMMMMMセMMMMMMMMMMセMMMMセMMMMセMMMMMMMMMMセMMM
7
I
I o
2-I
1
セ@
0.5
---
..
1.5
x
...
/
.... ... ...
O L - - I - - ' - - - - ' - - - " - - - - ' - - - ' - - - ' - , - - - '
O 0.2 0.4 0.6 0.8 1.2 1.4
o
Cl Cl 1.5
"' f
/ / / / / // , k-0.3
I /
Pセォ@ ______________ - L ________ セ@ ____ セ@ __ セ@ __________ セ@ ______________ セォ@ •• セoセY@ __
o
2
1.5 r
I 1 c
I
"'r
oL'" ,..
o
/
0.5 1.5
x
Figure 6: Equilibria for 9
=
-0.2./ / / / ." ·1
セO@
/1
I I
OOOセO_セOj@
.. : IZセZZZ@
" : I
0
:
Ik-0.5ZセN@ :k-0.3
: : I
::. • .---J k_0.1
OOセG@
/'./ I .. '
,,; I :
./,/ I ....
". I , '
0.5 1.5 2
x
FUNDAÇÃO GETULIO VARGAS
BIBLIOTECA
ESTE VOLUME DEVE SER DEVOLVIDO A BIBLIOTECA
NA ÚLTIMA DATA MARCADA
N.Cham. PIEPGE SA T882d
Autor: Tsuchida, Marcos H.
Título: Do dividends signal more eamings? : a theoretical .
1111111111111111111111111111111111111111
ZYQXセセ@
11FGV -BMHS N° Pat.:314611