Prognostic Significance of E-Cadherin Expression in
Hepatocellular Carcinoma: A Meta-Analysis
Jiang Chen1, Jie Zhao1, Rui Ma2, Hui Lin1, Xiao Liang1, Xiujun Cai1*
1Department of General Surgery, Institute of Minimally Invasive Surgery, Sir Run Run Shaw Hospital, College of Medicine, Zhejiang University, Hangzhou, Zhejiang, China, 2Department of Surgery, Zhejiang University Hospital, Zhejiang University, Hangzhou, Zhejiang, China
Abstract
Backgrounds:Hepatocellular Carcinoma (HCC) is one of the most common malignancy of liver and HCC-related morbidity and mortality remains at high level. Researchers had investigated whether and how reduced E-cadherin expression impacted the prognosis of patients with HCC but the results reported by different teams remain inconclusive.
Methods:A systematic literature search was performed in all available databases to retrieve eligible studies and identify all relevant data, which could be used to evaluate the correlation between reduced E-cadherin expression and clinicopathological features and prognosis for HCC patients. A fixed or random effects model was used in this meta-analysis to calculate the pooled odds ratios (OR) and weighted mean differences (WMD) with 95% confidence intervals (CI).
Results:Total 2439 patients in thirty studies matched the selection criteria. Aggregation of the data suggested that reduced E-cadherin expression in HCC patients correlated with poor 1-, 3- and 5-year overall survival. The combined ORs were 0.50 (n = 13 studies, 95% CI: 0.37–0.67, Z = 4.49, P,0.00001), 0.39 (n = 13 studies, 95% CI: 0.28–0.56, Z = 5.12, P,0.00001), 0.40 (n = 11 studies, 95% CI: 0.25–0.64, Z = 3.82, P = 0.0001), respectively. Additionally, the pooled analysis denoted that reduced E-cadherin expression negatively impacts recurrence-free survival (RSF) with no significant heterogeneity. The pooled ORs for 1-, 3- and 5- year RSF affected by down-regulated E-cadherin were 0.73 (n = 6 studies, 95% CI: 0.54–1.00, Z = 1.95, P = 0.05), 0.70 (n = 6 studies, 95% CI: 0.52–0.95, Z = 2.32, P = 0.02), 0.66 (n = 5 studies, 95% CI: 0.48–0.90, Z = 2.64, P = 0.008). And what’s more, reduced E-cadherin expression tended to be significantly associated with metastasis (OR = 0.31, 95% CI: 0.16–0.60, Z = 3.50, P = 0.0005), vascular invasion (OR = 0.76, 95% CI: 0.59–0.98, Z = 2.14, P = 0.03), advanced differentiation grade (OR = 0.31, 95% CI: 0.21–0.45, Z = 6.04, P,0.00001) and advanced TMN stage (T3/T4 versus T1/T2) (OR = 0.61,95% CI:0.38–0.98, Z = 2.05, P = 0.04).
Conclusions:Reduced E-cadherin expression indicates a poor prognosis for patients with HCC, and it may have predictive potential for prognosis of HCC patients.
Citation:Chen J, Zhao J, Ma R, Lin H, Liang X, et al. (2014) Prognostic Significance of E-Cadherin Expression in Hepatocellular Carcinoma: A Meta-Analysis. PLoS ONE 9(8): e103952. doi:10.1371/journal.pone.0103952
Editor:Kwan Man, The University of Hong Kong, Hong Kong
ReceivedMay 6, 2014;AcceptedJuly 4, 2014;PublishedAugust 5, 2014
Copyright:ß2014 Chen et al. This is an open-access article distributed under the terms of the Creative Commons Attribution License, which permits unrestricted use, distribution, and reproduction in any medium, provided the original author and source are credited.
Data Availability:The authors confirm that all data underlying the findings are fully available without restriction. All relevant data are within the paper and its Supporting Information files.
Funding:The authors have no support or funding to report.
Competing Interests:The authors have declared that no competing interests exist. * Email: cxjzu@hotmail.com
Introduction
Hepatocellular carcinoma (HCC) is not only the seventh most frequent human malignant tumors, but also the second highest cause of cancer-related death from poles to poles. It was estimated that HCC had caused about 746,000 deaths in 2012 [1–5]. Despite the considerable advancement in new-developed thera-pies, the overall mortality and morbidity for HCC are high and the prognosis of patients remains disappointed [6]. On the one hand, it might be due to that the time of diagnosing HCC is always at the advanced stage; on the other hand, clinicopathological features of HCC, such as differentiation, tumor grade/stage, lymph node status, depth of tumor invasion, and metastasis all influence the prognosis of patients with HCC. Consequently, new biomarkers that could be used effectively to anticipate the prognosis of patients with HCC are in urgent need [7–10].
Nowadays, the role of cell adhesion molecules, such as cadherin, catenin, selectin, integrin, whose expression levels change dynam-ically in tumor and have much association with tumor invasion and metastasis, has attached more and more attention [11–14]. These molecules could serve as potential marker predicting the prognostic significance for patients with HCC.
E-cadherin is the major member of cell adhesion molecule family expressed by epithelial cells [15]. It is a transmembrane calcium-dependent cell adhesion protein with a molecular weight of 120-KD. E-cadherin regulates cell differentiation and maintains cell structure. Detected by immunohistochemistry, reduced E-cadherin expression has been observed in a wide variety of tumors, characterized by decreased epithelial cell adhesion and increased motility and invasiveness of tumor cells [16–21]. Vast work has been done to examine the correlation of reduced E-cadherin expression with prognostic significance for patients with HCC but
First author & year
No. of
patients Mean age
Gender (M/F)
Level of evidence Stage
Clinicopathological
features Method
Clone number of
antibody (source) Dilution
Reduced E-cad. expression (%)
Blind evaluation
Definition standard*
ProvidedOS data
Zhang 2013 66 NR 60/6 3 I–III D, T IHC (Santa Cruz Biotech, USA) NR 38/66 (57.6) Yes NR No
Xia 2013 406 NR 331/75 3 I–III D, T IHC NR NR 156/406 (38.4) Yes NR Yes
Pan 2013 70 53 (21–74) 60/10 3 I–IV D, T, M IHC (Zhongshan Golden BridgeBiotechnology, China)
NR 45/70 (64.3) Yes CS No
Liu 2013 113 NR NR 3 I–IV D IHC (BD Biosciences, USA) 1:800 24/113 (21.2) Yes CS No
Hashiguchi 2013 108 65.3 85/23 3 I–IV D, T, M IHC (DAKO, Japan) 1:100 44/108 (40.7) Yes NR Yes
Ding 2013 42 57.1612.1 (33–82)
37/5 3 NR D, T IHC (Takara, Japan) NR 32/42 (76.2) Yes NR No
Zhang 2012 100 55.1 (28–77) 80/20 5 I–IV D, T, M IHC (Santa Cruz Biotech, USA) 1:100 52/100 (52) Yes ,90% Yes
Jiang 2012 125 51.43 (18–75) 115/10 5 I–III T, M IHC (Santa Cruz, USA) 1:200 71/124 (57.3) Yes CS Yes
Xia 2012 50 NR NR 3 I–IV NR IHC (Cell Signaling, MA) NR 26/50 (52) Yes CS No
Zhao 2011 97 NR 82/15 3 NR M IHC (Santa Cruz Biotech, USA) 1:100 48/97 (49.5) Yes NR Yes
Woo 2011 59 57 (35–80) 48/11 3 I–IVA D, M, IHC (DECMA-1, Cambridge, UK) 1:500 33/59 (55.9) Yes CS Yes
Du 2009 43 49 (29–72) 36/7 3 NR D IHC (Abgent Biotechnology, CA) 1:50 31/43 (72.1) Yes CS No
Korita 2008 125 63 (16–79) 88/37 3 NR D IHC Novocastra Laboratories Ltd, UK 1:50 34/125 (27.2) Yes CS Yes
Zhai 2008 97 54 (34–72) 67/30 5 I–IV D, LN, M, IHC (Santa Cruz Biotech, USA) 1:200 57/97 (58.8) Yes ,5% Yes
Wu 2008 41 52.929 (36–73) 35/6 4 I–IV D, T, IHC (Zymed Laboratories San Francisco, CA, USA).
NR 21/41 (51.2) Yes CS Yes
Guo 2008 40 NR 32/8 3 I–IV D, LN IHC (Santa Cruz Biotech, USA) NR 18/40 (45) Yes ,50% Yes
Cho 2008 68 6069 55/13 4 I–IV D IHC (Santa Cruz Biotech, USA) 1:100 30/68 (44.1) Yes ,30% Yes
Higashi 2007 55 64 (40–80) 46/9 5 NR D, M IHC (Transduction Laboratories, Lexington, KY)
1:1000 21/55 (38.2) Yes CS Yes
Yamaoka 2006 17 4.17 13/4 4 I–IV D, M IHC (Takara, Japan) 5–10mg/ml 1/17 (5.88) Yes 0 No
Liu 2005 196 52 (14–72) 137/59 3 NR D IHC (Santa Cruz Biotech, USA) 1:600 83/196 (42.3) Yes CS No
Kwon 2005 72 49.9 (26–66) 57/15 3 NR D IHC (San Francisco, CA, USA) 1:40 18/64 (28.1) Yes ,50% No
Herath 2004 61 50.8 (23–77) 51/10 3 NR NR IHC (Santa Cruz Biotech, USA) 1:200 1/61 (1.6) Yes CS Yes
Lee 2003 60 53.8 47/13 3 NR NR MSP NR NR 20/60 (33.3) Yes NR Yes
Wei 2002 63 54.8 (16–78) 55/8 3 NR D IHC (Transduction Labs) NR 13/37 (35.1) Yes 0 No
Satoshi 2002 51 63.5 (45–79) 33/18 4 NR D IHC (Takara, Japan) 1:200 16/51 (31.4) Yes NR Yes
Asayama 2002 29 60 (37–73) 28/1 4 NR D, M IHC (Transduction Laboratories, USA) 1:1000 7/24 (29.2) Yes ,90% No
Matsumura 2001 30 NR NR 3 I–IV D Western
bloting
(Takara, Japan) NR 10/21 (47.6) Yes NR No
Endo 2000 107 60 (17–80) 87/20 4 NR D IHC (Takara, Japan) 1:100 39/107 (36.4) Yes CS Yes
Ihara 1996 41 60.1 (42–77) 38/3 3 NR D IHC (Takara, Japan) 1 ug/ml 23/66 (53.5) Yes CS No
Kazuaki 1995 7 NR NR 3 NR D IHC (Takara, Japan) 1:800 1/7 (14.3) Yes NR No
CS: complex score combining intensity and percentage; IHC: immunohistochemistry; MSP: Methylation Specific PCR; D: histologic differentiation degree; LN: lymph node metastasis; T: depth of tumor invasion; M: metastasis; OS: overall survival; NR: not reported; E-cad: E-cadherin;
*The definition standard of reduced E-cadherin expression. doi:10.1371/journal.pone.0103952.t001
E-Cadherin
and
Hepatocellu
lar
Carcinoma
ONE
|
www.ploson
e.org
2
August
2014
|
Volume
9
|
Issue
8
|
no concensus was achieved to date [22,23]. Consequently, basing on retrospective cohort studies, we carried out this meta-analysis to systematically and comprehensively investigate whether and how the reduced E-cadherin expression impacted prognosis of HCCs.
Methods
Study Selection
The Pubmed, Elsevier, Embase, Cochrane Library and Web of Science databases were searched systematically for all articles published between 1990 and April 3, 2014 using the following terms: ‘‘E-cadherin’’, ‘‘Cadherins’’, ‘‘CDH1’’, ‘‘cadherin’’, ‘‘HCC’’, ‘‘hepatocellular carcinoma’’, ‘‘hepatic tumor’’, ‘‘hepatic cancer’’, ‘‘liver cancer’’, ‘‘liver tumor’’ and ‘‘liver neoplasms’’ with all possible combinations. Using these parameters, we filtered out all the eligible articles and looked through their reference lists for additional available studies. The multifarious but crucial task to conduct a systematic literature search was undertaken indepen-dently by two reviewers (JC and JZ).
Criteria for Inclusion and Exclusion
To make this meta-analysis meet the high standards, studies had to fulfill the following criteria: (1) patients with distinctive hepatocellular carcinoma diagnosis by pathology but without restriction on age or ethnicity; (2) reduced E-cadherin expression was measured by immunohistological chemistry (IHC) or other methods in primary HCC tissues; (3) clinical trials or reports on E-cadherin expression study in HCC were published in English; (4) valid data were provided directly or could be calculated indirectly; (5) the study with the highest quality assessment was enrolled when trials on similar objects were reported many times.
Abstracts, editorials, letters and expert opinions, reviews without original data, case reports and studies lack of control groups were excluded. Studies and data were also excluded if: (1) articles about animals or cell lines; (2) the outcomes or parameters of patients were not clearly reported (e.g. omitting standard deviations (SDs) (3) conference records; (4) no related data required for necessary analysis; (5) overlapping articles.
Data Extraction and Literature Quality Assessment Independently, valid data were retrieved from eligible studies by two reviewers (JC and JZ) and relevant characteristics were listed
as follows: (1) first author’s name; (2) publication date; (3) study population characteristics; (4) disease stage; (5) the methods used to evaluate E-cadherin levels; (6) corporations of antibody; (7) percentage of reduced E-cadherin expression (Table 1). All relevant text, tables and figures were reviewed for data extraction. Any divergence was ironed out by discussion with the third reviewer (RM) for final expectation of consensus. The quality of each included study was assessed by utilizing the Centre of Evidence-Based Medicine.
Statistical Analysis
This meta-analysis was performed using the Review Manager (RevMan) software (version 5.2; Cochrane collaboration, http:ims. cochrane.org/revman/download) and STATA (version 12.0, Stata Corp. College Station, Texas) [24]. Odds ratios (OR), together with 95% confidence intervals (CI), was analyzed to estimate whether and how reduced E-cadherin expression impacts the prognosis of HCCs. Pooled values of ORs and 95% CIs, as the recommended summary statistics for meta-analysis, were calcu-lated using either a fixed-effects or a random-effects model. Heterogeneity among the outcomes of enrolled studies in this meta-analysis was evaluated by using Chi-square based Q statistical test [25]. AndI2statistic was calculated to quantify the total variation consistent with inter-study heterogeneity, ranging from 0% to 100% Heterogeneity was significant and unacceptable whileI2statistic was greater than 50%. P,0.05 in Q statistical test was considered statistically significant. Choose fixed-effects models to calculate effect size estimates for those studies lack of heterogeneity with a P value for Q-test higher than 0.10. On the contrary, random-effects models were used when P#0.10. The funnel plots was made by utilizing Egger’s test and Begg’s test to examine the risk of potential publication bias. Then, trim and fill analyses were used to evaluate the stability of our meta-analysis results if the plots were asymmetrical.
Results
Selection of trials
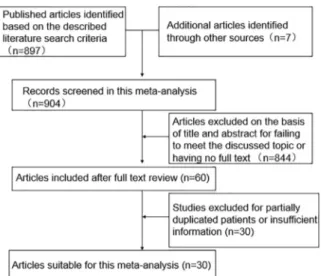
As shown in Fig. 1, 904 potentially eligible studies were screened out in the preliminary search. 844 articles were excluded for their improper titles and abstracts and 60 ones were captured after reviewing their full text for the relevance with the discussed topic. 30 studies was ultimately excluded due to a lack of clearly quantitative data on E-cadherin expression level in HCC. Thus, 30 studies, with more detailed and sufficient evaluation, met our entry criteria and were retrieved for further analysis. The flow diagram of study selection procedure was depicted in Fig. 1.
Study Characteristics
The related clinical data of the enrolled 30 studies with a total of 2439 patients are depicted in Table 1. E-cadherin expression of 2415 tissue samples among the 2439 cases was determined successfully while that of the rest was not provided clearly. And 1013 tissue samples had reduced E-cadherin expression. The case size of each study varied from 7 to 406 patients. 20 studies [22,23,26–43] among these 30 ones scored 3 using the grading of the Centre of Evidence-Based Medicine (Oxford, UK; http:www. cebm.net/index.aspx?o = 5653), 6 [44–49] scored 4, and the other 4 [50–53] scored 5. As shown in Table 2, all the 30 studies were evaluated blindly and the cases were grouped randomly according to the provided parameters without considering their age, gender, stage, pathological type and methods.
Figure 1. Flow chart of literature search strategies.
doi:10.1371/journal.pone.0103952.g001
E-Cadherin and Hepatocellular Carcinoma
Meta-Analysis of Overall Survival and Recurrence-free Survival
As shown in Fig. 2 (A–C), based on 13 studies [22,30,34,35,38,41,42,44,49–53], we investigated whether and how E-cadherin expression impacted overall survival of patients with HCC by phasing three periods, one-year, three-year and five-year, respectively. The pooled analysis suggested that reduced
E-cadherin expression correlated with lower overall survival for patients with HCC regardless of long or short term. The combined ORs were 0.50 (n = 13 studies, 95% CI: 0.37–0.67, Z = 4.49, P,
0.00001), 0.39 (n = 13 studies, 95% CI: 0.28–0.56, Z = 5.12, P,
0.00001), 0.40 (n = 11 studies, 95% CI: 0.25–0.64, Z = 3.82, P = 0.0001), respectively. Moreover, we also scrutinized the relationship between E-cadherin expression and recurrence-free survival for patients with HCC. Many studies provided the ORs and 95% CI for recurrence-free survival impacted by E-cadherin expression directly or indirectly [22,37,39,48,50,52]. The analysis was performed by classifying these studies into three groups characterized by one-year, three-year or five-year period, as shown in Fig. 3 (A–C). The results showed that reduced E-cadherin expression was associated with poor recurrence-free survival with no significant heterogeneity (I2= 0%, 47% and 50%). The pooled Table 2.Results of a meta-analysis comparing HCC with reduced E-cadherin and preserved E-cadherin.
Outcome of interest No. of studies Number of tissue samples OR/WMD 95% CI P value I2(%)
Overall Survival
1 year 13 [22,30,34,35,38,41,42,44,49–53] P.E-cad = 868, R.Ecad = 605 0.50 0.37–0.67 0.00001 43 3 year 13 [22,30,34,35,38,41,42,44,49–53] P.E-cad = 868, R.Ecad = 605 0.39 0.28–0.56 0.00001 52 5 year 11 [22,35,38,41,42,44,49–53] P.E-cad = 806, R.Ecad = 567 0.40 0.25–0. 64 0.0001 63 Recurrence-free Survival
1 year 6 [22,37,39,48,50,52] P.E-cad = 425, R.Ecad = 337 0.73 0.54–1.00 0.05 0
3 year 6 [22,37,39,48,50,52] P.E-cad = 425, R.Ecad = 337 0.70 0.52–0.95 0.02 47
5 year 5 [22,37,39,48,52] P.E-cad = 391, R.Ecad = 316 0.66 0.48–0.90 0.008 50
Differentiation grade 25 [22,23,26–29,32–37,40–51,53] P.E-cad = 1180, R.Ecad = 841 0.31 0.21–0.45 0.00001 56 Metastasis 10 [34,38,41,43,45,47,50–53] P.E-cad = 368, R.Ecad = 364 0.31 0.16–0.60 0.0005 69 TMN stage 13 [22,23,28,34,37,42,43,47–49,51–53] P.E-cad = 667, R.Ecad = 551 0.61 0.38–0.98 0.04 56 Liver cirrhosis 10 [22,23,31,34,40,42,43,49,52,53] P.E-cad = 605, R.Ecad = 453 0.92 0.69–1.24 0.58 19 Tumor encapsulation 7 [22,23,40,42,43,50,52] P.E-cad = 482, R.Ecad = 384 0.84 0.62–1.14 0.25 0 Vascular invasion 12 [22,23,29,37,40–42,45,49–52] P.E-cad = 655, R.Ecad = 515 0.76 0.59–0.98 0.03 16 P.E-cad: Preserved E-cadherin; R.E-cad: Reduced E-cadherin;ORodds ratio;WMDweighted mean difference;CI: confidence interval.
doi:10.1371/journal.pone.0103952.t002
Figure 2. Forest plot displaying the results of the meta-analysis on 1-year (A), 3-year (B) and 5-year (C) overall survival.
doi:10.1371/journal.pone.0103952.g002
Figure 3. Forest plot displaying the results of the meta-analysis on 1-year (A), 3-year (B) and 5-year (C) recurrence-free survival.
ORs were 0.73 (n = 6 studies, 95% CI: 0.54–1.00, Z = 1.95, P = 0.05) for1-year RFS, 0.70 (n = 6 studies, 95% CI: 0.52–0.95, Z = 2.32, P = 0.002) for 3-year RFS, 0.66 (n = 5 studies, 95% CI: 0.48–0.90, Z = 2.64, P = 0.008) for 5-year RFS., Taken together, the above results suggested that reduced E-cadherin expression exerted a significantly adverse effect on the prognosis of patients with HCC.
Meta-Analysis of Clinicopathology
In this meta-analysis, clinicopathologic features, such as differentiation grade, TMN stages, metastasis, vascular invasion, tumor encapsulation and liver cirrhosis, impacted by reduced or preserved E-cadherin expression was compared comprehensively on the basis of these 30 enrolled studies, in order to assess the association between E-cadherin expression and these clinicopath-ologic parameters. Some studies stated that lower E-cadherin levels unfavorably impacted clinicopathologic parameters [33,43,51] while the other studies found no significant effect [22,29,46,47,53]. Therefore, we carried out this meta-analysis with expectation of achievement of concensus about the correla-tion of E-cadherin expression and each clinicopathologic param-eter.
Twenty-five studies [22,23,26–29,32–37,40–51,53] evaluated the impact of reduced E-cadherin expression on differentiation grade (III/IV versus I/II), as shown in Fig. 4. The combined OR was 0.31 (95% CI: 0.21–0.45, Z = 6.04, P,0.00001), indicating that down-regulated expression E-cadherin yielded advanced differentiation grade, correlated with poorer prognosis. Ten studies [34,38,41,43,45,47,50–53] assessing the effect of reduced cadherin expression on metastasis reported that reduced E-cadherin level was apt to cause metastasis (Fig. 5). The pooled OR was 0.31 (95% CI: 0.16–0.60, Z = 3.50, P = 0.0005) and statistical heterogeneity was significant (I2
= 69%). As shown in Fig. 6, the pooled analysis based on other twelve studies [22,23,29,37,40– 42,45,49–52] suggested that there was significant correlation between reduced E-cadherin expression and vascular invasion with no significant heterogeneity (I2
= 16%). The pooled OR was 0.76 (95% CI: 0.59–0.98, Z = 2.14, P = 0.03). Moreover, thirteen studies [22,23,28,34,37,42,43,47–49,51–53] assessed the relation-ship of decreased E-cadherin level with TMN stages (T3/T4 versus T1/T2), as depicted in Fig. 7. The pooled OR was 0.61 (95% CI: 0.38–0.98, Z = 2.05, P = 0.04), indicating that there was comparatively significant correlation between decreased E-cad-herin level with TMN stages (T3/T4 versus T1/T2). All the above results denoted that reduced E-cadherin expression would exert potential harm to clinicopathologic parameters. The
down-regulated E-cadherin expression could serve as a prognostic predictor for patients with HCC.
Additionally, we also assessed the association of reduced E-cadherin expression with tumor encapsulation and liver cirrhosis on the basis of seven studies [22,23,40,42,43,50,52] and ten studies [22,23,31,34,40,42,43,49,52,53], respectively. However, no signif-icant association was found between reduced E-cadherin expres-sion and poor tumor encapsulation (Fig. 8) and liver cirrhosis (Fig. 9) with no significant heterogeneity (0% and 19%). The combined ORs were 0.84 (95% CI: 0.62–1.14, Z = 1.14, P = 0.25), 0.92 (95% CI: 0.69–1.24, Z = 0.55, P = 0.58), respectively.
Publication Bias
Begg’s test indicated that there was seemingly significant publication bias in OS and several other clinicopathologic parameters after assessing the funnel plot (Figure S1a–c, Figure S2a–c, Figure S3, Figure S4, Figure S5, Figure S6, Figure S7, Figure S8) for the studies included in our meta-analysis.
Discussion
Meta-analytical technique is a useful tool in clinical researches and has been utilized more and more commonly. It can evaluate previous studies qualitatively and quantitatively, especially for those subjects still with controversial results, by integrating and comparing these results to estimate the outcome of interests. What’s worth mentioning, so far, tremendous work dedicated to investigating the relationship of E-cadherin levels and the prognosis of patients with HCC has been done with achieving no concensus. Therefore, we took the first effort to conduct a systematical and comprehensive meta-analysis to assess the relationship between them two. And it would also obviously provide useful information for clinical decision-making and effective targets for clinical therapies to treat HCCs.
Despite new therapies of HCC arising continually, the prognosis remains not very optimistic recently. That’s why many researchers have been dedicated to finding out predictors of prognosis. As is known to us all, many prognostic markers, such as surviving and MMP9, have been well studied. These markers could influence Figure 4. Forest plot displaying the results of the meta-analysis
on differentiation grade.
doi:10.1371/journal.pone.0103952.g004
Figure 5. Forest plot displaying the results of the meta-analysis on metastasis.
doi:10.1371/journal.pone.0103952.g005
Figure 6. Forest plot displaying the results of the meta-analysis on vascular invasion.
doi:10.1371/journal.pone.0103952.g006
E-Cadherin and Hepatocellular Carcinoma
tumor metastasis and recurrence, the main two causes leading to poor prognosis. But unfortunately, all these markers alone could not predict the prognosis of patients with HCC reliably and exactly. So more iconic markers are needed as supplementary.
A newly-developed program, namely epithelial-mesenchymal transition (EMT) has been evidenced to participate in promoting progression and metastases of many epithelium-derived carcinoma including HCC [54]. During the process of EMT, epithelial cells actively downregulate cell–cell adhesion systems, lose polarity, and acquire a mesenchymal phenotype. This phenotype enables tumor cells to infiltrate surrounding tissues, and thus license these cells to metastasize in distant sites [21]. What’s more, snail and twist1 are the core transcription inhibitory factors during the process of EMT. The two factors can directly lead to reduced E-cadherin expression which is gradually became a hot spot in the field of cancer research. Downregulated E-cadherin expression indicates worse prognosis in some cancer [21]. E-cadherin is the major member of cell adhesion molecule family expressed by epithelial cells. It plays very important role in cell adhesion and differen-tiation [55]. According to the latest literatures [41,42,53], reduced E-cadherin expression had an adverse effect on the prognosis of patients with HCC and suggested that E-cadherin might be a factor to predict prognosis of patients with HCC.
We carried out this meta-analysis to examine whether and how E-cadherin level impacts the prognosis of patients with HCC. All available data are extracted from multiple databases including The Pubmed, Elsevier, Embase, Cochrane Library, and Web of Science. Low E-cadherin expression was observed in 41.95% of 2415 tissue samples included in our meta-analysis. Moreover, based on those extracted data, the association of reduced E-cadherin expression with OS, RFS, differentiation grade, metas-tasis, vascular invasion, TMN stage, tumor encapsulation and liver cirrhosis of HCCs was investigated. It was found that HCC with reduced E-cadherin expression became more aggressive and metastatic. Particularly, the results of this meta-analysis suggested that there was significant correlation between reduced E-cadherin expression and poor OS and RFS, indicating that reduced E-cadherin expression exerted a harmful effect on prognosis of patients with HCC. Moreover, lower E-cadherin level had significant correlation with metastasis, vascular invasion, advanced
differentiation grade and TMN stages (T3/T4 versus T1/T2). But no significant association was found between lower E-cadherin level and poor tumor encapsulation and liver cirrhosis. All these results, taken together, denoted that reduced E-cadherin expres-sion significantly correlated with poor prognosis of HCC.
However, some limitations need to be interpreted cautiously for further consideration in this meta-analysis. First, heterogeneity was inevitable among the groups due to impossibility to match patient characteristics in all studies. We used a random-effects model in order to eliminate variations across studies. Although it could not necessarily rule out the effect of heterogeneity among studies, the adverse influence will be weakened to some degree. Second, bias was unavoidable for clinical evidence because the relevant data were extracted from non-randomized controlled trials (NRCTs). The potential risks exist to weaken the results of large sample with better quality and strengthen the effect of the small sample with worse quality. Third, studies performed with positive results or significant outcomes will be apt to be published, suggesting a potential publication bias. Fourth, reports in other languages than English were excluded, so potential language bias may be present in our meta-analysis. Fifth, a significant heterogeneity might also be brought about in this meta-analysis by the difference of the antibodies used to test E-cadherin expression. Besides, other clinical characteristics of patients such as age, sex, different chemotherapies and radiotherapies in each study will obviously lead to bias. Further investigation should be given in determining whether these factors influence the results of the meta-analysis.
The prognostic significance of reduced or constant E-cadherin expression for HCCs was identified by comparing the depth of tumor invasion, lymph node metastasis, and clinical stage, cell differentiation, tumor grade and other clinicopathological features. Eventually, the data showed that reduced E-cadherin levels significantly associated with poor prognosis for patients with HCC. Thus, reduced E-cadherin expression may serve as a potential predictor for prognosis of patients with HCC.
Supporting Information
Figure S1 Funnel plot to assess publication bias. a. Begg’s publication bias plot showed no publication bias for studies regarding reduced E-cadherin expression and 1-year overall survival (OS) in the meta-analysis.b.Begg’s publication bias plot showed the presence of publication bias for studies regarding reduced E-cadherin expression and 3-year OS in the
meta-analysis.c. Begg’s publication bias plot showed the presence of publication bias for studies regarding reduced E-cadherin expression and 5-year OS in the meta-analysis.
(TIF)
Figure S2 Funnel plot to assess publication bias. a. Begg’s publication bias plot showed no publication bias for studies regardingreducedE-cadherin expression and 1-year reccurrence-free survival (RFS) in the meta-analysis.b.Begg’s publication bias Figure 7. Forest plot displaying the results of the meta-analysis
on TMN stage.
doi:10.1371/journal.pone.0103952.g007
Figure 8. Forest plot displaying the results of the meta-analysis on tumor encapsulation.
doi:10.1371/journal.pone.0103952.g008
Figure 9. Forest plot displaying the results of the meta-analysis on liver cirrhosis.
plot showed no publication bias for studies regardingreduced E-cadherin expression and 3-year RFS in the meta-analysis. c. Begg’s publication bias plot showed no publication bias for studies regardingreducedE-cadherin expression and 5-year RFS in the meta-analysis.
(TIF)
Figure S3 Funnel plot to assess publication bias.Begg’s publication bias plot showed the presence of publication bias for studies regardingreducedE-cadherin expression and differentia-tion grade in the meta-analysis.
(TIF)
Figure S4 Funnel plot to assess publication bias.Begg’s publication bias plot showed the presence of publication bias for studies regardingreducedE-cadherin expression and metastasis in the meta-analysis.
(TIF)
Figure S5 Funnel plot to assess publication bias.Begg’s publication bias plot showed no publication bias for studies regardingreducedE-cadherin expression and vascular invasion in the meta-analysis.
(TIF)
Figure S6 Funnel plot to assess publication bias.Begg’s publication bias plot showed the presence of publication bias for
studies regardingreducedE-cadherin expression and TMN stage ((III/IV versus I/II)) in the meta-analysis.
(TIF)
Figure S7 Funnel plot to assess publication bias.Begg’s publication bias plot showed no publication bias for studies regardingreducedE-cadherin expression and tumor encapsulation in the meta-analysis.
(TIF)
Figure S8 Funnel plot to assess publication bias.Begg’s publication bias plot showed no publication bias for studies regardingreducedE-cadherin expression and liver cirrhosis in the meta-analysis.
(TIF)
Checklist S1
(DOC)
Author Contributions
Conceived and designed the experiments: XC. Performed the experiments: JC JZ. Analyzed the data: JC JZ RM HL XL. Contributed reagents/ materials/analysis tools: JC JZ RM HL XL. Contributed to the writing of the manuscript: JC.
References
1. Li WQ, Park Y, McGlynn KA, Hollenbeck AR, Taylor PR, et al. (2014) Index-based dietary patterns and risk of incident hepatocellular carcinoma and mortality from chronic liver disease in a prospective study. Hepatology: [Epub ahead of print].
2. Ladep NG, Khan SA, Crossey MM, Thillainayagam AV, Taylor-Robinson SD, et al. (2014) Incidence and mortality of primary liver cancer in England and Wales: Changing patterns and ethnic variations. World Journal of Gastroenter-ology 20: 1544–53.
3. Yip B, Wantuck JM, Kim LH, Wong RJ, Ahmed A, et al. (2013) Clinical Presentation and Survival of Asian and Non-Asian Patients with HCV-Related Hepatocellular Carcinoma. Digestive Diseases and Sciences 59: 192–200. 4. Katanoda K, Matsuda T, Matsuda A, Shibata A, Nishino Y, et al. (2013) An
Updated Report of the Trends in Cancer Incidence and Mortality in Japan. Japanese Journal of Clinical Oncology 43: 492–507.
5. Gao J, Xie L, Chen WQ, Zhang SW, Wu QJ, et al. (2013) Rural–urban, sex variations, and time trend of primary liver cancer incidence in China, 1988– 2005. European Journal of Cancer Prevention 22: 448–54.
6. Altekruse SF, Henley SJ, Cucinelli JE, McGlynn KA (2014) Changing hepatocellular carcinoma incidence and liver cancer mortality rates in the United States. Am J Gastroenterol 109: 542–53.
7. Lee SC, Tan HT, Chung MC (2014) Prognostic biomarkers for prediction of recurrence of hepatocellular carcinoma: Current status and future prospects. World Journal of Gastroenterology 20: 3112–24.
8. Fox R, Berhane S, Teng M, Cox T, Tada T, et al. (2014) Biomarker-based prognosis in hepatocellular carcinoma: validation and extension of the BALAD model. Br J Cancer 110: 2090–8.
9. Ozaki K, Toshikuni N, George J, Minato T, Matsue Y, et al. (2014) Serum Endocan as a Novel Prognostic Biomarker in Patients with Hepatocellular Carcinoma. Journal of Cancer 5: 221–30.
10. Lee HJ, Yeon JE, Suh SJ, Lee SJ, Yoon EL, et al. (2014) Clinical Utility of Plasma Glypican-3 and Osteopontin as Biomarkers of Hepatocellular Carcino-ma. Gut and Liver 8: 177–85.
11. Sekar P, Bharti JN, Nigam JS, Sharma A, Soni PB (2014) Evaluation of p53, HoxD10, and E-Cadherin Status in Breast Cancer and Correlation with Histological Grade and Other Prognostic Factors. Journal of Oncology. [Epub ahead of print].
12. Pectasides E, Rampias T, Sasaki C, Perisanidis C, Kouloulias V, et al. (2014) Markers of Epithelial to Mesenchymal Transition in Association with Survival in Head and Neck Squamous Cell Carcinoma (HNSCC). PLoS ONE 9: e94273. 13. Pryczynicz A, Guzin´ska-Ustymowicz K, Niewiarowska K, Cepowicz D, Kemona A (2014) PRL-3 and E-cadherin show mutual interactions and participate in lymph node metastasis formation in gastric cancer. Tumor Biology. [Epub ahead of print].
14. Chen Z, He X, Jia M, Liu Y, Qu D, et al. (2013)b-catenin Overexpression in the Nucleus Predicts Progress Disease and Unfavourable Survival in Colorectal Cancer: A Meta-Analysis. PLoS ONE 8: e63854.
15. Breier G, Grosser M, Rezaei M (2014) Endothelial cadherins in cancer. Cell and Tissue Research 355: 523–7.
16. Fan CC, Wang TY, Cheng YA, Jiang S, Cheng CW, et al. (2013) Expression of E-cadherin, Twist, and p53 and their prognostic value in patients with oral squamous cell carcinoma. Journal of Cancer Research and Clinical Oncology 139: 1735–44.
17. Jung SP, Kim S, Nam SJ, Kim I, Bae JW (2013) The role of the CDH1 promoter hypermethylation in the axillary lymph node metastasis and prognosis. J Breast Cancer 16: 16–22.
18. Tanaka Y, Terai Y, Kawaguchi H, Fujiwara S, Yoo S, et al. (2013) Prognostic impact of EMT (epithelial-mesenchymal-transition)-related protein expression in endometrial cancer. Cancer Biol Ther 14: 13–19.
19. Luo SL, Xie YG, Li Z, Ma JH, Xu X (2014) E-cadherin expression and prognosis of oral cancer: a meta-analysis. Tumor Biology. [Epub ahead of print]. 20. Xing XB, Tang YB, Yuan G, Wang Y, Wang J, et al. (2013) The prognostic value of E-cadherin in gastric cancer: A meta-analysis. International Journal of Cancer 132: 2589–96.
21. He X, Chen Z, Jia M, Zhao X (2013) Downregulated E-cadherin expression indicates worse prognosis in Asian patients with colorectal cancer: evidence from meta-analysis. PLoS One 8: e70858.
22. Xia L, Huang W, Tian D, Zhu H, Qi X, et al. (2013) Overexpression of forkhead box C1 promotes tumor metastasis and indicates poor prognosis in hepatocellular carcinoma. Hepatology 57: 610–24.
23. Zhang L, Huang G, Li X, Zhang Y, Jiang Y, et al. (2013) Hypoxia induces epithelial-mesenchymal transition via activation of SNAI1 by hypoxia-inducible factor -1ain hepatocellular carcinoma. BMC Cancer 13: 108.
24. Zhan P, Ji YN (2014) Prognostic significance of TP53 expression for patients with hepatocellular carcinoma: a meta-analysis. Hepatobiliary Surg Nutr 3: 11– 7.
25. Chen J, Sun MX, Hua YQ, Cai ZD (2014) Prognostic significance of serum lactate dehydrogenase level in osteosarcoma: a meta-analysis. Journal of Cancer Research and Clinical Oncology. 140: 1205–10.
26. Yamaoka K, Nouchi T, Tazawa J, Hiranuma S, Marumo F, et al. (1995) Expression of gap junction protein connexm 32 and E-cadherin in human hepatocellular carcinoma. J Hepatol 22: 536–9.
27. Ihara A, Koizumi H, Hashizume R, Uchikoshi T (1996) Expression of epithelial cadherin and alpha- and beta-catenins in nontumoral livers and hepatocellular carcinomas. Hepatology 23: 1441–7.
28. Matsumura T, Makino R, Mitamura K (2001) Epigenetic Changes in the Malignant Progression of Frequent Down-Regulation of E-cadherin by Genetic and epigenetic changes in the malignant progression of hepatocellular carcinomas. Clin Cancer Res 7: 594–9.
29. Wei Y, Van Nhieu JT, Prigent S, Srivatanakul P, Tiollais P, et al. (2002) Altered expression of E-cadherin in hepatocellular carcinoma: Correlations with genetic alterations,b-catenin expression, and clinical features. Hepatology 36: 692–701. 30. Lee S, Lee HJ, Kim JH, Lee HS, Jang JJ, et al. (2003) Aberrant CpG island hypermethylation along multistep hepatocarcinogenesis. Am J Pathol 163: 1371–8.
E-Cadherin and Hepatocellular Carcinoma
31. Herath NI, Walsh MD, Kew MC, Young J, Leggett BA, et al. (2004) Cadherin/ catenin complex appears to be intact in hepatocellular carcinomas from Australia and South Africa. J Gastroenterol Hepatol 19: 676–82.
32. Kwon GY, Yoo BC, Koh KC, Cho JW, Park WS, et al. (2005) Promoter Methylation of E-cadherin in Hepatocellular Carcinomas and Dysplastic Nodules. J Korean Med Sci 20: 242–7.
33. Liu J, Lian Z, Han S, Waye MMY, Wang H, et al. (2005) Downregulation of E-cadherin by hepatitis B virus X antigen in hepatocellullar carcinoma. Oncogene 25: 1008–17.
34. Guo C, Liu QG, Yang W, Zhang ZL, Yao YM (2008) Relation among p130Cas, E-cadherin and b-catenin expression, clinicopathologic significance and prognosis in human hepatocellular carcinoma. Hepatobiliary Pancreat Dis Int 7: 490–6.
35. Korita PV, Wakai T, Shirai Y, Matsuda Y, Sakata J, et al. (2008) Overexpression of osteopontin independently correlates with vascular invasion and poor prognosis in patients with hepatocellular carcinoma. Human Pathology 39: 1777–83.
36. Du GS, Wang JM, Lu JX, Li Q, Ma CQ, et al. (2009) Expression of P-aPKC-i, E-Cadherin, andb-Catenin Related to Invasion and Metastasis in Hepatocel-lular Carcinoma. Annals of Surgical Oncology 16: 1578–86.
37. Woo HY, Min AL, Choi JY, Bae SH, Yoon SK, et al. (2011) Clinicopathologic significance of the expression of Snail in hepatocellular carcinoma. The Korean Journal of Hepatology 17: 12–8.
38. Zhao XL, Sun T, Che N, Sun D, Zhao N, et al. (2011) Promotion of hepatocellular carcinoma metastasis through matrix metalloproteinase activation by epithelial-mesenchymal transition regulator Twist1. Journal of Cellular and Molecular Medicine 15: 691–700.
39. Xia H, Ooi LLPJ, Hui KM (2012) MiR-214 Targetsb-Catenin Pathway to Suppress Invasion, Stem-Like Traits and Recurrence of Human Hepatocellular Carcinoma. PLoS ONE 7: e44206.
40. Ding S, Zhang W, Xu Z, Xing C, Xie H, et al. (2013) Induction of an EMT-like transformation and MET invitro. J Transl Med 11: 164.
41. Hashiguchi M, Ueno S, Sakoda M, Iino S, Hiwatashi K, et al. (2013) Clinical implication of ZEB-1 and E-cadherin expression in hepatocellular carcinoma (HCC). BMC Cancer 13: 572.
42. Liu TA, Jan YJ, Ko BS, Liang SM, Chen SC, et al. (2013) 14-3-3e
Overexpression Contributes to Epithelial-Mesenchymal Transition of Hepato-cellular Carcinoma. PLoS ONE 8: e57968.
43. Pan JJ, Ge YS, Xu GL, Jia WD, Liu WF, et al. (2013) The expression of chitinase 3-like 1: a novel prognostic predictor for hepatocellular carcinoma. Journal of Cancer Research and Clinical Oncology 139: 1043–54.
44. Endo K, Ueda T, Ueyama J, Ohta T, Terada T (2000) Immunoreactive e-cadherin, alpha-catenin, beta-catenin, and gamma-catenin proteins in hepato-cellular carcinoma: Relationships with tumor grade, clinicopathologic param-eters, and patients. Human Pathology 31: 558–65.
45. Asayama Y, Taguchi Ki K, Aishima Si S, Nishi H, Masuda K, et al. (2002) The mode of tumour progression in combined hepatocellular carcinoma and cholangiocarcinoma: an immunohistochemical analysis of E-cadherin, alpha-catenin and beta-alpha-catenin. Liver 22: 43–50.
46. Satoshi I, Masayuki I, Shinya A, Toru K, Masao H, et al. (2002) Expression and Prognostic Roles of b-Catenin in Hepatocellular Carcinoma Correlation with Tumor Progression and Postoperative Survival. Clinical Cancer Research 8: 450–6.
47. Yamaoka H, Ohtsu K, Sueda T, Yokoyama T, Hiyama E (2006) Diagnostic and prognostic impact ofb-catenin alterations in pediatric liver tumors. Oncol Rep 15: 551–6.
48. Cho SB, Lee KH, Lee JH, Park SY, Lee WS, et al. (2008) Expression of E- and N-cadherin and clinicopathology in hepatocellular carcinoma. Pathology International 58: 635–42.
49. Wu LQ, Lu Y, Lu HJ, Lv ZH (2008) Can E-cadherin and CD34 be used as indicators of prognosis for hepatocellular carcinoma patients? Clinical Chemistry and Laboratory Medicine 46: 1122–6.
50. Higashi Y, Suzuki S, Sakaguchi T, Nakamura T, Baba S, et al. (2007) Loss of Claudin-1 Expression Correlates with Malignancy of Hepatocellular Carcinoma. Journal of Surgical Research 139: 68–76.
51. Zhai B, Yan HX, Liu SQ, Chen L, Wu MC, et al. (2008) Reduced expression of E-cadherin/catenin complex in hepatocellular carcinomas. World Journal of Gastroenterology 14: 5665–73.
52. Jiang XM, Zhang JB, Xiong J, Huang XX, Ren ZG (2012) Altered Distribution and Expression Pattern of E-cadherin in Hepatocellular Carcinomas: Correla-tions with Prognosis and Clinical Features. Asian Pacific Journal of Cancer Prevention 13: 6455–61.
53. Zhang CH, Xu GL, Jia WD, Li JS, Ma JL, et al. (2012) Activation of STAT3 Signal Pathway Correlates with Twist and E-Cadherin Expression in Hepatocellular Carcinoma and Their Clinical Significance. Journal of Surgical Research 174: 120–9.
54. Arias AM (2001) Epithelial mesenchymal interactions in cancer and develop-ment. Cell 105: 425–31.