The M235T Polymorphism in the
AGT
Gene and CHD
Risk: Evidence of a Hardy-Weinberg Equilibrium
Violation and Publication Bias in a Meta-Analysis
Mohammad Hadi Zafarmand1,2, Yvonne T. van der Schouw2, Diederick E. Grobbee2, Peter W. de Leeuw3,
Michiel L. Bots2*
1Julius Center for Health Sciences and Primary Care, University Medical Center Utrecht, Utrecht, The Netherlands,2Persian Gulf Health Research Center, Bushehr University of Medical Sciences and Health Services, Bushehr, Iran,3Department of Internal Medicine, University Hospital Maastricht, Maastricht, The Netherlands
Abstract
Background:The M235T polymorphism in theAGTgene has been related to an increased risk of hypertension. This finding may also suggest an increased risk of coronary heart disease (CHD).
Methodology/Principal Findings:A case-cohort study was conducted in 1,732 unrelated middle-age women (210 CHD cases and 1,522 controls) from a prospective cohort of 15,236 initially healthy Dutch women. We applied a Cox proportional hazards model to study the association of the polymorphism with acute myocardial infarction (AMI) (n = 71) and CHD. In the case-cohort study, no increased risk for CHD was found under the additive genetic model (hazard ratio [HR] = 1.20; 95% confidence interval [CI], 0.86 to 1.68;P=0.28). This result was not changed by adjustment (HR = 1.17; 95% CI, 0.83 to 1.64; P=0.38) nor by using dominant, recessive and pairwise genetic models. Analyses for AMI risk under the additive genetic model also did not show any statistically significant association (crude HR = 1.14; 95% CI, 0.93 to 1.39;P=0.20). To evaluate the association, a comprehensive systematic review and meta-analysis were undertaken of all studies published up to February 2007 (searched through PubMed/MEDLINE, Web of Science and EMBASE). The meta-analysis (38 studies with 13284 cases and 18722 controls) showed a per-allele odds ratio (OR) of 1.08 (95% CI, 1.01 to 1.15;P=0.02). Moderate to large levels of heterogeneity were identified between studies. Hardy-Weinberg equilibrium (HWE) violation and the mean age of cases were statistically significant sources of the observed variation. In a stratum of non-HWE violation studies, there was no effect. An asymmetric funnel plot, the Egger’s test (P= 0.066), and the Begg-Mazumdar test (P= 0.074) were all suggestive of the presence of publication bias.
Conclusions/Significance:The pooled OR of the present meta-analysis, including our own data, presented evidence that there is an increase in the risk of CHD conferred by the M235T variant of theAGTgene. However, the relevance of this weakly positive overall association remains uncertain because it may be due to various residual biases, including HWE-violation and publication biases.
Citation:Zafarmand MH, van der Schouw YT, Grobbee DE, de Leeuw PW, Bots ML (2008) The M235T Polymorphism in theAGTGene and CHD Risk: Evidence of a Hardy-Weinberg Equilibrium Violation and Publication Bias in a Meta-Analysis. PLoS ONE 3(6): e2533. doi:10.1371/journal.pone.0002533
Editor:Florian Kronenberg, Innsbruck Medical University, Austria
ReceivedJanuary 23, 2008;AcceptedMay 30, 2008;PublishedJune 25, 2008
Copyright:ß2008 Zafarmand et al. This is an open-access article distributed under the terms of the Creative Commons Attribution License, which permits unrestricted use, distribution, and reproduction in any medium, provided the original author and source are credited.
Funding:The first author has been supported by a grant from the Iranian Ministry of Health and Medical Education (FN12265). The Prospect-EPIC study was funded by ‘‘Europe Against Cancer’’ Programme of the European Commission (SANCO). There are no financial or other relationships that might lead to a conflict of interest.
Competing Interests:The authors have declared that no competing interests exist. * E-mail: [email protected]
Introduction
Angiotensinogen (AGT) is a liver protein that interacts with renin to produce angiotensin I, the pro-hormone of angiotensin II. Angiotensin II is the major effector molecule of the renin-angiotensin-aldosterone system (RAAS) and plays a key role in the regulation of blood pressure (BP) by increasing vascular tone and promoting sodium retention. Genetic variants in the angiotensin-ogen gene modify the plasma concentration of angiotensinangiotensin-ogen, which has been directly related to arterial blood pressure [1]. The molecular variant (M235T) of theAGTgene, encoding a threonine instead of a methionine at residue 235 of the mature protein, has been associated with a higher plasma AGT level and higher BP in
patients homozygous for the T allele and occurs among various ethnic populations [1–3]. In a meta-analysis, the TT genotype was associated with a 32% increase in the risk of hypertension in white people but not in non-white people, when compared with the MM genotype [4].
Given the importance of hypertension in the occurrence of coronary heart disease [5], this finding suggests that this polymorphism may be related to increased risk of CHD. A few studies [6–8], including recent publications, [9,10] have found that there is an association of the M235TAGTvariant with increased CHD risk; however, this relationship was not confirmed in several other studies [11–13] as well as in a meta-analysis [14]. Marked ethnic differences in the frequency of the T allele, small sample
sizes and genotyping or phenotyping errors could partly account for discrepancies among these gene-disease association studies. Therefore, we investigated the association of the M235T polymorphism in theAGTgene (National Center for Biotechnol-ogy Information single nucleotide polymorphism cluster ID rs699) with acute myocardial infarction (AMI) and CHD in a large population-based cohort of middle-aged Dutch women and conducted an updated meta-analysis of the available studies to clarify the role of the M235T polymorphism in CHD risk.
Methods
Case-cohort study
Study design, general questionnaire, anthropometric and laboratory measurements have been described in detail elsewhere [15–16]. Briefly, the study population consisted of participants of the Prospect-EPIC cohort. Participants were recruited between 1993 and 1997 among women living in Utrecht and the vicinity who attended the regional population-based breast cancer-screening program. A total of 17,357 women, aged 49–70, were included. At baseline, a general and a dietary questionnaire were administered, a limited physical examination was performed and a non-fasting blood sample was taken. Follow-up event information was obtained from the Dutch Centre for Health Care Information, which holds a standardized computerized register of hospital discharge diagnoses. Using the International Classification of Diseases, ninth Revision (ICD-9) codes for the main discharge reason, we categorized cardiovascular disease (codes 390–459) as CHD (codes 410–414), including AMI (code 410), and other cardiovascular diseases. Whenever multiple events (AMI and CHD) occurred, the first occurrence of that endpoint was taken as the endpoint of interest in endpoint-specific analyses. All women signed an informed consent form prior to study inclusion. The study was approved by the Institutional Review Board of the University Medical Center Utrecht.
We applied the case-cohort design introduced by Prentice [17]. From the 17,357 women in the total cohort, we randomly selected a sample of 10% as the sub-cohort (n = l736). Women who did not consent to linkage with vital status registries or who were not traceable (cases n = 3/sub-cohort n = 38) were not included. Women who reported a diagnosis of cardiovascular disease (ICD-9; 390–459) at baseline or who had missing questionnaires, blood, or DNA samples were excluded. This resulted in 15,236 women in the total cohort and 1522 women in the sub-cohort (as the control group) at baseline. All individuals with first fatal and non-fatal CHD and ischemic stroke events that arose during follow-up until January 1st2000 were selected as cases. These were 211 CHD cases, including 71 AMIs. For all case subjects, follow-up ended at the date of diagnosis or at the date of death due to cardiovascular disease.
Genetic analysis. Genetic analysis was performed at the Cardiovascular Genotyping (CAGT) laboratory of the Department of Internal Medicine of the University Hospital Maastricht. Genomic DNA was extracted from buffy coats using the QIAampHBlood Kit (Qiagen Inc., Valencia, California, USA). Genotyping of the polymorphisms was performed using a multilocus genotyping assay for candidate markers of cardiovascular disease risk (Roche Molecular Systems Inc., Pleasanton, CA, USA) [18]. Briefly, each DNA sample was amplified using two multiplex polymerase chain reactions, and the alleles were genotyped simultaneously using an array of immobilized sequence-specific oligonucleotide probes. This array of probes was blotted on plastic strips, and, after staining, genotypes were scored based on blue (positive) and white
(negative) bands. Each blue band, representing a specific genotype, was scored by specific software (counting the pixel intensity of each band) and checked manually. Genotyping was performed blinded to the case-control status. A random double-check was performed to detect potential genotyping errors in a subset of 100 samples. The check confirmed the previous genotyping results by 100%.
Data analysis. Hardy-Weinberg equilibrium (HWE) was tested with the x2 test among the controls. Allele frequencies were estimated by gene counting. We used the ANOVAFtest to estimate relationships among the M235T genotypes and continuous variables, while we tested the significance of any difference in proportions by applying thex2 statistic. A p-value
,0.05 (2-sided) was considered statistically significant.
To assess the relationship of the M235T polymorphism in the AGTgene with the outcome, we used a Cox proportional hazards model with an estimation procedure adapted for case-cohort designs. We used the unweighted method by Prentice [17,19], which is incorporated in a SAS macro at http://lib.stat.cmu.edu/ general/robphreg. A previous meta-analysis [14] showed that the effect of theAGTM235T variant on its intermediate phenotype (plasma angiotensinogen level) follows an additive model accord-ing to the number of T alleles [5% (95% CI: 2 to 8%) increase for the MT and 11% (95% CI: 7 to 15%) increase for the TT genotype versus the MM genotype]. Therefore, our priori hypothesis was that the association between the M235T polymorphism in the AGT gene and CHD follows an additive model according to the number of T alleles. However, other genetic models were evaluated as well. We considered different modes of inheritance as follows:the additive ‘‘per-allele’’ model, the T allele was compared between cases and controls by assigning scores of 0, 1, and 2 to homozygotes for the M allele, heterozygotes, and homozygotes for the T allele, respectively;the recessive model, the TT genotype versus the MT and MM combined genotypes; and the dominant model, the MT and TT genotypes combined versus the MM genotype. We also performed separate pairwise comparisons of the MT and TT genotypes versus the MM genotype.
Meta-analysis
Searching. We searched PubMed/MEDLINE, Web of Science, and EMBASE up to February 2007 for observational studies evaluating an association between the M235T polymorphism in theAGT gene and CHD. Terms used for the search contained both medical subject heading terms and text words: (Met235Thr OR M235T OR T704C) AND (angiotensinogen OR AGT) AND (polymorphism OR mutation OR genetic OR genotype) AND (‘‘coronary disease’’ OR ‘‘coronary heart disease’’ OR CHD OR ‘‘myocardial infarction’’ OR MI OR ‘‘myocardial infarct’’ OR ‘‘coronary artery disease’’ OR CAD OR ‘‘ischemic heart disease’’ OR IHD OR ‘‘cardiovascular disease’’ OR ‘‘heart disease’’ OR angina). We also retrieved additional studies by hand searching the bibliographies of original research reports and review articles and through the MEDLINE option ‘‘related articles’’. Search results were limited to articles published in English and studies on human subjects.
Selection. All studies were considered potentially eligible if they aimed to investigate the relationship between the M235T genotypes and risk of CHD or MI. Any observational study, regardless of sample size, which fulfilled the following criteria, was included: (i)AGTM235T genotype frequencies were provided by case-control status (studies without controls were excluded); (ii) risk of CHD or MI was evaluated (studies on recurrent coronary events AGT M235T Variant and CHD
were excluded); (iii) relevant data were presented to calculate the effect size and its 95% CI; (iv) non-overlapping data were contained. For duplicate publications, the study with the smaller data set was excluded.
Data abstraction. The following information was extracted from each study that we included: the first author’s name; country; year of publication; the population evaluated; study design; mean age or age range for case-patients and controls; definition and number of cases and controls; allele frequencies and genotype distribution in case-patients and controls (where data were not given, they were calculated from the corresponding genotyping frequencies of the case and control groups); consistency of genotype frequencies with HWE (calculated); gender in the evaluated population and male percentage, matching variables, use of blinding of genotyping staff, performing regenotyping of a random sample, and crude ORs and 95% CIs for development of CHD or MI related to theAGTgene genotypes based on different genetic models (from the original paper or calculated from crude data if not provided). We again considered a dominant, a recessive, an additive ‘‘per-allele’’ model and pairwise comparisons. Data were extracted independently and entered into separate databases by two authors (performed by MHZ and MLB). Results were compared, and disagreements were resolved by a consensus.
Quantitative data synthesis. The method of Mantel-Haenszel was used to calculate the odds ratio for the pooled data in a fixed-effects model, and, if there was evidence for heterogeneity, the DerSimonian-Laird method was used for the pooled odds ratio in a random-effects model, under pairwise comparisons of the different genotypes and dominant, recessive, and additive inheritance models. For all the models used, the T allele was considered the risk allele. The genetic model to be considered as thepriorihypothesis was the additive model. In each study, we tested for HWE by using thex2 test or an exact test among the controls by using the genhwi command in Stata 9.2 [20].
In addition, we used Cochran’s x2
– based Q statistic for between-study heterogeneity, which is considered to be significant forP,0.10, as well as theI2statistic for estimation of inconsistency in meta-analyses [20].I2represents the percentage of the observed between-study variability due to heterogeneity rather than to chance. It ranges between 0% and 100%, where a value of 0% indicates no observed heterogeneity, and larger values indicate an increasing degree of heterogeneity (roughly suggested cut-off points include: I2= 0–25%, no heterogeneity; I2= 25–50%, moderate heterogeneity; I2= 50–75%, large heterogeneity;
I2= 75–100%, extreme heterogeneity) [21].
We used funnel plots to examine the publication bias of reported associations. We also used Egger’s test and the Begg-Mazumdar test with 95% CI for evaluation of publication bias, which are considered to be significant forP,0.10. Meta-analysis was carried out using STATA 9.2. We used random effect meta-regression models with restricted maximum likelihood estimation to evaluate the extent to which different variables explained heterogeneity among the individual ORs. The pre-specified characteristics for assessment of sources of inter-study heteroge-neity were: study size (for detailed definition see [22]); ethnicity of population evaluated (of Caucasian descent, East Asian, and others); male percentage in each study, matching (matched or unmatched); blinding of genotyping staff (blinded, or not reported); performing regenotyping of a random sample (per-formed or not reported); violating HWE (violated or confirmed; the term ‘‘violated’’ used for statistically significant deviation of HWE) in sub-group analysis as well as in meta-regression analysis.
HWE Correction. For evaluating the impact of HWE-violated studies on effect estimates (at the 0.05 significance level) under different genetic models, odds ratios, and variances were corrected by using the HWE-predicted genotype counts in the control instead of the observed counts as previously suggested [20]. Thereafter, they were included in the sensitivity analysis.
Results
Prospect-EPIC study results
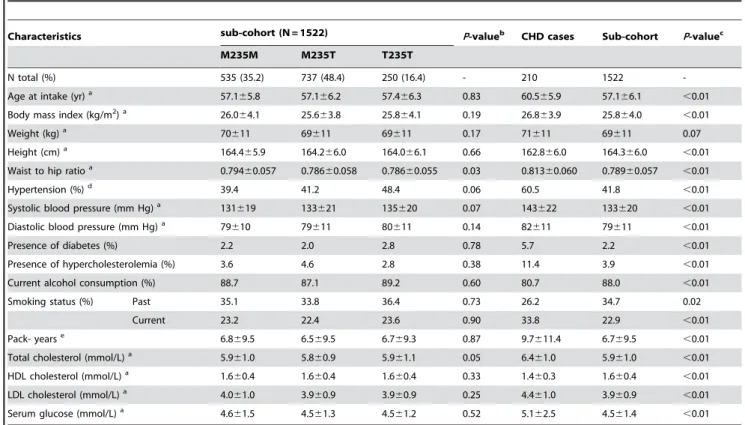
The general characteristics of the randomly sampled partici-pants of the cohort (N = 1522) are given in Table 1. The genotype distribution was in Hardy-Weinberg equilibrium (x2=0.020;
P=0.89). General and clinical characteristics of CHD cases and controls are shown in Table 1. The median follow up time for the random sample was 4.3 years, with a total of 6,523 person years. The actual follow-up in the baseline cohort of 15,236 women was 64,768 person years. Due to the case-cohort design, 23 women in the sub-cohort eventually were CHD cases (among which there were nine AMI cases).
Due to the association of the M235T genotypes with some risk factors of CHD, we presented crude models and models adjusted for hypertension, total cholesterol and waist to hip ratio as potential confounding factors. Table 2 presents hazard ratios of AMI and CHD under different genetic models. Under the additive model of inheritance, no increased risk for CHD was found (HR = 1.20; 95% CI, 0.86 to 1.68;P=0.28), which did not alter after adjustment (HR = 1.17; 95% CI, 0.83 to 1.64;P=0.38). The same was true for other comparisons (Table 2). Analyses for AMI risk did not show any statistically significant associations (Table 2).
Meta-Analysis results
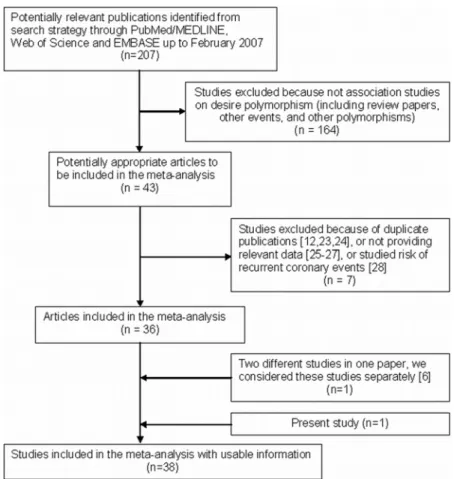
Flow of included studies. A total of 44 gene-disease association studies, including the present study, evaluating the AGTM235T gene variant and CHD risk were identified. Seven articles were excluded, three of which were duplicate publications [12,23,24], three of which did not provide relevant data [25–27], and one of which studied the risk of recurrent coronary events [28]. Finally, 37 studies met the selection criteria. In one paper, the provided results were based on two different studies [6], so both were included in the meta-analysis. Therefore, 38 studies with 13,284 cases and 18,722 controls were included in the final meta-analysis (Figure 1).
Study characteristics
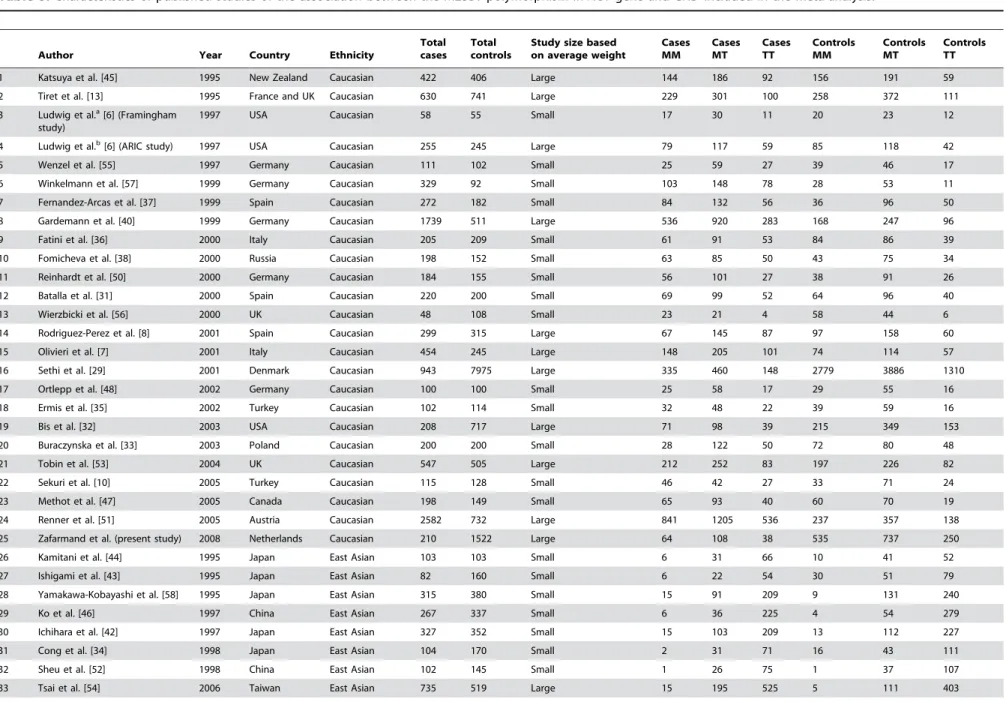
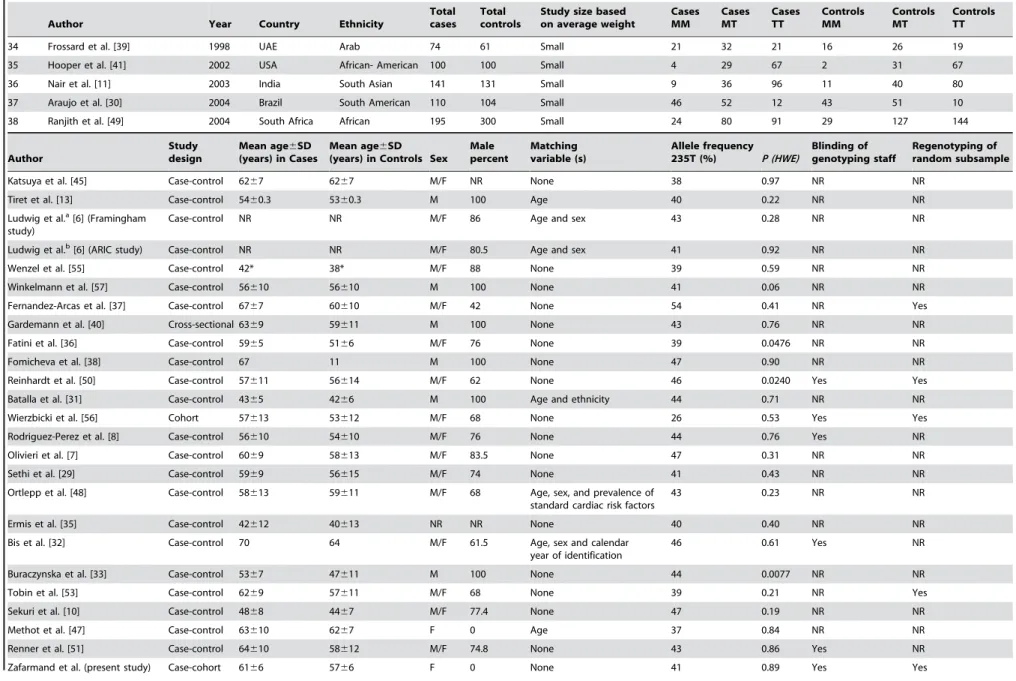
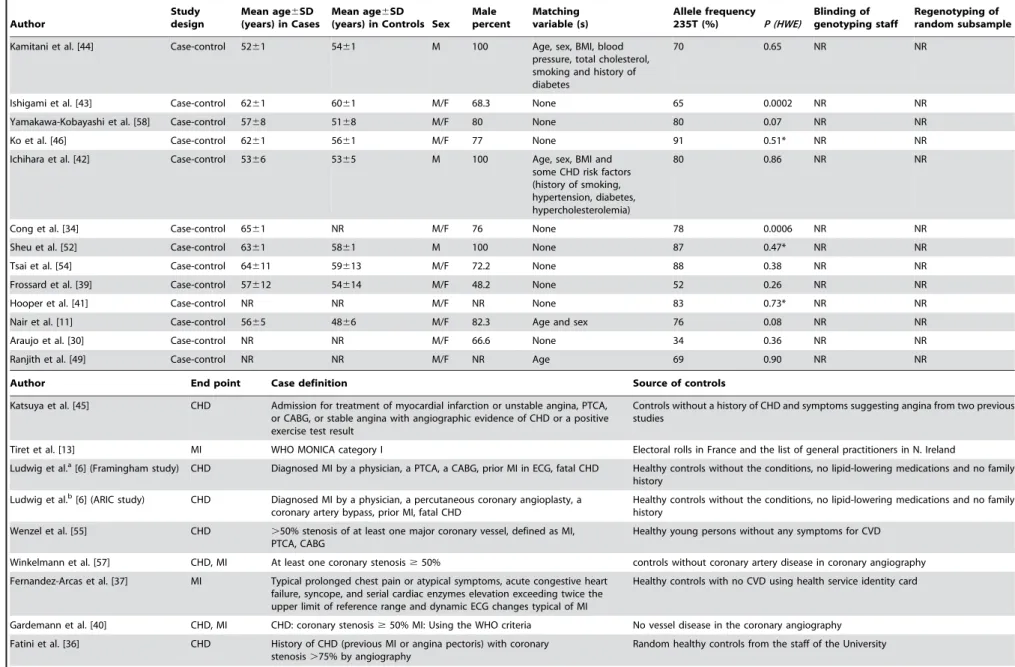
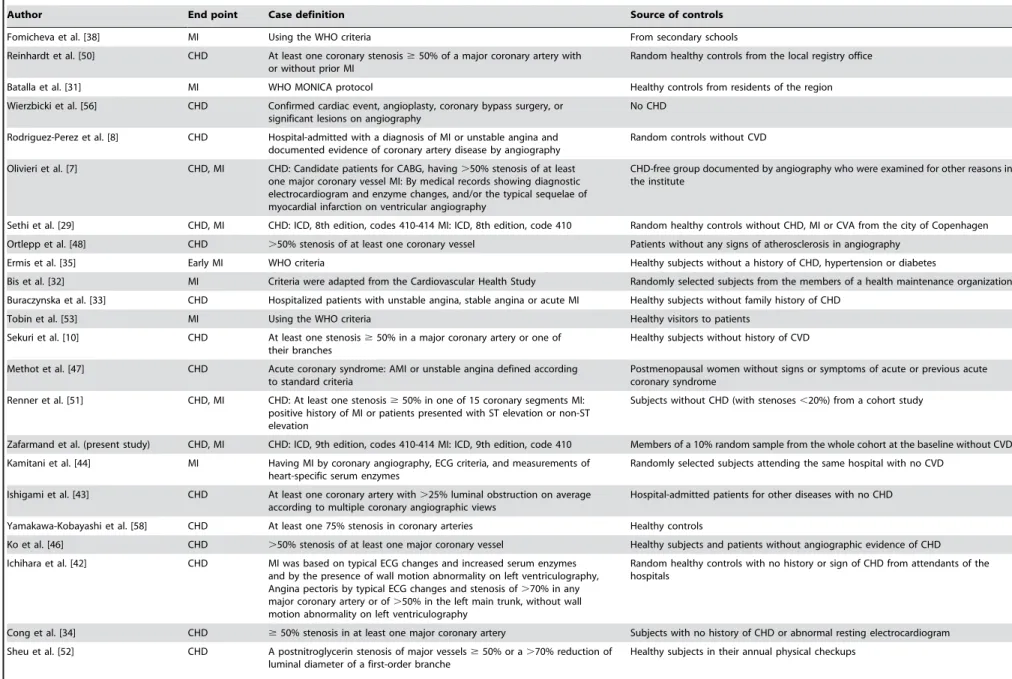
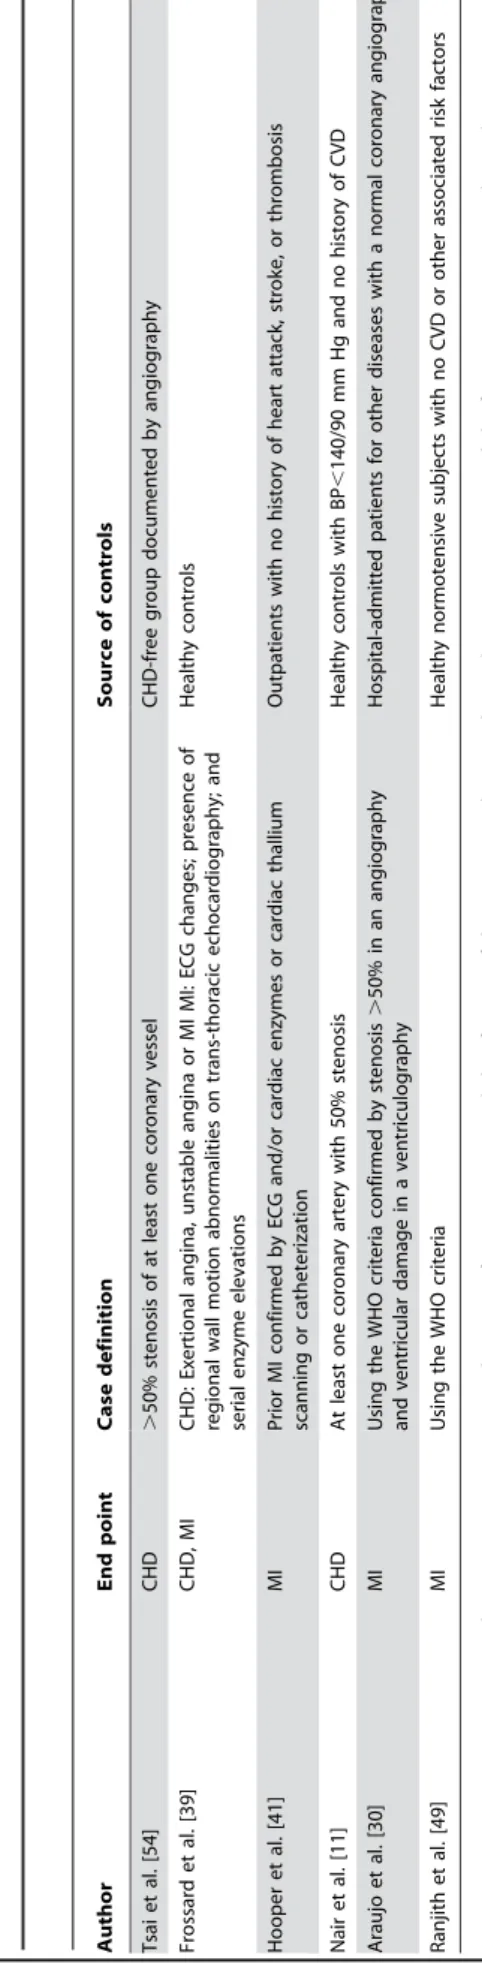
Characteristics of the studies are shown in Table 3 [6– 8,10,11,13,29–58]. There were 25 studies in Caucasians, eight studies in East Asians, and five studies in other populations (West Asian, South Asian, African, African-American, and South American). The last was collapsed into a miscellaneous group. The design of the studies was case-control, except for three studies that were prospective cohort [56], case-cohort (present study), and cross-sectional [40]. The T allele frequency varied from 26 to 54 percent in Caucasians, 65 to 91 percent in East Asians, and 34 to 83 percent in the miscellaneous group.
All studies used polymerase chain reaction methods for genotyping, and most used a restriction fragment length method for polymorphism analysis. Blinding of investigators involved in genotyping with respect to the case/control status of the participants was reported in six studies [8,32,50,51,56]. A random double-check to detect potential genotyping errors was mentioned in five studies [37,50,53,56]. In most of the studies, the genotype frequencies were consistent with HWE. However, statistically significant deviations from HWE were found in five studies AGT M235T Variant and CHD
Table 1.Baseline characteristics of the sub-cohort according to genotype, and clinical characteristics of CHD cases and controls in the Prospect –Epic cohort.
Characteristics sub-cohort (N = 1522) P-valueb CHD cases Sub-cohort P-valuec
M235M M235T T235T
N total (%) 535 (35.2) 737 (48.4) 250 (16.4) - 210 1522
-Age at intake (yr)a 57.1
65.8 57.166.2 57.466.3 0.83 60.565.9 57.166.1 ,0.01
Body mass index (kg/m2)a 26.0
64.1 25.663.8 25.864.1 0.19 26.863.9 25.864.0 ,0.01
Weight (kg)a 70
611 69611 69611 0.17 71611 69611 0.07
Height (cm)a 164.4
65.9 164.266.0 164.066.1 0.66 162.866.0 164.366.0 ,0.01
Waist to hip ratioa 0.794
60.057 0.78660.058 0.78660.055 0.03 0.81360.060 0.78960.057 ,0.01
Hypertension (%)d 39.4 41.2 48.4 0.06 60.5 41.8
,0.01
Systolic blood pressure (mm Hg)a 131
619 133621 135620 0.07 143622 133620 ,0.01
Diastolic blood pressure (mm Hg)a 79610 79611 80611 0.14 82611 79611 ,0.01
Presence of diabetes (%) 2.2 2.0 2.8 0.78 5.7 2.2 ,0.01
Presence of hypercholesterolemia (%) 3.6 4.6 2.8 0.38 11.4 3.9 ,0.01
Current alcohol consumption (%) 88.7 87.1 89.2 0.60 80.7 88.0 ,0.01
Smoking status (%) Past 35.1 33.8 36.4 0.73 26.2 34.7 0.02
Current 23.2 22.4 23.6 0.90 33.8 22.9 ,0.01
Pack- yearse 6.8
69.5 6.569.5 6.769.3 0.87 9.7611.4 6.769.5 ,0.01
Total cholesterol (mmol/L)a 5.9
61.0 5.860.9 5.961.1 0.05 6.461.0 5.961.0 ,0.01
HDL cholesterol (mmol/L)a 1.6
60.4 1.660.4 1.660.4 0.33 1.460.3 1.660.4 ,0.01
LDL cholesterol (mmol/L)a 4.0
61.0 3.960.9 3.960.9 0.25 4.461.0 3.960.9 ,0.01
Serum glucose (mmol/L)a 4.6
61.5 4.561.3 4.561.2 0.52 5.162.5 4.561.4 ,0.01
HDL, high-density lipoprotein; LDL, low-density lipoprotein; CHD, coronary heart disease (ICD 410–414).
aMean
6standard deviation.
bComparison of risk factors across genotypes, using the ANOVAFtest (continuous variables) and thex2statistic (categorical variables).
cComparison of risk factors across disease status, using theindependent samples t-test(continuous variables) and thex2statistic (categorical variables). dDefined as a systolic blood pressure
$140 mm Hg and/or diastolic blood pressure$90 mm Hg and/or questionnaire positive.
eThe number of packs of cigarettes smoked per day by the number of years the person has smoked.
doi:10.1371/journal.pone.0002533.t001
Table 2.Association of theAGTM235T polymorphism and AMI and CHD under different genetic models.
Mode of Inheritance Crude: model 1 Adjusted: model 2b
Hazard ratio 95% CI P-value Hazard ratio 95% CI P-value
AMI
Additivea 1.20 0.86–1.68 0.28 1.17 0.83–1.64 0.38
Recessive (TT vs. M-carriers) 0.77 0.43–1.41 0.40 0.87 0.46–1.58 0.62
Dominant (T-carriers vs. MM) 0.79 0.47–1.32 0.36 0.79 0.46–1.33 0.37
MT vs. MM 1.09 0.84–1.41 0.53 1.11 0. 85–1.45 0.45
TT vs. MM 1.21 0.86–1.70 0.28 1.17 0.83–1.63 0.38
CHD
Additivea 1.14 0.93–1.39 0.20 1.11 0.90–1.38 0.33
Recessive (TT vs. M-carriers) 0.87 0.60–1.26 0.45 0.98 0.66–1.47 0.93
Dominant (T-carriers vs. MM) 0.82 0.60–1.12 0.21 0.80 0.58–1.10 0.18
MT vs. MM 1.09 0.93–1.27 0.31 1.13 0.95–1.34 0.16
TT vs. MM 1.14 0.93–1.40 0.20 1.11 0.90–1.37 0.33
AMI = acute myocardial infarction (ICD 410); CHD = coronary heart disease (ICD 410–414).
aThe additive genetic model assumes that there is a linear gradient in risk between the MM, MT and TT genotypes (MM genotype baseline). This is equivalent to a
comparison of the T allele versus the M allele (baseline).
bWe used a cox proportional hazards model with an estimation procedure adapted for case-cohort designs; adjusted for waist to hip ratio, hypertension, total
cholesterol.
doi:10.1371/journal.pone.0002533.t002
AGT M235T Variant and CHD
(Table 3) [33,34,36,43,50]. CHD cases were defined in 16 studies as a .50% stenosis of at least one coronary vessel [7,8,10,11,34,40,41,43,46,48,50,51,54–57], while, in four studies, a .70% stenosis was considered [36,42,52,58]. In 14 studies [13,29–32,35,37–39,44,47,49,53], the WHO criteria were used, and, in four studies, CHD was diagnosed based on a clinical diagnosis [6,33,45]. Controls arose from the source population of the cases in 21 studies [6,8,13,29,31–33,35–38,45,47,49–53,55], while hospital-based/not population-based controls were used in 17 studies [7,10,11,30,34,39–44,46,48,54,56–58].
Quantitative data synthesis
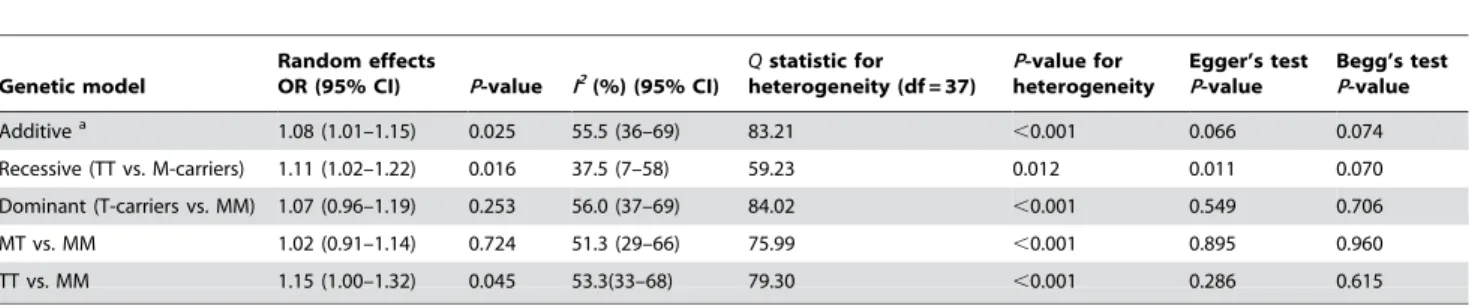
The overall OR under a random-effects model using an additive model for CHD risk was 1.08 (95% CI, 1.01 to 1.15;P= 0.025; Figure 2). However, there was evidence of substantial between-study heterogeneity (I2
= 55.5%, P,0.001). Table 4 shows the association of the AGT T235M polymorphism with CHD risk under different genetic contrasts. When a recessive model was evaluated, a significant association was found between individuals homozygous for the T allele (T235T genotype) and CHD risk, when compared to carriers of the M allele (OR = 1.11; 95% CI, 1.02 to 1.22; P= 0.016). Under the dominant model, the association was not significant. Under pairwise comparisons, there was a significant modest association between the T235T genotype and CHD risk, as compared with the M235M genotype (OR = 1.15; 95% CI, 1.00 to 1.32;P= 0.045). There was evidence for moderate to large between-study heterogeneity under all models (Table 4). Sub-group analysis, by study characteristics under the additive model, showed that matching, blinding of
genotyping staff, and regenotyping of a random sub-sample explained little of the heterogeneity. However, stratification showed an attenuated effect estimates in the large studies, in studies that CHD was defined based on angiography or WHO criteria, and in particular in studies that were in HWE (Table 5). Further evaluation of potential sources of the heterogeneity was performed using a meta-regression analysis.
Meta-regression
First, an empty regression was run with only the log of the effect estimate of pooled studies under the additive model to determine the baseline value fort2
, an estimate of between-study variation (baselinet2
= 0.025). Next, single covariates were added in a series of univariate models. We performed the regression analysis for ten pre-defined potential sources of heterogeneity, including ethnicity, sex, mean age of cases, study size, case definition, source of controls, HWE-violation, blinding in genotyping, performing a sub-sample regenotyping, and matching (we hypothesized that studies that used matching might produce more conservative estimates of association). Univariate regression analyses showed that violation of HWE (b coefficient = 0.27 (0.06 to 0.48); PHet= 0.015, t2= 0.019), the mean age of cases (b=20.01
(20.02 to 0.0008); PHet= 0.066, t
2
= 0.024), and the method of case definition, clinically diagnosed CHD versus WHO criteria adjusted for other definitions (b= 0.26 (0.02 to 0.50);PHet= 0.038, t2= 0.020), were significant sources of heterogeneity among studies. The study size (PHet= 0.241, t
2
= 0.024), the ethnicity (PHet= 0.591, t
2
= 0.025), the male percentage in the study (PHet= 0.701, t
2
= 0.029), blinded genotyping (PHet= 0.890, Figure 1. Flow chart of study selection.
doi:10.1371/journal.pone.0002533.g001
AGT M235T Variant and CHD
Table 3.Characteristics of published studies of the association between the M235T polymorphism inAGTgene and CHD included in the meta-analysis.
Author Year Country Ethnicity
Total cases
Total controls
Study size based on average weight
Cases MM
Cases MT
Cases TT
Controls MM
Controls MT
Controls TT
1 Katsuya et al. [45] 1995 New Zealand Caucasian 422 406 Large 144 186 92 156 191 59
2 Tiret et al. [13] 1995 France and UK Caucasian 630 741 Large 229 301 100 258 372 111
3 Ludwig et al.a[6] (Framingham
study)
1997 USA Caucasian 58 55 Small 17 30 11 20 23 12
4 Ludwig et al.b[6] (ARIC study) 1997 USA Caucasian 255 245 Large 79 117 59 85 118 42
5 Wenzel et al. [55] 1997 Germany Caucasian 111 102 Small 25 59 27 39 46 17
6 Winkelmann et al. [57] 1999 Germany Caucasian 329 92 Small 103 148 78 28 53 11
7 Fernandez-Arcas et al. [37] 1999 Spain Caucasian 272 182 Small 84 132 56 36 96 50
8 Gardemann et al. [40] 1999 Germany Caucasian 1739 511 Large 536 920 283 168 247 96
9 Fatini et al. [36] 2000 Italy Caucasian 205 209 Small 61 91 53 84 86 39
10 Fomicheva et al. [38] 2000 Russia Caucasian 198 152 Small 63 85 50 43 75 34
11 Reinhardt et al. [50] 2000 Germany Caucasian 184 155 Small 56 101 27 38 91 26
12 Batalla et al. [31] 2000 Spain Caucasian 220 200 Small 69 99 52 64 96 40
13 Wierzbicki et al. [56] 2000 UK Caucasian 48 108 Small 23 21 4 58 44 6
14 Rodriguez-Perez et al. [8] 2001 Spain Caucasian 299 315 Large 67 145 87 97 158 60
15 Olivieri et al. [7] 2001 Italy Caucasian 454 245 Large 148 205 101 74 114 57
16 Sethi et al. [29] 2001 Denmark Caucasian 943 7975 Large 335 460 148 2779 3886 1310
17 Ortlepp et al. [48] 2002 Germany Caucasian 100 100 Small 25 58 17 29 55 16
18 Ermis et al. [35] 2002 Turkey Caucasian 102 114 Small 32 48 22 39 59 16
19 Bis et al. [32] 2003 USA Caucasian 208 717 Large 71 98 39 215 349 153
20 Buraczynska et al. [33] 2003 Poland Caucasian 200 200 Small 28 122 50 72 80 48
21 Tobin et al. [53] 2004 UK Caucasian 547 505 Large 212 252 83 197 226 82
22 Sekuri et al. [10] 2005 Turkey Caucasian 115 128 Small 46 42 27 33 71 24
23 Methot et al. [47] 2005 Canada Caucasian 198 149 Small 65 93 40 60 70 19
24 Renner et al. [51] 2005 Austria Caucasian 2582 732 Large 841 1205 536 237 357 138
25 Zafarmand et al. (present study) 2008 Netherlands Caucasian 210 1522 Large 64 108 38 535 737 250
26 Kamitani et al. [44] 1995 Japan East Asian 103 103 Small 6 31 66 10 41 52
27 Ishigami et al. [43] 1995 Japan East Asian 82 160 Small 6 22 54 30 51 79
28 Yamakawa-Kobayashi et al. [58] 1995 Japan East Asian 315 380 Small 15 91 209 9 131 240
29 Ko et al. [46] 1997 China East Asian 267 337 Small 6 36 225 4 54 279
30 Ichihara et al. [42] 1997 Japan East Asian 327 352 Small 15 103 209 13 112 227
31 Cong et al. [34] 1998 Japan East Asian 104 170 Small 2 31 71 16 43 111
32 Sheu et al. [52] 1998 China East Asian 102 145 Small 1 26 75 1 37 107
33 Tsai et al. [54] 2006 Taiwan East Asian 735 519 Large 15 195 525 5 111 403
AGT
M235T
Variant
and
CHD
PLoS
ONE
|
www.plos
one.org
6
June
2008
|
Volume
3
|
Issue
6
|
Author Year Country Ethnicity
Total cases
Total controls
Study size based on average weight
Cases MM
Cases MT
Cases TT
Controls MM
Controls MT
Controls TT
34 Frossard et al. [39] 1998 UAE Arab 74 61 Small 21 32 21 16 26 19
35 Hooper et al. [41] 2002 USA African- American 100 100 Small 4 29 67 2 31 67
36 Nair et al. [11] 2003 India South Asian 141 131 Small 9 36 96 11 40 80
37 Araujo et al. [30] 2004 Brazil South American 110 104 Small 46 52 12 43 51 10
38 Ranjith et al. [49] 2004 South Africa African 195 300 Small 24 80 91 29 127 144
Author
Study design
Mean age6SD (years) in Cases
Mean age6SD
(years) in Controls Sex Male percent
Matching variable (s)
Allele frequency
235T (%) P (HWE)
Blinding of genotyping staff
Regenotyping of random subsample
Katsuya et al. [45] Case-control 6267 6267 M/F NR None 38 0.97 NR NR
Tiret et al. [13] Case-control 5460.3 5360.3 M 100 Age 40 0.22 NR NR
Ludwig et al.a[6] (Framingham
study)
Case-control NR NR M/F 86 Age and sex 43 0.28 NR NR
Ludwig et al.b[6] (ARIC study) Case-control NR NR M/F 80.5 Age and sex 41 0.92 NR NR
Wenzel et al. [55] Case-control 42* 38* M/F 88 None 39 0.59 NR NR
Winkelmann et al. [57] Case-control 56610 56610 M 100 None 41 0.06 NR NR
Fernandez-Arcas et al. [37] Case-control 6767 60610 M/F 42 None 54 0.41 NR Yes
Gardemann et al. [40] Cross-sectional 6369 59611 M 100 None 43 0.76 NR NR
Fatini et al. [36] Case-control 5965 5166 M/F 76 None 39 0.0476 NR NR
Fomicheva et al. [38] Case-control 67 11 M 100 None 47 0.90 NR NR
Reinhardt et al. [50] Case-control 57611 56614 M/F 62 None 46 0.0240 Yes Yes
Batalla et al. [31] Case-control 4365 4266 M 100 Age and ethnicity 44 0.71 NR NR
Wierzbicki et al. [56] Cohort 57613 53612 M/F 68 None 26 0.53 Yes Yes
Rodriguez-Perez et al. [8] Case-control 56610 54610 M/F 76 None 44 0.76 Yes NR
Olivieri et al. [7] Case-control 6069 58613 M/F 83.5 None 47 0.31 NR NR
Sethi et al. [29] Case-control 5969 56615 M/F 74 None 41 0.43 NR NR
Ortlepp et al. [48] Case-control 58613 59611 M/F 68 Age, sex, and prevalence of standard cardiac risk factors
43 0.23 NR NR
Ermis et al. [35] Case-control 42612 40613 NR NR None 40 0.40 NR NR
Bis et al. [32] Case-control 70 64 M/F 61.5 Age, sex and calendar year of identification
46 0.61 Yes NR
Buraczynska et al. [33] Case-control 5367 47611 M 100 None 44 0.0077 NR NR
Tobin et al. [53] Case-control 6269 57611 M/F 68 None 39 0.21 NR Yes
Sekuri et al. [10] Case-control 4868 4467 M/F 77.4 None 47 0.19 NR NR
Methot et al. [47] Case-control 63610 6267 F 0 Age 37 0.84 NR NR
Renner et al. [51] Case-control 64610 58612 M/F 74.8 None 43 0.86 Yes NR
Zafarmand et al. (present study) Case-cohort 6166 5766 F 0 None 41 0.89 Yes Yes
Table 3.Cont.
AGT
M235T
Variant
and
CHD
PLoS
ONE
|
www.plos
one.org
7
June
2008
|
Volume
3
|
Issue
6
|
Author
Study design
Mean age6SD (years) in Cases
Mean age6SD
(years) in Controls Sex Male percent
Matching variable (s)
Allele frequency
235T (%) P (HWE)
Blinding of genotyping staff
Regenotyping of random subsample
Kamitani et al. [44] Case-control 5261 5461 M 100 Age, sex, BMI, blood pressure, total cholesterol, smoking and history of diabetes
70 0.65 NR NR
Ishigami et al. [43] Case-control 6261 6061 M/F 68.3 None 65 0.0002 NR NR
Yamakawa-Kobayashi et al. [58] Case-control 5768 5168 M/F 80 None 80 0.07 NR NR
Ko et al. [46] Case-control 6261 5661 M/F 77 None 91 0.51* NR NR
Ichihara et al. [42] Case-control 5366 5365 M 100 Age, sex, BMI and some CHD risk factors (history of smoking, hypertension, diabetes, hypercholesterolemia)
80 0.86 NR NR
Cong et al. [34] Case-control 6561 NR M/F 76 None 78 0.0006 NR NR
Sheu et al. [52] Case-control 6361 5861 M 100 None 87 0.47* NR NR
Tsai et al. [54] Case-control 64611 59613 M/F 72.2 None 88 0.38 NR NR
Frossard et al. [39] Case-control 57612 54614 M/F 48.2 None 52 0.26 NR NR
Hooper et al. [41] Case-control NR NR M/F NR None 83 0.73* NR NR
Nair et al. [11] Case-control 5665 4866 M/F 82.3 Age and sex 76 0.08 NR NR
Araujo et al. [30] Case-control NR NR M/F 66.6 None 34 0.36 NR NR
Ranjith et al. [49] Case-control NR NR M/F NR Age 69 0.90 NR NR
Author End point Case definition Source of controls
Katsuya et al. [45] CHD Admission for treatment of myocardial infarction or unstable angina, PTCA, or CABG, or stable angina with angiographic evidence of CHD or a positive exercise test result
Controls without a history of CHD and symptoms suggesting angina from two previous studies
Tiret et al. [13] MI WHO MONICA category I Electoral rolls in France and the list of general practitioners in N. Ireland
Ludwig et al.a[6] (Framingham study) CHD Diagnosed MI by a physician, a PTCA, a CABG, prior MI in ECG, fatal CHD Healthy controls without the conditions, no lipid-lowering medications and no family
history
Ludwig et al.b[6] (ARIC study) CHD Diagnosed MI by a physician, a percutaneous coronary angioplasty, a
coronary artery bypass, prior MI, fatal CHD
Healthy controls without the conditions, no lipid-lowering medications and no family history
Wenzel et al. [55] CHD .50% stenosis of at least one major coronary vessel, defined as MI, PTCA, CABG
Healthy young persons without any symptoms for CVD
Winkelmann et al. [57] CHD, MI At least one coronary stenosis$50% controls without coronary artery disease in coronary angiography
Fernandez-Arcas et al. [37] MI Typical prolonged chest pain or atypical symptoms, acute congestive heart failure, syncope, and serial cardiac enzymes elevation exceeding twice the upper limit of reference range and dynamic ECG changes typical of MI
Healthy controls with no CVD using health service identity card
Gardemann et al. [40] CHD, MI CHD: coronary stenosis$50% MI: Using the WHO criteria No vessel disease in the coronary angiography
Fatini et al. [36] CHD History of CHD (previous MI or angina pectoris) with coronary stenosis.75% by angiography
Random healthy controls from the staff of the University Table 3.Cont.
AGT
M235T
Variant
and
CHD
PLoS
ONE
|
www.plos
one.org
8
June
2008
|
Volume
3
|
Issue
6
|
Author End point Case definition Source of controls
Fomicheva et al. [38] MI Using the WHO criteria From secondary schools
Reinhardt et al. [50] CHD At least one coronary stenosis$50% of a major coronary artery with or without prior MI
Random healthy controls from the local registry office
Batalla et al. [31] MI WHO MONICA protocol Healthy controls from residents of the region
Wierzbicki et al. [56] CHD Confirmed cardiac event, angioplasty, coronary bypass surgery, or significant lesions on angiography
No CHD
Rodriguez-Perez et al. [8] CHD Hospital-admitted with a diagnosis of MI or unstable angina and documented evidence of coronary artery disease by angiography
Random controls without CVD
Olivieri et al. [7] CHD, MI CHD: Candidate patients for CABG, having.50% stenosis of at least one major coronary vessel MI: By medical records showing diagnostic electrocardiogram and enzyme changes, and/or the typical sequelae of myocardial infarction on ventricular angiography
CHD-free group documented by angiography who were examined for other reasons in the institute
Sethi et al. [29] CHD, MI CHD: ICD, 8th edition, codes 410-414 MI: ICD, 8th edition, code 410 Random healthy controls without CHD, MI or CVA from the city of Copenhagen
Ortlepp et al. [48] CHD .50% stenosis of at least one coronary vessel Patients without any signs of atherosclerosis in angiography
Ermis et al. [35] Early MI WHO criteria Healthy subjects without a history of CHD, hypertension or diabetes
Bis et al. [32] MI Criteria were adapted from the Cardiovascular Health Study Randomly selected subjects from the members of a health maintenance organization
Buraczynska et al. [33] CHD Hospitalized patients with unstable angina, stable angina or acute MI Healthy subjects without family history of CHD
Tobin et al. [53] MI Using the WHO criteria Healthy visitors to patients
Sekuri et al. [10] CHD At least one stenosis$50% in a major coronary artery or one of their branches
Healthy subjects without history of CVD
Methot et al. [47] CHD Acute coronary syndrome: AMI or unstable angina defined according to standard criteria
Postmenopausal women without signs or symptoms of acute or previous acute coronary syndrome
Renner et al. [51] CHD, MI CHD: At least one stenosis$50% in one of 15 coronary segments MI: positive history of MI or patients presented with ST elevation or non-ST elevation
Subjects without CHD (with stenoses,20%) from a cohort study
Zafarmand et al. (present study) CHD, MI CHD: ICD, 9th edition, codes 410-414 MI: ICD, 9th edition, code 410 Members of a 10% random sample from the whole cohort at the baseline without CVD
Kamitani et al. [44] MI Having MI by coronary angiography, ECG criteria, and measurements of heart-specific serum enzymes
Randomly selected subjects attending the same hospital with no CVD
Ishigami et al. [43] CHD At least one coronary artery with.25% luminal obstruction on average according to multiple coronary angiographic views
Hospital-admitted patients for other diseases with no CHD
Yamakawa-Kobayashi et al. [58] CHD At least one 75% stenosis in coronary arteries Healthy controls
Ko et al. [46] CHD .50% stenosis of at least one major coronary vessel Healthy subjects and patients without angiographic evidence of CHD
Ichihara et al. [42] CHD MI was based on typical ECG changes and increased serum enzymes and by the presence of wall motion abnormality on left ventriculography, Angina pectoris by typical ECG changes and stenosis of.70% in any major coronary artery or of.50% in the left main trunk, without wall motion abnormality on left ventriculography
Random healthy controls with no history or sign of CHD from attendants of the hospitals
Cong et al. [34] CHD $50% stenosis in at least one major coronary artery Subjects with no history of CHD or abnormal resting electrocardiogram
Sheu et al. [52] CHD A postnitroglycerin stenosis of major vessels$50% or a.70% reduction of luminal diameter of a first-order branche
Healthy subjects in their annual physical checkups Table 3.Cont.
AGT
M235T
Variant
and
CHD
PLoS
ONE
|
www.plos
one.org
9
June
2008
|
Volume
3
|
Issue
6
|
t2= 0.026), sub-sample regenotyping (PHet= 0.131,t2= 0.023), the
source of controls (PHet= 0.640, t2= 0.025), and matching
(PHet= 0.942,t2= 0.026) were not significant sources of
heteroge-neity among studies. Violation of HWE in multivariable regression analysis remained a statistically significant source of heterogeneity after adjustment for the effect of study size (PHet= 0.031, t2
= 0.020). Adding the mean age of cases and method of case definition to the model with violation of HWE decreased thet2
value to 0.017 (PHet= 0.073 for violation of HWE,PHet= 0.057 for
the mean age of cases, andPHet= 0.162 for clinically diagnosed
CHD). It also showed that the effect of method of case definition on the variation among the studies was through the effect of the mean age on the heterogeneity and not as an independent factor. A model that included only violation of HWE and the mean age of cases reduced the t2
value to 0.018 (PHet= 0.019, and 0.052,
respectively).
Sensitivity Analysis
First, the influence of deviation from the HWE on effect estimates was examined by using HWE-deviated adjusted ORs. Table 6 presents the genotype-based contrasts with corrected ORs, as well as the allele-based contrast. After adjustment, a smaller overall effect was seen under the additive, dominant, and pairwise comparisons. Moreover, after adjustment, the previously significant association under the additive model, as well as the TT vs. MM comparison, was no longer statistically significant. The association under the recessive model still remained significant.
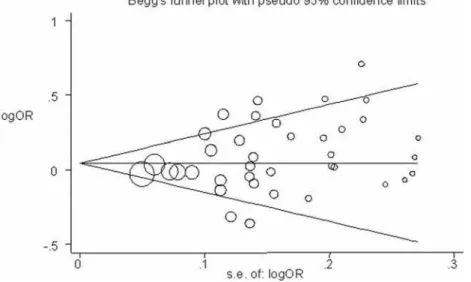
Figure 3 shows a funnel plot in which the log of the OR of CHD risk under the additive genetic model was plotted against the standard error of the log of the OR in each study. The funnel plot for the overall results was substantially asymmetric for small negative studies. Moreover, tests for potential publication bias (The Egger’s test and the Begg-Mazumdar test;P-values equal to 0.066 and 0.074, respectively) suggested the presence of a publication bias. By using the trim and fill method, we showed that, if the publication bias was the only source of the funnel plot asymmetry, it needed seven more studies to be symmetrical (Figure 4).
Discussion
Prospect-EPIC study
In this prospective study of healthy women aged 49 to 70 years, we investigated the relationship between the M235T polymor-phism in theAGT gene and risk of AMI and CHD later in life. Under the additive genetic model, increased risks, albeit not statistically significant, were found for the incidence of AMI and CHD, which did not alter after adjustment. Likewise, we did not find a clear association between the variant and risk of CHD or AMI using different genetic models. This may be explained by: (i) the absence of a biological effect, (ii) the presence of real genetic heterogeneity according to ethnic background, or (iii) failure to detect a small effect because the epidemiologic risk for an individual genetic variant is likely to be small and a large sample size is needed for adequate statistical power. It has been commonly proposed that, as well as a need for much larger and more rigorous studies those that are currently used, there is a greater need for international collaborations, particularly for a complex disease like CHD [59].
Strengths and limitations. In our study, the data collection was prospective, before the diagnosis of AMI or CHD and equal for all participants. This ensures that the cases and the randomly selected controls are comparable [17]. For a multifactorial trait, like CHD, this provides a valid approach to evaluate the
Author End point Case definition Source of controls Tsai et al. [54] CHD . 50% stenosis of at least one coronary vessel CHD-free g roup documented by angiography Frossard et al. [39] CHD, MI CHD: Exertional angina, unstable angina or MI MI: ECG changes; presence of regional w all motion abnormalities on trans-thoracic echocardiography; and serial enzyme elevations Healthy controls Hooper et al. [41] MI Prior M I confirmed by ECG and/or cardiac enzymes or cardiac thallium scanning or catheterization Outpatients w ith no history of heart attack, stroke, o r thrombosis Nair et al. [11] CHD At least one coronary artery with 50% stenosis Healthy controls with BP , 140/90 m m H g and no history of CVD Araujo et al. [30] MI Using the WHO criteria confirmed by stenosis . 50% in an angiography and ventricular damage in a ventriculography Hospital-admitted patients for other diseases with a normal coronary angiography Ranjith et al. [49] MI Using the WHO criteria Healthy n ormotensive subjects with no CVD or other associated risk factors PTCA, percutaneous coronary angioplasty; CABG, coronary artery bypass graft; ICD, international classification o f d iseases; ECG, electrocardio graphy ; AMI, acute myocardial infarction; CHD, coronary heart d isease; CVD, cardiovascular diseases; CVA, cerebrovascular accident; BMI, b ody m ass index; WHO, world health organization; NR, not reported. *Exact significance probability. doi:10.1371/journal.pone. 0002533.t003 Table 3. Cont.
AGT M235T Variant and CHD
relationship between genetic factors and the risk of AMI and CHD, while taking into account co-existing and risk-modifying factors. In this study, prevalent cases of CHD were excluded from the analyses to prevent introducing bias due to potentially selective
survival. The Prospect study was a population-based cohort, which makes it less susceptible to selection bias. Additional strengths were the comprehensiveness of our data and sample collection, as well as the morbidity and mortality follow-up for the entire cohort
Figure 2. Results of published studies of association between the M235T polymorphism inAGTgene and coronary heart disease in different ethnic groups.ORs for the outcome compared the T235 allele vs. the M235 allele (Additive model). The size of the box is proportional to the weight of the study. GivenP-values for odds ratios are based on DerSimonian-Laird method using a random effects model and for heterogeneity in different ethnic groups are based on Q-test.
doi:10.1371/journal.pone.0002533.g002
AGT M235T Variant and CHD
through linkage with nation-wide registries. The case-cohort design of the study combined the advantages of cohort studies (multiple outcomes and time-dependent covariates) with those of case-control analyses (fewer subjects); thus, it was more efficient than cohort studies. Classical case-control studies might be affected
by selection bias since only non-fatal cases can be included, which was not the case in this study because of our endpoint definition. Moreover, we did not have misclassification of exposure (genotypes), which, when present, generally lead to a bias toward the null because we used standard laboratory protocols, Table 4.ORs and 95% CI for coronary heart disease and the M235T polymorphism inAGTgene under different genetic models.
Genetic model
Random effects
OR (95% CI) P-value I2
(%) (95% CI)
Qstatistic for heterogeneity (df = 37)
P-value for heterogeneity
Egger’s test P-value
Begg’s test P-value Additivea 1.08 (1.01–1.15) 0.025 55.5 (36–69) 83.21
,0.001 0.066 0.074
Recessive (TT vs. M-carriers) 1.11 (1.02–1.22) 0.016 37.5 (7–58) 59.23 0.012 0.011 0.070
Dominant (T-carriers vs. MM) 1.07 (0.96–1.19) 0.253 56.0 (37–69) 84.02 ,0.001 0.549 0.706
MT vs. MM 1.02 (0.91–1.14) 0.724 51.3 (29–66) 75.99 ,0.001 0.895 0.960
TT vs. MM 1.15 (1.00–1.32) 0.045 53.3(33–68) 79.30 ,0.001 0.286 0.615
aThe additive genetic model assumes that there is a linear gradient in risk between the MM, MT and TT genotypes (MM genotype baseline). This is equivalent to a
comparison of the T allele versus the M allele (baseline). doi:10.1371/journal.pone.0002533.t004
Table 5.Studies of the M235T polymorphism inAGTgene and risk of coronary heart disease under additive model grouped by study characteristics.
Study characteristics
Number of studies
Per-allele OR
(95%CI) P-value I2
(%) (95%CI)
Qstatistic for heterogeneity
P-value for heterogeneity
Overall 38 1.08 (1.01–1.15) 0.025 55.5 (36–69) 83.21 ,0.001
Study size
Small 26 1.12 (1.02–1.24) 0.021 50.2 (35–73) 50.24 0.002
Large 12 1.03 (0.95–1.12) 0.502 62.0 (29–80) 28.92 0.002
Ethnicity
Caucasians 25 1.08 (1.01–1.17) 0.028 58.2 (35–73) 57.43 ,0.001
Eastern Asians 8 1.12 (0.89–1.40) 0.325 69.5 (36–85) 22.96 0.002
Others 5 0.99 (0.84–1.18) 0.944 0.00 (0–79) 2.31 0.679
Matching
Matched 11 1.07 (0.96–1.18) 0.211 26.2 (0–63) 13.56 0.194
Unmatched 27 1.08 (0.99–1.17) 0.072 62.7 (44–75) 69.65 ,0.001
Violating HWE
Violated 5 1.38 (1.05,–1.83) 0.022 70.7 (26–88) 13.65 0.009
Confirmed 33 1.04 (0.98–1.11) 0.188 43.5 (5–63) 56.66 0.005
Blinding of genotyping staff
Blinded 6 1.07 (0.92–1.24) 0.391 62.6 (9–85) 13.36 0.020
Not reported 32 1.08 (1.00–1.16) 0.040 55.5 (34–70) 69.88 ,0.001
Regenotyping of a random subsample
Performed 5 0.94 (0.79–1.14) 0.544 58.9 (0–85) 9.74 0.045
Not reported 33 1.10 (1.03–1.18) 0.007 54.7 (33–69) 70.64 ,0.001
Case definition
.50%stenosis of$1 major vessels 16 1.09 (0.97–1.23) 0.135 62.4 (35–78) 39.9 ,0.001
.70%stenosis of$1 major vessels 4 1.10 (0.90–1.34) 0.358 40.7 (0–80) 5.1 0.167
WHO criteria 14 1.00 (0.93–1.09) 0.942 36.9 (0–67) 20.6 0.081
Clinical diagnosis 4 1.31 (1.15–1.49) ,0.001 0.00 (0–85) 2.7 0.439
Source of controls
Population-based 21 1.09 (1.01–1.19) 0.036 62.6 (40–77) 53.5 ,0.001
Hospital-based 17 1.05 (0.95–1.17) 0.354 44.6 (2–69) 28.9 0.025
doi:10.1371/journal.pone.0002533.t005
AGT M235T Variant and CHD
performed a random double-check to detect potential genotyping errors, and had our AGT genotypes in Hardy-Weinberg equilibrium. The limitations of this study were the relatively short period of follow-up and the small number of cases. Moreover, because this cohort was exclusively composed of Dutch women, these results cannot be generalized to men or other ethnic groups, for whom the rates of the events or the allele frequency are known to differ.
Meta-Analysis
The current meta-analysis, which includes new data from a prospective study in a large population-based cohort of Dutch women, represents a comprehensive evaluation of the M235T
variant of theAGTgene in CHD risk. Although a pooled per-allele OR was suggestive of a modest increase in the risk of CHD of 1.08 (95% CI, 1.01 to 1.15), the robustness of this summary estimate is uncertain. First, in the pre-specified sub-groups analyses in the meta-analysis, larger studies, those with validated genotyping quality controls, and studies that used standardized criteria for case definition did not provide strong evidence for a positive statistically significant association between the M235T variant of theAGTgene and CHD risk. Second, the meta-regression analysis revealed that the HWE violation was a significant source of the moderate to large heterogeneity in the meta-analysis. Taking violation of HWE into account in the meta-analysis decreased the overall effect (Table 5). Third, the previous result was confirmed by using HWE-deviation adjusted ORs in the meta-analysis
Figure 3. Begg’s funnel plot with pseudo 95% confidence limits under the additive genetic model.The size of the circle is proportional to the weight of the study.
doi:10.1371/journal.pone.0002533.g003
Table 6.ORs and 95% CI after adjustment for HWE-deviation under different genetic models.
Genotype
contrasts Population
Number of
studies Random effects model I2
(%) (95%CI)
Qstatistic for heterogeneity
P-value for heterogeneity Odds ratio 95%CI P-value
Additive All 38 1.11 0.81–1.53 0.522 0 (0–37) 2.04 1.000
Caucasians 25 1.11 0.75–1.64 0.616 0 (0–44) 1.04 1.000
East Asians 8 1.19 0.60–2.36 0.626 0 (0–68) 0.82 0.997
Recessive All 38 1.14 1.04–1.26 0.007 56 (37–70) 84.66 ,0.001
Caucasians 25 1.15 1.03–1.29 0.014 56 (32–72) 55.02 ,0.001
East Asians 8 1.18 0.90–1.55 0.242 73 (45–87) 26.15 ,0.001
Dominant All 38 1.05 0.96–1.15 0.330 49 (26–65) 72.52 ,0.001
Caucasians 25 1.08 0.98–1.20 0.121 58 (35–73) 57.82 ,0.001
East Asians 8 0.92 0.64–1.33 0.656 33 (0–70) 10.41 0.166
MT vs MM All 38 1.00 0.92–1.09 0.996 15 (0–43) 43.41 0.217
Caucasians 25 1.03 0.94–1.14 0.497 25 (0–54) 31.99 0.127
East Asians 8 0.82 0.60–1.11 0.204 0 (0–68) 6.53 0.480
TT vs MM All 38 1.13 0.99–1.28 0.080 52 (31–67) 77.88 ,0.001
Caucasians 25 1.19 1.02–1.38 0.023 60 (38–74) 60.11 ,0.001
East Asians 8 1.01 0.65–1.59 0.952 50 (0–77) 13.87 0.054
doi:10.1371/journal.pone.0002533.t006
AGT M235T Variant and CHD
(Table 6). Moreover, there was evidence for publication bias in the meta-analysis. Taken together, these findings point to a violation of HWE and publication biases as the potential explanations for the results observed in the meta-analysis.
Some aspects of the current meta-analysis need to be considered to appreciate the findings. First, it might not be very practical to adjust for violation of HWE in the studies that mentioned that the violation is not due to genotyping errors. However, in the current meta-analysis, the HWE-violated studies that were included in the pooled estimate did not provide any reason for the violation. Therefore, we performed sensitivity analyses by using HWE-adjusted ORs and corresponding variances. Thereafter, a smaller overall effect was seen under most of the genetic models. Second, the power of tests for HWE and the power to detect genotyping errors are low. Therefore, the inability to detect a deviation from the HWE does not mean that there is no deviation, nor does it rule out the presence of genotyping errors, especially for small sample sizes. Third, our meta-analysis was based on published studies and we did not have access to the original data. However, it could be possible that an association between the genotype and disease exists in certain contexts rather than in all people studied. For example, a case-control study showed that the TT genotype was associated with an increased risk of CHD and MI only in smokers [33]. Finally, in all meta-analyses of gene-disease association studies, the inclusion criteria of cases and controls can be a potentially confounding factor. In this meta-analysis, cases were well defined and the source of controls was not a significant source of variation. However, the advantages of this study were the large sample size of the meta-analysis of 38 studies with 13284 cases and 18722 controls, which was twice the number of studies and sample sizes that had been reported in the previous meta-analysis [14], the exploration of potential sources of heterogeneity in the meta-analysis, and the evaluation of the association under different modes of inheritance.
Approximately 10% of gene-disease association studies are affected by statistically significant deviation from HWE, which could result from genotyping error, chance, inbreeding, non-random mating, differential survival of marker carriers, genetic drift, population stratification, or a combination of these reasons [20,60]. Of these, genotyping error could be avoided by using
standard genotyping methods and performing quality assessment. It has been recommended that authors specify the quality measures for the genotyping analysis, such as the blinding of laboratory staff to the donor subjects and hypotheses being investigated, procedures for establishing duplicates, degree of reproducibility between quality control replicates, and the inspection for conformity to HWE [61]. In the current meta-analysis, in studies where the blinding of genotyping staff was not reported, a statistically significant increased risk of CHD was found, while those that used blinding methods did not find a significant association. Moreover, for studies without regenotyping of a random sub-sample, a significant increase in CHD risk was found, but not for studies that performed regenotyping. Although overlapping confidence intervals for before-mentioned risks indicate caution in any interpretations, no report on blinding and regenotyping can point towards an uncertainty in quality control of genotyping in these studies. However, violation of HWE, which tends to inflate the chance of a false positive association, may be the strongest indicator of genotyping error [62].
Violation of HWE cannot solely explain the observed between-study variation in gene-disease association studies. The large between-study heterogeneity presented in most meta-analyses could be due to true heterogeneity (i.e., racial differences or differences in gene-environment interactions among various populations) or bias [63]. Bias, which could invalidate the results of the studies, should, therefore, be explored in detail. Biological plausibility, publication bias, selection bias, biased definition of cases, biased selection of controls, and population stratification should be assessed [63]. In this meta-analysis, we found strong evidence for publication bias. This is said to occur when the chance of the publication of a smaller study increases when it shows a stronger effect. Further exploration for sources of biases among studies showed that the selection of controls was not biased. However, using different case definitions resulted in a significant difference in the risk of CHD between those studies using WHO criteria and those using clinically diagnoses of CHD. Studies using definition of cases based on coronary angiography or based on WHO criteria had the same results. Considering a multivariate model in the meta-regression results, case definition was not a significant source of bias in the meta-analysis, while the different
Figure 4. Filled Begg’s funnel plot with pseudo 95% confidence limits under the additive genetic model.Red squares are missed studies due to publication bias.
doi:10.1371/journal.pone.0002533.g004
AGT M235T Variant and CHD
mean age of cases and violation of HWE were significant sources of heterogeneity. Since increasing age is a risk factor for CHD and the mean age of cases in the included studies ranged from 42 to 67 years, it is more likely that the studies with older individuals would show a stronger effect and produce heterogeneity. As case-parental controls, or other family-based designs, and genomic controls, using unlinked genetic markers which have no effect on the risk of CHD, were not available to evaluate the potential problem of population stratification among the studies, we presented effect estimates by different ethnic groups. However, there is controversy about the potential importance of population stratification for genetic-association studies using unrelated subjects [64].
In conclusion, the present meta-analysis, including our own data, indicated that, although a weak association between the M235T variant in the AGT gene and CHD was found, the relevance of this weakly positive overall association remains
uncertain because it may be due to various residual biases. Moderate to large heterogeneity was identified between studies, and violation of HWE and the mean age of cases were statistically significant sources of the observed variation.
Acknowledgments
We are grateful to the participants of the Prospect-EPIC study. We would like to thank all field workers and laboratory technicians for their skillful contributions to the data collection.
Author Contributions
Conceived and designed the experiments: MZ MB Yv DG. Performed the experiments: Pd Yv. Analyzed the data: MZ MB. Contributed reagents/ materials/analysis tools: MZ MB. Wrote the paper: MZ MB Pd Yv DG.
References
1. Jeunemaitre X, Soubrier F, Kotelevtsev YV, Lifton RP, Williams CS, et al. (1992) Molecular basis of human hypertension: role of angiotensinogen. Cell 71: 169–180.
2. Caulfield M, Lavender P, Newell-Price J, Farrall M, Kamdar S, et al. (1995) Linkage of the angiotensinogen gene locus to human essential hypertension in African Caribbeans. J Clin Invest 96: 687–692.
3. Paillard F, Chansel D, Brand E, Benetos A, Thomas F, et al. (1999) Genotype-phenotype relationships for the renin-angiotensin-aldosterone system in a normal population. Hypertension 34: 423–429.
4. Staessen JA, Kuznetsova T, Wang JG, Emelianov D, Vlietinck R, et al. (1999) M235T angiotensinogen gene polymorphism and cardiovascular renal risk. J Hypertens 17: 9–17.
5. Sattar N, Greer IA (2002) Pregnancy complications and maternal cardiovascular risk: opportunities for intervention and screening? BMJ 325: 157–160. 6. Ludwig EH, Borecki IB, Ellison RC, Folsom AR, Heiss G, et al. (1997)
Associations between candidate loci angiotensin-converting enzyme and angiotensinogen with coronary heart disease and myocardial infarction: the NHLBI Family Heart Study. Ann Epidemiol 7: 3–12.
7. Olivieri O, Stranieri C, Girelli D, Pizzolo F, Grazioli S, et al. (2001) Homozygosity for angiotensinogen 235T variant increases the risk of myocardial infarction in patients with multi-vessel coronary artery disease. J Hypertens 19: 879–884.
8. Rodriguez-Perez JC, Rodriguez-Esparragon F, Hernandez-Perera O, Anabitarte A, Losada A, et al. (2001) Association of angiotensinogen M235T and A(-6)G gene polymorphisms with coronary heart disease with independence of essential hypertension: the PROCAGENE study. Prospective Cardiac Gene. J Am Coll Cardiol 37: 1536–1542.
9. Lanz JR, Pereira AC, Lemos PA, Martinez E, Krieger JE (2005) Angiotensin-ogen M235T polymorphism is associated with coronary artery disease severity. Clin Chim Acta 362: 176–181.
10. Sekuri C, Cam FS, Ercan E, Tengiz I, Sagcan A, et al. (2005) Renin-angiotensin system gene polymorphisms and premature coronary heart disease. J Renin Angiotensin Aldosterone Syst 6: 38–42.
11. Nair KG, Shalia KK, Ashavaid TF, Dalal JJ (2003) Coronary heart disease, hypertension, and angiotensinogen gene variants in Indian population. J Clin Lab Anal 17: 141–146.
12. Sethi AA, Nordestgaard BG, Gronholdt ML, Steffensen R, Jensen G, et al. (2003) Angiotensinogen single nucleotide polymorphisms, elevated blood pressure, and risk of cardiovascular disease. Hypertension 41: 1202–1211. 13. Tiret L, Blanc H, Ruidavets JB, Arveiler D, Luc G, et al. (1998) Gene
polymorphisms of the renin-angiotensin system in relation to hypertension and parental history of myocardial infarction and stroke: the PEGASE study. Projet d’Etude des Genes de l’Hypertension Arterielle Severe a moderee Essentielle. J Hypertens 16: 37–44.
14. Sethi AA, Nordestgaard BG, Tybjaerg-Hansen A (2003) Angiotensinogen gene polymorphism, plasma angiotensinogen, and risk of hypertension and ischemic heart disease: a meta-analysis. Arterioscler Thromb Vasc Biol 23: 1269–1275. 15. Boker LK, van Noord PA, van der Schouw YT, Koot NV, Bueno de
Mesquita HB, et al. (2001) Prospect-EPIC Utrecht: study design and characteristics of the cohort population. European Prospective Investigation into Cancer and Nutrition. Eur J Epidemiol 17: 1047–1053.
16. Zafarmand MH, van der Schouw YT, Grobbee DE, de Leeuw PW, Bots ML (2008) T64A polymorphism in beta3-adrenergic receptor gene (ADRB3) and coronary heart disease: a case-cohort study and meta-analysis. J Intern Med 263: 79–89.
17. Prentice RL (1986) A case-cohort design for epidemiologic cohort studies and disease prevention trials. Biometrika 73: 1–11.
18. Cheng S, Grow MA, Pallaud C, Klitz W, Erlich HA, et al. (1999) A multilocus genotyping assay for candidate markers of cardiovascular disease risk. Genome Res 9: 936–949.
19. Onland-Moret NC, van der AD, van der Schouw YT, Buschers W, Elias SG, et al. (2007) Analysis of case-cohort data: a comparison of different methods. J Clin Epidemiol 60: 350–355.
20. Trikalinos TA, Salanti G, Khoury MJ, Ioannidis JP (2006) Impact of violations and deviations in Hardy-Weinberg equilibrium on postulated gene-disease associations. Am J Epidemiol 163: 300–309.
21. Higgins JP, Thompson SG, Deeks JJ, Altman DG (2003) Measuring inconsistency in meta-analyses. BMJ 327: 557–560.
22. Agerholm-Larsen B, Nordestgaard BG, Tybjaerg-Hansen A (2000) ACE gene polymorphism in cardiovascular disease: meta-analyses of small and large studies in whites. Arterioscler Thromb Vasc Biol 20: 484–492.
23. Berdeli A, Sekuri C, Sirri CF, Ercan E, Sagcan A, et al. (2005) Association between the eNOS (Glu298Asp) and the RAS genes polymorphisms and premature coronary artery disease in a Turkish population. Clin Chim Acta 351: 87–94.
24. Fernandez-Arcas N, eguez-Lucena JL, Munoz-Moran E, Ruiz-Galdon M, Espinosa-Caliani S, et al. (2001) Both alleles of the M235T polymorphism of the angiotensinogen gene can be a risk factor for myocardial infarction. Clin Genet 60: 52–57.
25. Zee RY, Cook NR, Cheng S, Erlich HA, Lindpaintner K, et al. (2006) Multi-locus candidate gene polymorphisms and risk of myocardial infarction: a population-based, prospective genetic analysis. J Thromb Haemost 4: 341–348. 26. Petrovic D, Zorc M, Kanic V, Peterlin B (2001) Interaction between gene polymorphisms of renin-angiotensin system and metabolic risk factors in premature myocardial infarction. Angiology 52: 247–252.
27. Krizanova O, Obdrzalkova D, Polakova H, Jelok I, Hudecova S (1997) Molecular variants of the renin-angiotensin system components in the Slovak population. Physiol Res 46: 357–361.
28. Goldenberg I, Moss AJ, Ryan D, McNitt S, Eberly SW, et al. (2006) Polymorphism in the angiotensinogen gene, hypertension, and ethnic differences in the risk of recurrent coronary events. Hypertension 48: 693–699. 29. Sethi AA, Tybjaerg-Hansen A, Gronholdt ML, Steffensen R, Schnohr P, et al.
(2001) Angiotensinogen mutations and risk for ischemic heart disease, myocardial infarction, and ischemic cerebrovascular disease. Six case-control studies from the Copenhagen City Heart Study. Ann Intern Med 134: 941–954. 30. Araujo MA, Goulart LR, Cordeiro ER, Gatti RR, Menezes BS, et al. (2005) Genotypic interactions of renin-angiotensin system genes in myocardial infarction. Int J Cardiol 103: 27–32.
31. Batalla A, Alvarez R, Reguero JR, Hevia S, Iglesias-Cubero G, et al. (2000) Synergistic effect between apolipoprotein E and angiotensinogen gene polymorphisms in the risk for early myocardial infarction. Clin Chem 46: 1910–1915.
32. Bis JC, Smith NL, Psaty BM, Heckbert SR, Edwards KL, et al. (2003) Angiotensinogen Met235Thr polymorphism, angiotensin-converting enzyme inhibitor therapy, and the risk of nonfatal stroke or myocardial infarction in hypertensive patients. Am J Hypertens 16: 1011–1017.
33. Buraczynska M, Pijanowski Z, Spasiewicz D, Nowicka T, Sodolski T, et al. (2003) Renin-angiotensin system gene polymorphisms: assessment of the risk of coronary heart disease. Kardiol Pol 58: 1–9.
34. Cong ND, Hamaguchi K, Saikawa T, Hara M, Sakata T (1998) A polymorphism of angiotensinogen gene codon 174 and coronary artery disease in Japanese subjects. Am J Med Sci 316: 339–344.
35. Ermis C, Tsai MY, Hanson NQ, Akar N, Aras O (2002) Angiotensin I converting enzyme, angiotensin II type 1 receptor and angiotensinogen polymorphisms and early myocardial infarction in Turkish population. Thromb Haemost 88: 693–694.
36. Fatini C, Abbate R, Pepe G, Battaglini B, Gensini F, et al. (2000) Searching for a better assessment of the individual coronary risk profile. The role of angiotensin-converting enzyme, angiotensin II type 1 receptor and angiotensinogen gene polymorphisms. Eur Heart J 21: 633–638.
AGT M235T Variant and CHD