Grey and White Matter Magnetisation
Transfer Ratio Measurements in the
Lumbosacral Enlargement: A Pilot
In Vivo
Study at 3T
Chinyere O. Ugorji1*, Rebecca S. Samson1, Martina D. Liechti1,2, Jalesh N. Panicker2, David H. Miller1, Claudia A. M. Wheeler-Kingshott1, Marios C. Yiannakas1
1NMR Research Unit, Queen Square MS Centre, Department of Neuroinflammation, UCL Institute of Neurology, London, United Kingdom,2Department of Uro-Neurology, The National Hospital for Neurology and Neurosurgery and UCL Institute of Neurology, London, United Kingdom
Abstract
Magnetisation transfer (MT) imaging of the central nervous system has provided further insight into the pathophysiology of neurological disease. However, the use of this method to study the lower spinal cord has been technically challenging, despite the important role of this region, not only for motor control of the lower limbs, but also for the neural control of lower urinary tract, sexual and bowel functions. In this study, the feasibility of obtaining reli-able grey matter (GM) and white matter (WM) magnetisation transfer ratio (MTR) measure-ments within the lumbosacral enlargement (LSE) was investigated in ten healthy volunteers using a clinical 3T MRI system. The mean cross-sectional area of the LSE (LSE-CSA) and the mean GM area (LSE-GM-CSA) were first obtained by means of image segmentation and tissue-specific (i.e. WM and GM) MTR measurements within the LSE were subse-quently obtained. The reproducibility of the segmentation method and MTR measurements was assessed from repeated measurements and their % coefficient of variation (%COV). Mean (±SD) LSE-CSA across 10 healthy subjects was 59.3 (±8.4) mm2and LSE-GM-CSA was 17.0 (±3.1) mm2. The mean intra- and inter-rater % COV for measuring the LSE-CSA were 0.8% and 2.3%, respectively and for the LSE-GM-CSA were 3.8% and 5.4%, respec-tively. Mean (±SD) WM-MTR was 43.2 (±4.4) and GM-MTR was 40.9 (±4.3). The mean scan-rescan % COV for measuring WM-MTR was 4.6% and for GM-MTR was 3.8%. Using a paired t-test, a statistically significant difference was identified between WM-MTR and GM-MTR in the LSE (p<0.0001). This pilot study has shown that it is possible to obtain reli-able tissue-specific MTR measurements within the LSE using a clinical MR system at 3T. The MTR acquisition and analysis protocol presented in this study can be used in future investigations of intrinsic spinal cord diseases that affect the LSE.
OPEN ACCESS
Citation:Ugorji CO, Samson RS, Liechti MD, Panicker JN, Miller DH, Wheeler-Kingshott CAM, et al. (2015) Grey and White Matter Magnetisation Transfer Ratio Measurements in the Lumbosacral Enlargement: A PilotIn VivoStudy at 3T. PLoS ONE 10(7): e0134495. doi:10.1371/journal.pone.0134495
Editor:Norbert Weidner, Heidelberg University Hospital, GERMANY
Received:March 31, 2015
Accepted:July 9, 2015
Published:July 31, 2015
Copyright:© 2015 Ugorji et al. This is an open access article distributed under the terms of the
Creative Commons Attribution License, which permits unrestricted use, distribution, and reproduction in any medium, provided the original author and source are credited.
Data Availability Statement:All relevant data are within the paper and its Supporting Information files.
Introduction
Neurological disorders affecting the spinal cord (SC) can involve either the grey matter (GM), white matter (WM) or both. Conditions such as multiple sclerosis (MS), amyotrophic lateral sclerosis (ALS) and neuromyelitis optica affect both tissue types [1–3], whereas certain leuko-dystrophies affect the WM tracts only [4,5]. Imaging tools that offer reliable assessment of tis-sue-specific (i.e. GM and WM) pathological involvement in the SC have potential to be helpful in the differential diagnosis, and also in monitoring the course and guiding the treatment, of such neurological conditions.
Magnetisation transfer (MT) imaging is a quantitative magnetic resonance imaging method (qMRI), which can be used in the central nervous system to study the interaction between restricted protons (i.e. protons bound to macromolecules) and free protons [6–8].Ex vivo
investigations have previously shown that the magnetisation transfer ratio (MTR) correlates with tissue myelin content and, less strongly, with axonal density in the brain [9] and spinal cord [10]. Normal regional variations in MTR have been reported in the adult brain [11–13], in normal aging [14] and the upper spinal cord [15,16]in vivo. Significant reductions in MTR values, as compared to healthy controls, have been reported in the upper SC in cases of ALS [17], MS [18–20] and spinal cord injury (SCI) [21,22], with significant correlations identified between the MTR measures and common measures of sensory and motor dysfunction.
Whilst MTR measurements in the upper SC have already provided insight into the patho-physiology of certain neurological conditions [17–22], to date there are no clinical studies reporting such changes in the lower SC. This region plays quite an important role not only for motor control of the lower limbs, but also for the neural control of lower urinary tract (LUT), sexual and bowel functions [23]. Recently, a new MRI method has been presented, which reli-ably identifies the widest cross-section of the lower SC (i.e. the lumbosacral enlargement; LSE) and proposes this as an intrinsic imaging biomarker in the study of neurological disease involv-ing the SC [24]. Whilst the method has been shown to offer reliable GM and WM cross-sec-tional area (CSA) measurements within the LSE, its utility in terms of facilitating tissue-specific qMRI investigations such as MTR is yet to be explored.
In this pilot study, the feasibility of obtaining tissue-specific MTR measurements within the LSE was investigated for the first time by utilising the detailed structural information obtain-able with the previously reported method [24], while at the same time addressing the technical challenges associated with MTR measurements at that level to provide a reliable and clinically viable index sensitive to myelin content in the lower SC.
Materials and Methods
Study Participants
Ten healthy volunteers (4 male and 6 female, mean age 28 years; range 26–35 years) were recruited for this study, with five of these returning for a repeat scan. Written informed consent was obtained from all study participants and the work was approved by the National Hospital for Neurology and Neurosurgery and the Institute of Neurology Joint Research and NRES committee London Bloomsbury (Formally, London REC2 Ethics Committee).
MR Imaging
A 3T Philips Achieva MRI system with radiofrequency (RF) multi-transmit technology (Phil-ips Healthcare, Best, Netherlands) and the manufacturer’s product 16-channel neurovascular coil and 15-channel SENSE spine coil were used. A 2D fast-spin echo (FSE) T2-weighted refer-ence scan of the thoraco-lumbar spine was first obtained in the sagittal plane and used to
facilitate planning of subsequent high-resolution structural and MTR acquisitions perpendicu-lar to the longitudinal axis of the SC.
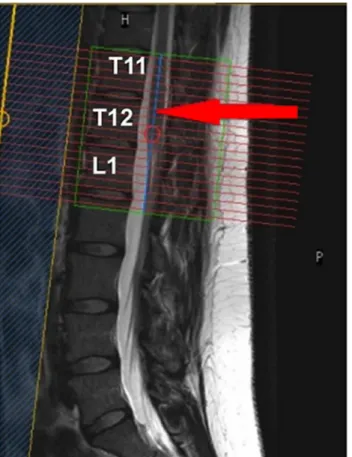
For GM and WM segmentation within the LSE, a high-resolution acquisition was pre-scribed in the axial-oblique plane (i.e. perpendicular to the cord) through the T11—L1 verte-bral level, to ensure coverage of the LSE in all cases as previously demonstrated [24,25] (Fig 1). For this, a 3D slab-selective fast field echo (3D-FFE) sequence was used with fat sup-pression and the following imaging parameters: TR = 22 ms, TE = 4.4 ms, flip angleα= 10°, FOV = 180 x 180 mm; voxel size = 0.5 x 0.5 x 5 mm3; NSA = 8, slices = 19; slice gap = 0. The scan time for this acquisition was approximately 19 minutes.
MTR imaging was performed using identical scan geometry to the structural acquisition with the following parameters: 3D slab-selective FFE with two echoes (TR / TE1 / TE2 = 36 / 1.69 / 3.1 ms; flip angleα= 10°), with and without Sinc—Gaussian shaped MT saturation pulses with nominalα= 360°; offset frequency = 1 KHz, and duration 16 ms; number of slices = 45; FOV = 180 x 180 mm; acquisition matrix = 240 x 240 mm; voxel size = 0.75 x 0.75 x 5 mm3(reconstructed voxel size in-plane = 0.5 x 0.5 mm). MTR data were acquired using a radial acquisition profile with the fold-over direction set in the foot/head (FH) direction [26]. The acquisition time for the MTR sequence was approximately 20 mins and the total scan time for the entire imaging protocol was approximately 45 mins.
Participants were positioned in the MRI scanner in such way to ensure close contact of the lower back with the flat surface of the spine coil to maximise the signal-to-noise ratio (SNR).
Fig 1. Prescription of the imaging volume between T11-L1 vertebral level to ensure coverage of the lumbosacral enlargement (LSE).Red arrow shows the position of the widest section of the LSE within the volume in this particular case.
This was achieved by elevating the legs using a triangular foam pad providing support under the knees; this ensured that the curvature of the lumbar spine was reduced thereby minimizing the gap between the lumbar spine and the spine coil. Furthermore, a strap fastened around a small rectangular pad was used across the abdomen to facilitate even closer contact with the spine coil, yet without causing any discomfort.
Image Analysis Protocol
Using the linear registration toolkit in FSL (http://www.fmrib.ox.ac.uk/fsl/) with schedule file
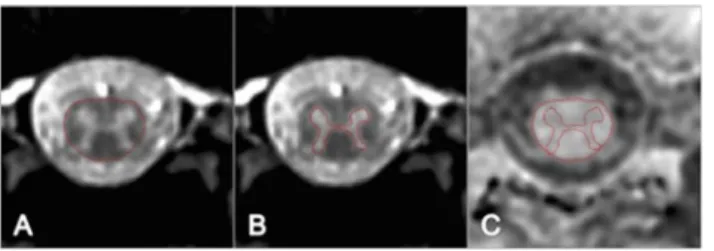
‘sch2D_6dof’and all other options set to default, the MT-off and MT-on volumes were co-reg-istered independently to the 3D-FFE high-resolution structural scan, prior to calculation of the MTR-map; this was necessary since the MT-on and MT-off images were not acquired inter-leaved therefore motion could have occurred between the two scans, and also to account for possible changes in the cord position between the acquisition of the 3D-FFE sequence and the MT-on and MT-off data. Mean CSA and MTR measurements were obtained from a 15 mm section (i.e. 3 slices) through the widest segment of the LSE as follows [24]: using the active sur-face model (ASM) segmentation method in JIM 6.0 (Xinapse systems,www.xinapse.com) [27], seed points were manually positioned in the centre of the cord on each slice of the 3D-FFE structural scan and the cord area was identified and recorded. The slice with the largest CSA was subsequently selected along with the two adjacent slices in order to calculate the mean LSE-CSA for that section (Fig 2A). From the same section, GM was segmented using JIM 6.0 and the mean area (LSE-GM-CSA) was calculated as previously described [24] (Fig 2B).
Binary masks of GM and WM were obtained (the WM mask was generated by subtracting the GM mask from the total cord mask) and applied to the MTR map to calculate mean MTR values within GM (GM-MTR) and white matter (WM-MTR) (Fig 2C). In order to ensure that GM- and WM-MTR were not significantly affected by partial volume—i.e. cerebrospinal fluid (CSF) contamination, inaccuracies at the WM and GM boundaries and possible subtle registra-tion errors—the WM and GM masks were first eroded using FSL (S1 Fig).
Reproducibility Assessment
The reproducibility of the MTR parameters was assessed by performing a‘scan-rescan test’on five out of ten healthy volunteers with a minimum of seven days (and a maximum of 14 days) in between the first and the second visits. One experienced rater analysed all the data. In order to demonstrate the intra-rater reproducibility of the GM and WM segmentation method, the same rater re-analysed all the data from the 5 volunteers’first visit twice; the analysis was per-formed on separate occasions with a minimum of 1 week between each analysis. Inter-rater reproducibility was assessed by employing a second rater to analyse the data from the 5 volun-teers’first visit. The two raters were unaware of the results of each other.
Fig 2. A) Cord cross-sectional area (CSA) contour identified using the active surface model tool (ASM) B) GM area contour identified using manual segmentation. C) CSA and GM area contours are shown overlaid onto the MTR-map following linear co-registration.
Statistical Analysis
For the scan-rescan assessment of the MTR acquisition and the intra- and inter-rater re-producibility of the segmentation method, the coefficient of variation (COV) was calculated using the mean and standard deviation from the repeated measures and the equation COV = [SD/mean] × 100%. The intra-rater segmentation results were further evaluated using the Dice similarity coefficient (DSC) [24,28].
Possible differences in MTR values between GM and WM were assessed using a paired t-test, after checking the normality of the data. Statistical significance was accepted atp<0.05.
Results
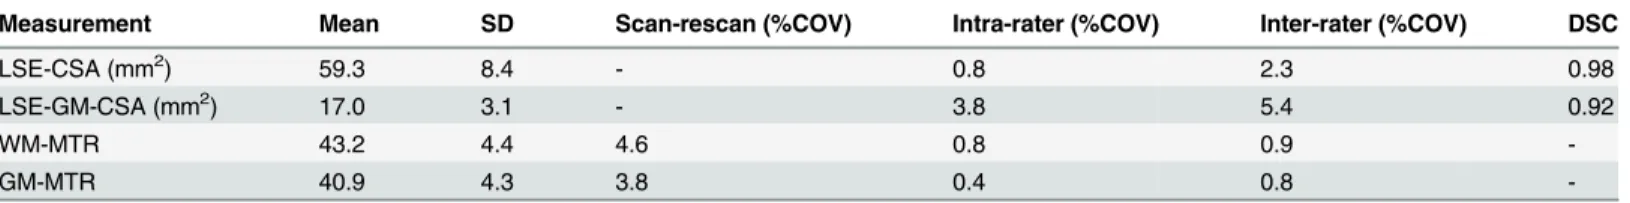
Mean (± SD) LSE-CSA of the 15 mm section studied (i.e. 3 slices) across 10 healthy subjects was 59.3 (± 8.4) mm2and mean (± SD) LSE-GM-CSA was 17.0 (± 3.1) mm2. The mean intra-and inter-rater % COV for measuring the LSE-CSA were 0.8% intra-and 2.3%, respectively intra-and for measuring the LSE-GM-CSA were 3.8% and 5.4%, respectively. Mean (± SD) DSC for a single rater (intra-rater) of the LSE-CSA was 0.98 (± 0.01) and of the LSE-GM-CSA was 0.92 (± 0.01).
Tissue-specific MTR values within these volumes were determined from the calculated MTR maps. Mean (± SD) WM-MTR was 43.2 (± 4.4) and the mean (± SD) GM-MTR was 40.9 (± 4.3). The mean scan-rescan % COV for the WM-MTR was 4.6% and for the GM-MTR was 3.8%. A paired t-test showed a statistically significant difference between the WM-MTR and GM-MTR (p<0.0001).
Table 1summarizes the main results of the study.Fig 3shows a stacked plot diagram of tis-sue-specific CSA measurements in all 10 healthy subjects.S1 Datasetcontains all the raw data for the study.
Table 1. Cross-sectional area (CSA) and magnetisation transfer ratio (MTR) measurements in the lumbosacral enlargement (LSE) of 10 healthy subjects.
Measurement Mean SD Scan-rescan (%COV) Intra-rater (%COV) Inter-rater (%COV) DSC
LSE-CSA (mm2) 59.3 8.4 - 0.8 2.3 0.98
LSE-GM-CSA (mm2) 17.0 3.1 - 3.8 5.4 0.92
WM-MTR 43.2 4.4 4.6 0.8 0.9
-GM-MTR 40.9 4.3 3.8 0.4 0.8
-Abbreviations:- LSE-CSA: Lumbosacral enlargement cross-sectional area; LSE-GM-CSA: Lumbosacral enlargement grey matter cross-sectional area; WM-MTR: White matter magnetisation transfer ratio, GM-MTR: Grey matter magnetisation transfer ratio; DSC: Dice similarity coefficient.
doi:10.1371/journal.pone.0134495.t001
Fig 3. Stacked plot diagram showing grey matter (GM) and white matter (WM) mean area fractions measured in a 15 mm section through the lumbosacral enlargement (LSE) in 10 healthy subjects.
Discussion
In this study, the feasibility of obtaining tissue-specific (i.e. GM and WM) MTR measurements within the LSE was investigated for the first time using a commercially available 3T MR system, software and hardware and by addressing a number of technical considerations. To obtain tis-sue-specific quantitative measurements within the lower SC, first a reliable way to depict these tissue types was essential. Based on a recently published report, high-resolution images of the LSE were acquired within the MTR imaging protocol and thereafter used for image segmenta-tion [24]. The effectiveness of the segmentation method was evaluated and the results were found to be in agreement with the previous report, with favorable intra-rater COV values of 3.8% for measuring the LSE-GM-CSA and 0.8% for the LSE-CSA, as compared to 8% and 2%, respectively. Inter-rater COV values were also in agreement with 5.4% for measuring the LSE-GM-CSA and 2.3% for the LSE-CSA, as compared to 8.6% and 2.5%, respectively. In addi-tion, the DSC of the LSE-CSA and LSE-GM-CSA in this study were 0.98 and 0.92, respectively as compared to 0.97 and 0.89, respectively in the previous report. These results confirmed the reliability of the segmentation method, which was subsequently used to facilitate the tissue-spe-cific MTR measurements in this study.
The MTR acquisition was set up with imaging parameters to match the structural acquisi-tion as closely as possible, albeit with some necessary modificaacquisi-tions. Due to SNR restricacquisi-tions, it was not possible to achieve identical in-plane resolution to the structural scan (i.e. 0.5 x 0.5 mm2), requiring post-acquisition interpolation (i.e. in k-space) of the data acquired at a 0.75 x 0.75 mm2resolution. SNR restrictions may be addressed either by using a larger voxel size, lon-ger acquisition times or with the use of dedicated RF coil designs, but such options were either unsuitable or unavailable in this particular case. Furthermore, the physiological motion arising from major blood vessels, the kidney and the bowel function, often requires the use of regional saturation (REST) slabs to compensate. However, such measures of physiological motion-related image artifact reduction involve the use of additional RF pulses within the pulse sequence, with concomitant negative effects on the measurable MTR. To partly account for this, the MTR sequence was used with a radial acquisition profile and the fold-over direction set in the foot/head (FH), therefore alleviating the need for REST slabs. However, using radial acquisitions, aliasing artifacts are often encountered and must be accounted for whenever pos-sible. For this reason, a much larger imaging volume was used than the anatomical region of interest, and the edge slices that were affected the most were subsequently discarded. Of course, this also meant that the scanning time was increased and future pulse sequence developments should try to address such limitation. Additional sources of physiological motion-related arti-facts in spinal cord imaging may include CSF pulsation, though less concerning in this case considering the amplitude of pulsation is considerably lower in the lumbar spine than in the cervical and thoracic spine [29,30].
The structural images were co-registered with the MTR maps using linear registration, first by registering the MT-off and MT-on volumes independently to the structural scan, prior to calculation of the MTR-map. Despite matching the imaging parameters of the acquisitions as closely as possible, it is likely that the use of a radial acquisition profile for MTR imaging may have hampered the registration process due to the differences in data reconstruction between Cartesian and radial profiles [26]. Nevertheless, to partly account for such potential inaccura-cies, the GM and WM masks were eroded prior to the calculation of MTR values and therefore such effects, as well as CSF contamination and inaccuracies at the WM and GM boundaries, are unlikely to have confounded the measurements considerably.
In this study,in vivoWM-MTR and GM-MTR normative values in 10 volunteers measured from the total volumes extracted from a 15 mm section of the LSE are reported for the first time. The significant difference in MTR values observed between GM and WM (p<0.0001), is
likely to reflect a difference in myelin content between these tissue types. However, the absolute MTR measure reflects a complex combination of various biological factors and is also highly sequence- and MR system-dependent, therefore the MTR values obtained in this study cannot be directly compared with those obtained using a different sequence or at another centre. Quantitative MT (qMT) imaging provides more fundamental parameters relating to tissue structure and future investigations using this technique may allow further insight into differ-ences between GM and WM in the lower SC.
Obtaining tissue-specific MTR measurements within the LSE may have potential clinical applications in the evaluation of patients where a lower SC lesion is suspected. Spinal cord injury [33–38], and MS [39,40] may affect the lower SC, resulting in lower limb weakness and LUT, sexual and bowel dysfunction. In neurodegenerative conditions such as multiple system atrophy (MSA) selective degeneration occurs in the lower SC, specifically the Onuf’s and para-sympathetic nuclei of the sacral cord resulting in urinary retention and changes of reinnerva-tion in the anal sphincter muscle as detected by concentric needle EMG [41,42].Ex vivo
investigations have provided evidence of somatic and motor neurons loss in the lower SC in MSA [43], and pathology in the LSE is probably the main cause of LUT dysfunction. However, it is not possible using the current protocol to identify with certainty the regions of the LSE from which the somatic, parasympathetic and sympathetic innervation for the LUT arise [23]. Routine clinical MRI sequences are often insensitive to detect such changes however, and the use of quantitative imaging measures in the lower SC (LSE) would help to evaluate intrinsic pathological abnormalitiesin vivowith the potential for clinical applications.
spinal cord templates, or other fully-automated image analysis methods depending on the spe-cific application.
In summary, the results of this study show that it is possible to obtainin vivotissue-specific MTR measurements within the LSE using a clinical MR system at 3T. This pilot study provides a solid foundation for future investigative studies involving patients with neurological disorders affecting the LSE region of the SC.
Supporting Information
S1 Dataset. Raw data.
(XLSX)
S1 Fig. A) Example of grey matter segmentation (contour shown in red) B) pixels within grey matter with minimal or no partial volume (green points) maybe used to calculate MTR.
(TIFF)
Acknowledgments
This work and the NMR Research Unit are supported by the Multiple Sclerosis Society of Great Britain and Northern Ireland and the Department of Health’s Comprehensive Biomedi-cal Research Centre at University College Hospitals Trust.
Author Contributions
Conceived and designed the experiments: CU RS CW MY. Performed the experiments: CU RS ML MY. Analyzed the data: CU MY ML. Contributed reagents/materials/analysis tools: MY JP DM CW. Wrote the paper: CU RS ML JP DM CW MY.
References
1. Gilmore CP, Bö L, Owens T, Lowe J, Esiri MM, Evangelou N (2006) Spinal cord gray matter demyelin-ation in multiple sclerosis—a novel pattern of residual plaque morphology. Brain Pathol 16:202–208. PMID:16911477
2. Tsukagoshi H, Yanagisawa N, Oguchi K, Nagashima K, Murakami T (1979) Morphometric quantifica-tion of the cervical limb motor cells in controls and in amyotrophic lateral sclerosis. J Neurol Sci 41:287–297. PMID:438856
3. Jarius S, Wildemann B (2010) AQP4 antibodies in neuromyelits optica: diagnostic and pathogenetic rel-evance. Nat Rev Neurol 6:383–392. doi:10.1038/nrneurol.2010.72PMID:20639914
4. Schiffmann R, van der Knaap MS (2009) Invited article: an MRI-based approach to the diagnosis of white matter disorders. Neurology 72:750–759. doi:10.1212/01.wnl.0000343049.00540.c8PMID: 19237705
5. Labauge P (2009) Magnetic resonance findings in leucodystrophies and MS. Int MS J 16:47–56. PMID:19671368
6. Wolff SD, Balaban RS (1989) Magnetization transfer contrast (MTC) and tissue water proton relaxation in vivo. Magn Reson Med 10:135–144. PMID:2547135
7. Fralix TA, Ceckler TL, Wolff SD, Simon SA, Balaban RS (1991) Lipid bilayer and water proton magneti-zation transfer effect of cholesterol. Magn Reson Med 18:214–223. PMID:2062233
8. Henkelman RM, Stanisz GJ, Graha GJ (2001) Magnetization transfer in MRI: a review. NMR Biomed 14:57–64. PMID:11320533
9. Schmierer K, Scaravilli F, Altmann DR, Barker GJ, Miller DH (2004) Magnetization transfer ratio and myelin in postmortem multiple sclerosis brain. Ann Neurol 56:407–415. PMID:15349868
11. Mehta RC, Pike GB, Enzmann DR (1995) Magnetization transfer MR of the normal adult brain. AJNR Am J Neuroradiol 16:2085–91. PMID:8585499
12. Garcia M, Gloor M, Bieri O, Wetzel SG, Radue EW Scheffler K (2011) MTR variations in normal adult brain structures using balanced steady-state free precession. Neuroradiology 53:159–67. doi:10. 1007/s00234-010-0714-5PMID:20480154
13. Sled JG, Levesque I, Santos AC, Francis SJ, Narayanan S, Brass SD, et al (2004). Regional variations in normal brain shown by quantitative magnetization transfer imaging. Magn Reson Med 51:299–303. PMID:14755655
14. Callaghan MF, Freund P, Draganski B, Anderson E, Cappelletti M, Chowdhury R, et al (2014) Wide-spread age-related differences in the human brain microstructure revealed by quantitative magnetic resonance imaging. Neurobiol aging 35:1862–1872. doi:10.1016/j.neurobiolaging.2014.02.008PMID: 24656835
15. Yiannakas MC, Kearney H, Samson RS, Chard DT, Ciccarelli O, Miller DH, et al (2012) Feasibility of grey matter and white matter segmentation of the upper cervical cord in vivo: a pilot study with applica-tion to magnetisaapplica-tion transfer measurements. Neuroimage 63:1054–9. doi:10.1016/j.neuroimage. 2012.07.048PMID:22850571
16. Samson RS, Ciccarelli O, Kachramanoglou C, Brightman L, Lutti A, Thomas DL, et al (2013) Tissue-and column-specific measurements from multi-parameter mapping of the human cervical spinal cord at 3T. NMR Biomed 26:1823–30. doi:10.1002/nbm.3022PMID:24105923
17. El Mendili MM, Cohen-Adad J, Pelegrini-Issac M, Rossignol S, Morizot-Koutlidis R, Marchand-Pauvert V, et al (2014) Multi-parametric spinal cord MRI as potential progression marker in amyotrophic lateral sclerosis. PloS One 9:e95516. doi:10.1371/journal.pone.0095516PMID:24755826
18. Oh J, Saidha S, Chen M, Smith SA, Prince J, Jones C, et al (2013) Spinal cord quantitative MRI discrim-inates between disability levels in multiple sclerosis. Neurology 80:540–547. doi:10.1212/WNL. 0b013e31828154c5PMID:23325903
19. Oh J, Zackowski K, Chen M, Newsome S, Saidha S, Smith SA, et al. Multiparametric MRI correlates of sensorimotor function in the spinal cord in multiple sclerosis. Mult Scler 19:427–435. doi:10.1177/ 1352458512456614PMID:22891033
20. Zackowski KM, Smith SA, Reich DS, Gordon-Lipkin E, Chodkowski BA, Sambandan DR, et al (2009) Sensorimotor dysfunction in multiple sclerosis and column-specific magnetization transfer-imaging abnormalities in the spinal cord. Brain 132:1200–1209. doi:10.1093/brain/awp032PMID:19297508 21. Cohen-Adad J, El Mendili MM, Lehericy S Pradat PF, Blancho S, Rossignol S, et al (2011)
Demyelin-ation and degenerDemyelin-ation in the injured human spinal cord detected with diffusion and magnetizDemyelin-ation transfer MRI. Neuroimage 55:1024–1033. doi:10.1016/j.neuroimage.2010.11.089PMID:21232610 22. Freund P, Weiskopf N, Ashburner J, Wolf K, Sutter R, Altmann DR, et al (2013) MRI investigation of the
sensorimotor cortex and the corticospinal tract after acute spinal cord injury: a prospective longitudinal study. Lancet Neurol 12:873–881. doi:10.1016/S1474-4422(13)70146-7PMID:23827394
23. Fowler CJ, Griffiths D, de Groat WC (2008) The neural control of micturition. Nat Rev Neurosci 9:453– 66. doi:10.1038/nrn2401PMID:18490916
24. Yiannakas MC, Kakar P, Hoy LR, Miller DH, Wheeler-Kingshott CA (2014) The Use of the Lumbosacral Enlargement as an Intrinsic Imaging Biomarker: Feasibility of Grey Matter and White Matter Cross-Sec-tional Area Measurements Using MRI at 3T. PLoS One 9:e105544. doi:10.1371/journal.pone. 0105544PMID:25170763
25. Malas MA, Seker M, Salbacak A, Büyükmumcu M, Karabulut AK, Yardimci C (2000) The relationship between the lumbosacral enlargement and the conus medullaris during the period of foetal develop-ment and adulthood. Surgical and Radiology Anatomy 22:163–168.
26. Glover GH, Pauly JM (1992) Projection reconstruction techniques for reduction of motion effects in MRI. Magn Reson Med 28:275–89. PMID:1461126
27. Horsfield MA, Sala S, Neema M, Absinta M, Bakshi A, Sormani MP, et al (2010) Rapid semi-automatic segmentation of the spinal cord from magnetic resonance images: application in multiple sclerosis. Neuroimage 50:446–55. doi:10.1016/j.neuroimage.2009.12.121PMID:20060481
28. Dice LR (1945) Measures of the amount of ecologic association between species. Ecology 26:297– 302.
29. Du Boulay GH (1966) Pulsatile movements in the CSF pathways. Br J Radiol 39:255–62 PMID: 5295581
30. Lane B, Kricheff II (1974) Cerebrospinal fluid pulsations at myelography: a videodensitometric study. Radiology 110:579–87. PMID:4811678
32. Gringel T, Schulz-Schaeffer W, Elolf E, Frölich A, Dechent P, Helms G (2009) Optimized high-resolu-tion mapping of magnetizahigh-resolu-tion transfer (MT) at 3 Tesla for direct visualizahigh-resolu-tion of substructures of the human thalamus in clinically feasible measurement time. J Magn Reson Imaging 29:1285–92. doi:10. 1002/jmri.21756PMID:19472385
33. Watanabe T, Vaccaro AR, Kumon H, Welch WC, Rivas DA, Chancellor MB (1998) High incidence of occult neurogenic bladder dysfunction in neurologically intact patients with thoracolumbar spinal inju-ries. J Urol 159:965–968. PMID:9474194
34. Hess MJ, Hough S (2006) Impact of spinal cord injury on sexuality: broad-based clinical practice inter-vention and practical application. J Spinal Cord Med 35:211–218.
35. Craggs MD, Balasubramaniam AV, Chung EA, Emmanuel AV (2006) Aberrant reflexes and function of the pelvic organs following spinal cord injury in man. Auton Neurosci 126–127:355–70.
36. Nout YS, Leedy GM, Beattie MS, Bresnahan JC (2006) Alterations in eliminative and sexual reflexes after spinal cord injury: defecatory function and development of spasticity in pelvic floor musculature. Progress in Brain Research 152:359–372. PMID:16198713
37. Anderson KD, Borisoff JF, Johnson RD, Stiens SA, Elliott SL (2007) The impact of spinal cord injury on sexual function: concerns of the general population. Spinal Cord 45:328–337. PMID:17033620 38. Reitz A, Tobe V, Knapp PA, Schurch B (2004) Impact of spinal cord injury on sexual health and quality
of life. Int J Impot Res 16:167–174. PMID:14973522
39. McCombe PA, Gordon TP, Jackson MW (2009) Bladder dysfunction in multiple sclerosis. Expert Rev Neurother 9:331–340. doi:10.1586/14737175.9.3.331PMID:19271942
40. Fernandez O (2002) Mechanisms and current treatments of urogenital dysfunction in multiple sclerosis. J Neurol 249:1–8. PMID:11954855
41. Sakakibara R, Hattori T, Tojo M, Yamanishi T, Yasuda K, Hirayama K (1993) Micturitional disturbance in multiple system atrophy. Jpn J Psychiatry Neurol 47:591–598. PMID:8301874
42. Sakakibara R, Hattori T, Uchiyama T, Kita K, Asahina M, Suzuki A, et al (2000) Urinary dysfunction and orthostatic hypotension in multiple system atrophy: which is the more common and earlier manifesta-tion? J Neurol Neurosurg Psychiatry 68:65–69. PMID:10601404