ACPD
12, 20631–20671, 2012Particulate polycyclic aromatic
hydrocarbons
A. Guillon et al.
Title Page
Abstract Introduction
Conclusions References
Tables Figures
◭ ◮
◭ ◮
Back Close
Full Screen / Esc
Printer-friendly Version
Interactive Discussion
Discussion
P
a
per
|
Dis
cussion
P
a
per
|
Discussion
P
a
per
|
Discussio
n
P
a
per
|
Atmos. Chem. Phys. Discuss., 12, 20631–20671, 2012 www.atmos-chem-phys-discuss.net/12/20631/2012/ doi:10.5194/acpd-12-20631-2012
© Author(s) 2012. CC Attribution 3.0 License.
Atmospheric Chemistry and Physics Discussions
This discussion paper is/has been under review for the journal Atmospheric Chemistry and Physics (ACP). Please refer to the corresponding final paper in ACP if available.
Chemical characterization and stable
carbon isotopic composition of
particulate polycyclic aromatic
hydrocarbons issued from combustion of
10 Mediterranean woods
A. Guillon1,2, K. Le M ´enach1,2, P.-M. Flaud1,2, N. Marchand3, H. Budzinski1,2, and E. Villenave1,2
1
CNRS, Laboratoire EPOC (Environnements et Pal ´eoenvironnements Oc ´eaniques et Continentaux), UMR5805, Equipe LPTC (Laboratoire de Physico- et Toxico-Chimie de l’Environnement, 33400 Talence, France
2
Univ. Bordeaux, EPOC, UMR5805, 33400 Talence, France
3
Universit ´es d’Aix-Marseille-CNRS, UMR6264, Laboratoire Chimie Provence, Equipe Instrumentation et R ´eactivit ´e Atmosph ´erique, Marseille, 13331, France
Received: 29 May 2012 – Accepted: 21 July 2012 – Published: 17 August 2012
Correspondence to: E. Villenave ([email protected])
ACPD
12, 20631–20671, 2012Particulate polycyclic aromatic
hydrocarbons
A. Guillon et al.
Title Page
Abstract Introduction
Conclusions References
Tables Figures
◭ ◮
◭ ◮
Back Close
Full Screen / Esc
Printer-friendly Version
Interactive Discussion
Discussion
P
a
per
|
Dis
cussion
P
a
per
|
Discussion
P
a
per
|
Discussio
n
P
a
per
|
Abstract
The objectives of this study were to characterize polycyclic aromatic hydrocarbons from particulate matter emitted during wood combustion and to determine, for the first time, the isotopic signature of PAHs from nine wood species and Moroccan coal from the
Mediterranean Basin. In order to differentiate sources of particulate-PAHs, molecular
5
and isotopic measurements of PAHs were performed on the set of wood samples for a large panel of compounds. Molecular profiles and diagnostic ratios were measured by gas chromatography coupled with a mass spectrometer (GC/MS) and molecular
iso-topic compositions (δ13C) of particulate-PAHs were determined by gas
chromatogra-phy/combustion/isotope ratio mass spectrometry (GC/C/IRMS). Wood species present
10
similar molecular profiles with benz(a)anthracene and chrysene as dominant PAHs,
whereas levels of concentrations range from 1.8 to 11.4 mg g−1OC (sum of PAHs).
Di-agnostic ratios are consistent with reference ratios from literature but are not sufficient
to differentiate the different species of woods. Concerning isotopic methodology, PAH
molecular isotopic compositions are specific for each species and contrary to
molecu-15
lar fingerprints, significant variations ofδ13C are observed for the panel of PAHs. This
work allows differentiating wood combustion from others origins of particulate matter
(vehicular exhaust) using isotopic measurements (with δ13CPAH=−28.7 to −26.6 ‰)
but also confirms the necessity to investigate source characterisation at the emission in order to help and complete source assessment models. These first results on
wood-20
burnings will be useful for the isotopic approach of source tracking.
1 Introduction
Polycyclic Aromatic Hydrocarbons (PAHs) are ubiquitous compounds in the environ-ment, detected in various compartments such as water (Latimer and Zheng, 2003; Amoako et al., 2011), sediments (Latimer and Zheng, 2003; Srogi, 2007; Van Drooge
25
ACPD
12, 20631–20671, 2012Particulate polycyclic aromatic
hydrocarbons
A. Guillon et al.
Title Page
Abstract Introduction
Conclusions References
Tables Figures
◭ ◮
◭ ◮
Back Close
Full Screen / Esc
Printer-friendly Version
Interactive Discussion
Discussion
P
a
per
|
Dis
cussion
P
a
per
|
Discussion
P
a
per
|
Discussio
n
P
a
per
|
2008), organisms (Meador, 2003; Perugini et al., 2007; Srogi, 2007) or air (Ravindra et al., 2008; Van Drooge and Ballesta, 2009; Yan et al., 2009; Sheesley et al., 2011). Most of PAHs come from the incomplete combustion of organic materials and are potentially carcinogenic and mutagenic for human beings (Atkinson and Arey, 1994; Kang et al., 2011; IARC, 2011). In the atmosphere, they are distributed between gaseous phase
5
and particles (Eiguren-Fernandez et al., 2004; R ´e-Poppi and Santiago-Silva, 2005). Main origins of particulate-PAHs are anthropogenic such as emissions from domes-tic (residential heating) and industrial activities, agriculture and/or vehicular exhausts. Wood combustion represents a non-negligible origin of particulate-PAHs because of the variety of human activities involving biomass burning such as building heating,
10
cooking (Lee et al., 2005) or swidden, slash-and-burn farming, but also because of natural wood combustions (forest fires).
The identification and the apportionment of PAH sources are related to the descrip-tion of source characteristics, for example molecular and/or isotopic features. Several methodologies of source tracking were developed on the measurements of
particulate-15
PAH concentrations and on the use of molecular profiles and/or diagnostic ratios (Guo et al., 2003; Dallarosa et al., 2005; Ravindra et al., 2008). Some works reported the concentrations of a large range of particulate-PAHs emitted for instance during the
combustion of different wood species in the United States of America and contributed
to the characterization of molecular profiles at the emission (Fine et al., 2001, 2002,
20
2004). For example, their data are considered in several works as wood combustion fingerprints for source apportionment using Chemical Mass Balance model (Yang and Chen, 2004; Sheesley et al., 2008). Nevertheless, due to the large variety of wood species and the high reactivity of PAH compounds in the atmosphere, involving vari-ations of concentrvari-ations and diagnostic ratios, it is sometimes risky to apportion PAH
25
sources by the only application of such approaches.
ACPD
12, 20631–20671, 2012Particulate polycyclic aromatic
hydrocarbons
A. Guillon et al.
Title Page
Abstract Introduction
Conclusions References
Tables Figures
◭ ◮
◭ ◮
Back Close
Full Screen / Esc
Printer-friendly Version
Interactive Discussion
Discussion
P
a
per
|
Dis
cussion
P
a
per
|
Discussion
P
a
per
|
Discussio
n
P
a
per
|
particulate matter in the atmosphere (O’Malley et al., 1994; Guillon et al., 2012a), only few studies describe the isotopic compositions of PAHs for wood combustion (Ballen-tine et al., 1996; O’Malley et al., 1997). In order to contribute to the development of source tracking for particulate-PAHs, eleven Mediterranean wood species were burned in a combustion chamber to identify molecular and isotopic fingerprints of emitted
5
particulate-PAHs. Concentrations of a large panel of PAHs were measured by GC/MS analysis and the determination of molecular stable-carbon isotopic compositions was performed by GC/C/IRMS analysis. The aim of these measurements was to character-ize combustion emissions of several wood species, potentially involved in the pollution of Mediterranean area during biomass burning and/or forest fire episodes and largely,
10
to provide molecular isotopic signatures of wood burnings for source assessment in Europe.
2 Experimental procedure
2.1 Description of wood species
A large variety of wood species from the Mediterranean Basin was selected for the
15
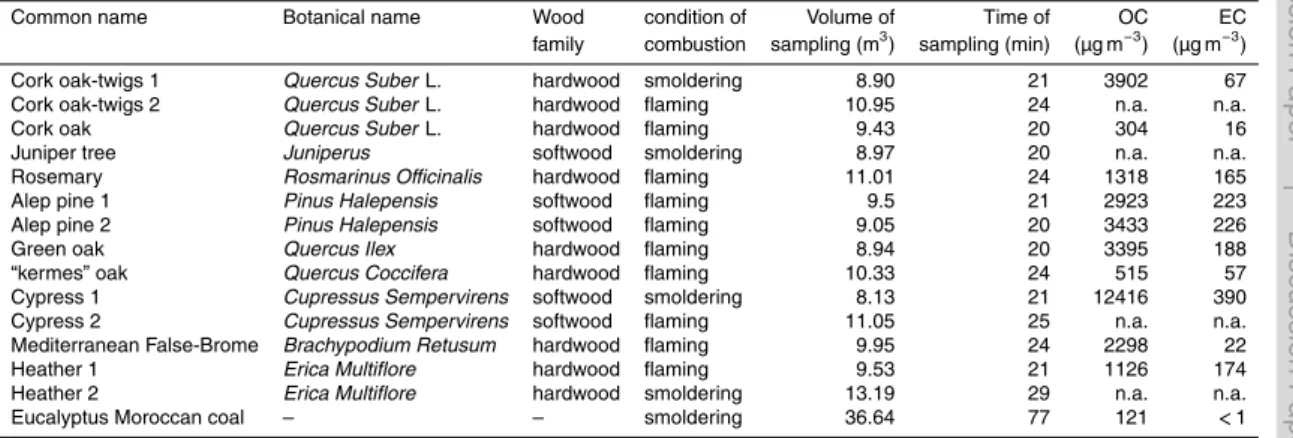
study of particulate matter emitted during wood combustion. Collection of woods was performed in the natural park of “Calanques de Marseille” (France). Table 1 summa-rizes the main characteristics of the selected woods: nine plant species and eucalyptus Moroccan coal which is commonly used in North African countries for cooking prepa-ration.
20
Note that some woods were studied several times in order to compare different
con-ditions of combustion and the way of wood cutting prior to experiments. Organic and elemental carbon (OC and EC) measurements were not performed on the entire panel
of wood species. After collection, all wood samples were dried up at 50◦C during two
days.
ACPD
12, 20631–20671, 2012Particulate polycyclic aromatic
hydrocarbons
A. Guillon et al.
Title Page
Abstract Introduction
Conclusions References
Tables Figures
◭ ◮
◭ ◮
Back Close
Full Screen / Esc
Printer-friendly Version
Interactive Discussion
Discussion
P
a
per
|
Dis
cussion
P
a
per
|
Discussion
P
a
per
|
Discussio
n
P
a
per
|
2.2 Setup for wood combustion
Wood combustion experiments were carried out at Lannemezan in the combustion fa-cility of the Laboratory d’A ´erologie (UMR5560, Toulouse, France) made up of three
rooms: the fireplace, the mixing chamber (120 m3) and the laboratory for
measure-ment monitoring. The fireplace was equipped with a chimney allowing the circulation of
5
smoke to the mixing chamber by a trap door. The internal surface of this room was ren-dering. Approximately 100 grams of each wood were burned in the fireplace and once combustion was stabilized, smoke was injected in the mixing chamber by opening the trap door. After 5 min, the door was closed and two fans were activated to homogenize the repartition of products of combustion (particles and gases) in all the volume of the
10
mixing chamber prior sampling. Samples were collected during 20 min (Table 1). At the end of each combustion experiment, the mixing chamber was vented in order to renew the full atmosphere between two experiments.
2.3 Sample collection
Wood combustion aerosol particles with aerodynamic diameters less than 2.5 µm were
15
collected on quartz filters (150 mm diameter, Whatman, Q-MA) using a high-volume
sampler (M ´egatec Digitel DA-80, 30 m3h−1
). Collection was performed during around
20 min corresponding to a sampling volume of (10±1.3) m3 for the different species,
except for eucalyptus Moroccan coal (sampling time 77 min corresponding to a volume
of 36.6 m3). Field blanks (consisting in exposed filter without any air filtration) were
col-20
lected before each combustion experiment. Prior to sampling, all the quartz fibre filters
were heated at 500◦C during 4 h. After sampling, filters were wrapped in aluminium foil,
sealed in polyethylene bags and stored at−20◦C. To perform different kind of analysis
on the same panel of wood combustions, filters were punched: 0.64 cm2of each filter
were used for the quantification of particulate-PAHs, 1 cm2 for the analysis of organic
25
and elemental carbon (OC/EC) and 16.62 cm2 of filters were used to determine the
ACPD
12, 20631–20671, 2012Particulate polycyclic aromatic
hydrocarbons
A. Guillon et al.
Title Page
Abstract Introduction
Conclusions References
Tables Figures
◭ ◮
◭ ◮
Back Close
Full Screen / Esc
Printer-friendly Version
Interactive Discussion
Discussion
P
a
per
|
Dis
cussion
P
a
per
|
Discussion
P
a
per
|
Discussio
n
P
a
per
|
EC and OC measurements were performed on 1.5 cm2of each filter using a
Thermo-Optical Transmission (TOT) method on a Sunset Lab analyser (Birch and Cary, 1996) implemented with the EUSAAR 2 method (Cavalli et al, 2010).
2.4 Analytical procedure
2.4.1 Validation on standard reference materials
5
Three standard reference materials were used for the validation of the full analytical procedure from extraction to quantification steps. Urban Dust (SRM 1649a) and Diesel exhaust (SRM 2975 and SRM 1650b) were purchased from NIST (Gaithersburg, MD, USA). As ambient particle samples, these materials are very complex containing a large panel of organic and inorganic compounds. SRM 1649a was collecting during
10
12 months in the Washington DC area in 1976–1977 and represents a time-integrated sample of urban area (Wise and Watters, 2007). Four-cycle diesel engines operat-ing in a large variety of conditions duroperat-ing 200 h allowed the collection of SRM 1650b which was representative of heavy-duty diesel engine emissions (Wise and Watters, 2006). SRM 2975 was collected from a filtering system designed for an industrial
15
diesel-powered forklift (Wise and Watters, 2009). The certified value for total carbon
(organic and elemental) is (0.1768±0.0019) g g−1for SRM 1649a particle. This value
was not available for Diesel exhausts. These sets of particles are certified for PAH concentrations by NIST.
2.4.2 Extraction by pressurised fluid extraction
20
Pressurised fluid extractions (PFE) were performed using accelerated solvent extractor ASE 350 (Dionex SA). A large range of parameters were reported in the literature for the extraction of particulate-PAHs. This technique was validated and largely employed for the certification of NIST materials such as SRM 1649a or SRM 2975 (Schantz et al., 1997). In our study, extractions were performed in dichloromethane (“For residue
ACPD
12, 20631–20671, 2012Particulate polycyclic aromatic
hydrocarbons
A. Guillon et al.
Title Page
Abstract Introduction
Conclusions References
Tables Figures
◭ ◮
◭ ◮
Back Close
Full Screen / Esc
Printer-friendly Version
Interactive Discussion
Discussion
P
a
per
|
Dis
cussion
P
a
per
|
Discussion
P
a
per
|
Discussio
n
P
a
per
|
and pesticides analysis” type, Acros Organics) under following parameters:T =100◦C,
P =100 Bars, heat time of 6 min with 2 static cycles of 8 min. Different sizes of ASE
stainless steel cells were employed for the different extraction required in this study in
order to optimize the volume of solvent against the volume occupied by the filter or the punch in the cell. Therefore, standard reference materials deposed on glass fibre
5
filters, punches of filters (0.64 cm2) cut offfor the quantification of PAHs and punches
(16.62 cm2) of blank filters were extracted in 10 ml cells whereas remains of filters used
for the determination of isotopic compositions in 34 ml cells. Prior to the extraction, a cellulose filter (19.8 mm diameter, Dionex SA) was placed at the bottom of the cell and one third of the cell was filled up with 2.0-mm-diameter glass beads (A556, Roth)
10
previously cleaned and heated at 450◦C during 4 h. Filters folded in four were placed
in the cell and the volume was completed with glass beads in order to minimize the dead volume. For quantitative measurements by GC-MS, internal standards (20 µl per samples) were added gravimetrically in the cell and then, the cell was completely filled with glass beads. After the extraction, filtration was performed in the PFE cell through
15
the cellulose filter.
Moreover, the cells filled with the cellulose filter and glass beads were pre-extracted using the same extraction conditions as for the samples.
2.4.3 Purification procedure on micro-columns
After extraction and filtration, the extract was concentrated in approximately 500 µl
20
in the extraction solvent using a vacuum evaporation system (RapidVap, Labconco), under the following conditions: vortex motion (70 %), vacuum (900 mBars) and heat
(51◦C). Different purification steps were then required to remove all undesirable
or-ganic compounds that could interfere in the PAH analysis. The extract was first puri-fied on a micro-column containing activated copper (copper powder, 40 mesh,
Sigma-25
Aldrich) which allowed sulphur elimination, and alumina (aluminium oxide, 150 Basic Type T, Merck, VWR) in order to remove macromolecules present in these complex
ACPD
12, 20631–20671, 2012Particulate polycyclic aromatic
hydrocarbons
A. Guillon et al.
Title Page
Abstract Introduction
Conclusions References
Tables Figures
◭ ◮
◭ ◮
Back Close
Full Screen / Esc
Printer-friendly Version
Interactive Discussion
Discussion
P
a
per
|
Dis
cussion
P
a
per
|
Discussion
P
a
per
|
Discussio
n
P
a
per
|
The extract was then concentrated with low heating (T =40◦C) under nitrogen stream
(N2, 99.995 % purity, Linde Gas) and the solvent was changed to iso-octane
(2,2,4-trimethyl pentane, HPLC grade, Scharlau). Finally, the sample was fractionated on a micro-column of silica (0.063–0.200 mm diameter, Merck). The first fraction contain-ing alkanes was eluted with 2 ml of pentane (Ultra Resi-analyzed type, JT Baker) and
5
the second fraction containing PAHs with 3×5 ml of pentane/dichloromethane (65/35,
v/v). Again, this fraction was concentrated under nitrogen stream and low heating and the solvent was changed in isooctane prior to the analysis.
In the case of GC/MS analysis, the final volume was not a critical point due to the use of internal and “syringe” standards. Analyte losses were evaluated by checking the
10
internal standards recovery yields. “Syringe” standards were added to the sample and measured gravimetrically prior to the analysis by GC/MS for the quantification of the internal standards.
In the case of GC/C/IRMS analysis, neither internal standard nor syringe standard were used because molecular isotopic composition of a compound could be measured
15
only if no coelution with other compounds appeared. Under our analytical conditions, native and perdeuterated PAHs were coeluted involving an external calibration of the GC/C/IRMS system.
2.4.4 Quantification of PAHs
Gas chromatography coupled with a mass spectrometer (GC/MS) analyses were
per-20
formed for the quantification of PAHs in the samples and for the validation of HPLC fractionation. Quantitative analyses were performed using gas chromatography (HP model Series 6890) coupled to a quadrupole mass spectrometer (HP model 5973).
Two different columns were used. First, for PAHs quantification, the capillary column
was a 30 m×0.25 mm ID×0.25 µm film thickness Rxi-17 (50 % of diphenyl and 50 %
25
of dimethyl-polysiloxane, Restek) in order to analyse some isomers classically coelu-tated in usual chromatographic conditions. One µl was injected into the GC (7683
ACPD
12, 20631–20671, 2012Particulate polycyclic aromatic
hydrocarbons
A. Guillon et al.
Title Page
Abstract Introduction
Conclusions References
Tables Figures
◭ ◮
◭ ◮
Back Close
Full Screen / Esc
Printer-friendly Version
Interactive Discussion
Discussion
P
a
per
|
Dis
cussion
P
a
per
|
Discussion
P
a
per
|
Discussio
n
P
a
per
|
flow=60 ml min−1, 25 psi pulse during 90 s). The injector temperature was 280◦C and
the oven temperature was held at 60◦C during 2 min, then programmed from 60◦C to
320◦C at a rate of 10◦C min−1
and held at 320◦C during 25 min. Helium (He, 99.9996 %
purity, Linde Gas) was used as carrier gas at the constant flow of 1.3 ml min−1. The
interface temperature was kept to 290◦C during analysis. Ionization was realized by
5
electron impact mode (70 eV) and mass detection was performed in selected ion
mon-itoring (SIM) mode (dwell time = 30 ms, electron multiplier voltage = (1620±50) V,
solvent delay=5 min). The ion molecularm/zwere chosen for native and
perdeuter-ated PAHs.
PAH concentrations were measured using internal standard quantification and
more-10
over, internal standards were quantified using “syringe” standards. This double quantifi-cation allowed the calculation of internal standard recovery yields and hence, to check that internal standards, and therefore native PAHs, were not lost along the analytical procedure. As described before in Sect. 2.4.2, internal standards were added prior to the extraction in the ASE cell and “syringe” standards at the end of sample
prepara-15
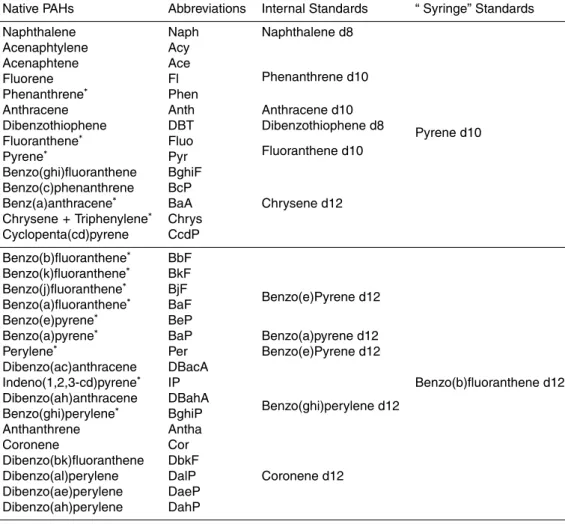
tion before the GC/MS analysis. All the standards used in this study are presented in Table 2. This GC/MS method was validated by the application of our analytical pro-cedure on SRM 1649a and SRM 1650b. Percentages of recovery yields for internal standards vary from 50 % to 97 % depending on the compounds (see Sect. S1 in the Supplement).
20
Then, for the validation of HPLC fractionation, a classical method was applied on all the collected fractions. Analysis were performed by GC/MS using an HP model Series 5890 Gas Chromatograph coupled to an HP model 5972 mass-selective
detec-tor (quadrupole) (Agilent Technologies). The capillary column was a 30 m×0.25 mm
ID×0.25 µm film thickness HP-5MS (Agilent Technologies). One µl was introduced into
25
the GC via an auto-injector (HP model 7673, Agilent Technologies) in splitless mode
injection (purge delay=60 s, purge flow=60 ml min−1, 25 psi pulse during 60 s). The
injector temperature was 270◦C and the oven temperature was held at 60◦C during
ACPD
12, 20631–20671, 2012Particulate polycyclic aromatic
hydrocarbons
A. Guillon et al.
Title Page
Abstract Introduction
Conclusions References
Tables Figures
◭ ◮
◭ ◮
Back Close
Full Screen / Esc
Printer-friendly Version
Interactive Discussion
Discussion
P
a
per
|
Dis
cussion
P
a
per
|
Discussion
P
a
per
|
Discussio
n
P
a
per
|
330◦C during 5 min. Helium (99.9996 % purity, Linde Gas) was used as carrier gas at
the constant flow of 1.3 ml min−1. The interface temperature was kept to 290◦C during
analysis. Ionization was realized by electron impact mode (70 eV) and mass detection
was performed in selected ion monitoring (SIM) mode (dwell time =60 ms, electron
multiplier voltage=(2900±50) V). The ion molecularm/zwere chosen to native PAHs
5
(compounds indexed with * in Table 2) and perdeuterated PAHs (only used in the case of the validation of analytical method with SRM 2975). This second GC/MS method was validated by the application of our analytical procedure on SRM 2975.
2.5 Determination of13C/12C isotopic compositions of PAHs
2.5.1 HPLC fractionation
10
An additional purification step was required to eliminate the remaining aromatic un-resolved complex mixture (UCM) that could interfere during the GC/C/IRMS anal-ysis. As a consequence, after silica purification, the extract was concentrated in a volume of 200 µl of isooctane and the aromatic fraction was fractionated by high performance liquid chromatography (HPLC) on aminosilane phase (Dynamax, 5 µm,
15
250 mm×10 mm ID, Varian) using the following solvent program: pentane (100 %)
dur-ing 25 min, then pentane/dichloromethane (90/10, v/v) during 25 min and finally
pentane (100 %) during 10 min. The flow-rate was 4 ml min−1. The HPLC
fractiona-tion based on ring number allowed the collecfractiona-tion of five different fractions by
detect-ing the UV signal at 254 nm: monoaromatic and diaromatic (naphthalenes and
diben-20
zothiophenes for example), phenanthrenes, fluoranthene+pyrene, benz(a)anthracene
+chrysene +pentaaromatics and hexaaromatics. In order to focus the fractionation
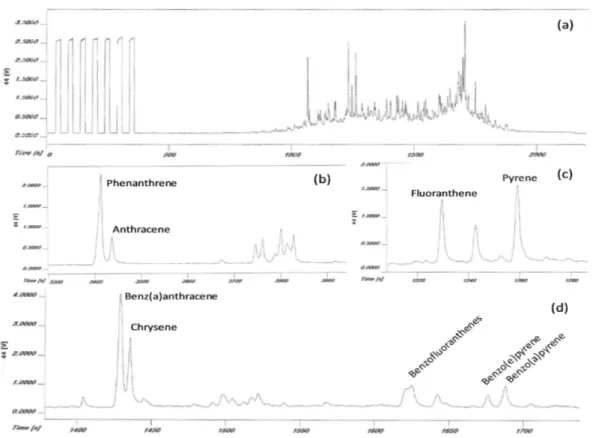
on the native PAHs, HPLC fractionation was performed in the conditions described in a previous work by Guillon et al. (2012b). The objective was to collect only na-tive PAHs and to eliminate remaining compounds by collecting fine fractions (Fig. 1)
25
ACPD
12, 20631–20671, 2012Particulate polycyclic aromatic
hydrocarbons
A. Guillon et al.
Title Page
Abstract Introduction
Conclusions References
Tables Figures
◭ ◮
◭ ◮
Back Close
Full Screen / Esc
Printer-friendly Version
Interactive Discussion
Discussion
P
a
per
|
Dis
cussion
P
a
per
|
Discussion
P
a
per
|
Discussio
n
P
a
per
|
analysis and finally, the volume of reconcentration was optimized to perform isotopic
composition analysis of the different fractions in accurate conditions. Note that under
our analytical conditions, benzo(k)fluoranthene (BkF), benzo(b)fluoranthene (BbF) and benzo(j)fluoranthene (BjF) were coeluted and the isotopic composition determined and presented in this work concerned all these isomers (noted BFs).
5
2.5.2 Measurements of13C/12C isotopic compositions by GC/C/IRMS
Measurements of molecular stable carbon isotopic composition is based on the elu-tion of individual compounds through a gas chromatograph and their conversion to
CO2 and H2O in a combustion furnace heated at 940◦C. H
2O is then trapped via a
Nafion membrane and purified CO2is introduced into a magnetic mass spectrometer,
10
continuously monitoring ions having mass ratio (m/z) 44 (12C16O2), 45 (
13
C16O2 and
12
C17O16O) and 46 (12C18O16O, 13C17O16O and 12C17O2). The isotopic composition
is then calculated using the ratio 44/45m/z and 44/46m/z for the correction of 17O
contribution to the 45m/z signal. The isotopic ratio is reported in terms of δ13C and
expressed in per mil (‰), relative to the Vienna Pee Dee Belemnite standard (VPDB):
15
δ13C=[(13C/12C)sample/ (13C/12C)VPDB −1]×103.
Methodology of the determination of PAHs molecular isotopic compositions was val-idated and described in details elsewhere (Guillon, 2011; Guillon et al., 2012b). Briefly, stable-carbon isotopic analyses of individual PAHs were carried out by gas chromatog-raphy/combustion/isotope ratio mass spectrometry (GC/C/IRMS) using an HP 5890
20
Series II Plus gas chromatograph (Hewlett-Packard) interfaced via a CuO furnace
(940◦C) and a hygroscopic membrane (Nafion) to a Delta Plus isotopic ratio mass
spectrometer (Finnigan MAT Corporation). One µl to 3 µl of solutions were injected into the GC in the splitless mode depending on the concentrations of studied analytes in the fractions. The GC oven temperature program was optimized to reduce PAHs coelutions
25
ACPD
12, 20631–20671, 2012Particulate polycyclic aromatic
hydrocarbons
A. Guillon et al.
Title Page
Abstract Introduction
Conclusions References
Tables Figures
◭ ◮
◭ ◮
Back Close
Full Screen / Esc
Printer-friendly Version
Interactive Discussion
Discussion
P
a
per
|
Dis
cussion
P
a
per
|
Discussion
P
a
per
|
Discussio
n
P
a
per
|
– Different fractions containing PAHs except pentaaromatics: 50◦C (2 min) to 300◦C
(15 min) at a rate of 10◦C min−1.
– For pentaaromatics fraction : 50◦C (2 min) to 200◦C at a rate of 10◦C min−1and
from 260◦C to 300◦C (15 min) at a rate of 2◦C min−1.
The injector temperature was 270◦C. The carrier gas was helium (99.9996 % purity,
5
Linde Gas) (flow rate: 2 ml min−1). The capillary column was a 30 m
× 0.25 mm ID
× 0.25 µm film thickness HP-5MS (Agilent Technologies). For calculation purposes,
CO2reference gas (99.995 % purity, Linde Gas) was automatically introduced into the
isotopic ratio mass spectrometer in a series of pulses at the beginning of each analysis.
2.6 Quality insurance
10
For GC/MS analysis, a calibration solution was prepared with non-deuterated PAH standard solution, internal standard solution and “syringe” standard solution for each type of analysis. This solution was injected before and after each sequence of anal-ysis in order to calculate the PAH response factors with respect to the corresponding internal standards as well as the internal standard response factors with respect to the
15
corresponding “syringe” standards. The response factor values range between 0.48 and 1.6 depending on the molecule. Variations of the response factors are within 2 to 6 %. The injections were carried out only if the conditions required for the analysis were fulfilled (good recovery yields of native and internal PAHs and response factors consistent with control monitoring), the calibration solution being also used to check
20
and monitor the conditions of the chromatographic and detection systems.
Moreover, in order to validate the integrity of analytical system and to monitor the conditions of the chromatographic and detection systems for GC/C/IRMS analysis, a
solution containing 13C /12C certified alkanes (n-C15, n-C20, n-C25, Chiron AS) was
analysed prior to any analysis sequence of samples. Repeatability and
reproducibil-25
ACPD
12, 20631–20671, 2012Particulate polycyclic aromatic
hydrocarbons
A. Guillon et al.
Title Page
Abstract Introduction
Conclusions References
Tables Figures
◭ ◮
◭ ◮
Back Close
Full Screen / Esc
Printer-friendly Version
Interactive Discussion
Discussion
P
a
per
|
Dis
cussion
P
a
per
|
Discussion
P
a
per
|
Discussio
n
P
a
per
|
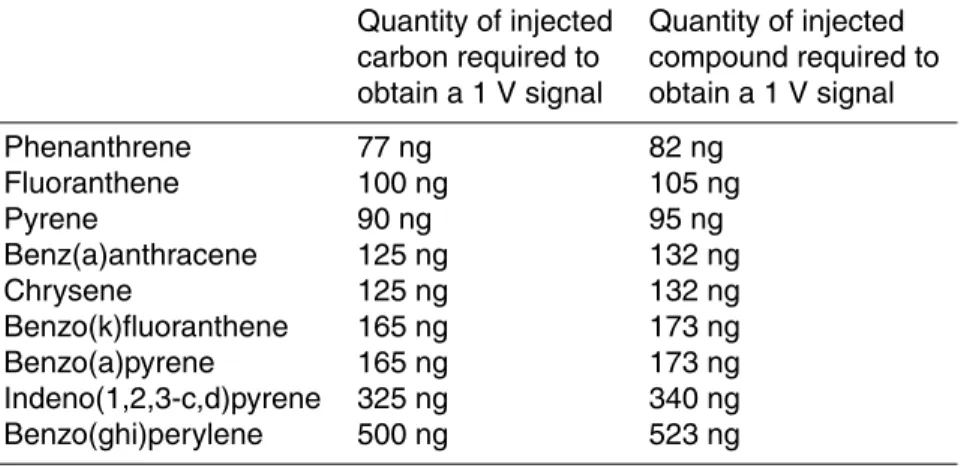
(compounds indexed with * in Table 2) prior to any sequence of analysis. The repro-ducibility of the individual isotopic measurements is ±0.50 ‰ . Precision reported in this study is based on multiple analyses of each sample (at least three analyses). There-fore, as described by Guillon et al. (2012a), the analysis of PAH solutions from 20 to
450 ng µl−1
allowed determining the operational linear range of the method and the limit
5
of quantification, corresponding to the quantity of injected carbon required to measure signal amplitude of ion 44 peak up to 1 V. Table 3 summarises the quantities of PAHs required to perform GC/C/IRMS analysis in accurate conditions.
Therefore, blanks filters and extraction blanks were extracted and analysed in order to check levels of PAHs during the application of analytical protocol (see Sect. S2 in
10
the Supplement).
3 Results and discussion
3.1 Validation on standard materials
As explained before, three standard reference materials were used for the validation of analytical procedure, described in details in Sect. S1 (Supplement). Briefly, SRM
15
2975 was used for the validation of analytical protocol applied on natural particles for
the determination of 13C /12C. Analytical protocol of PAH quantification was applied
on SRM 1649a and SRM 1650b in order to certify the good extraction of PAH in the sequence of wood particle extraction and to validate the quantification of 31 PAHs by
GC/MS, respectively. Recovery yields of internal standard range from (46±13) % to
20
(69±12) %, from (59±15) % to (84±12) % and from 47 % to 91 % for SRM 2975,
SRM 1650b and SRM1649a, respectively (Fig. A1 in the Supplement). Uncertainties vary between 10 % and 15 %. PAH concentrations determined in this study for the
different standard materials are in good agreement with reference and certified values
reported in the literature (Table A1 and Fig. A2). Concerning the quantification of PAHs
25
ACPD
12, 20631–20671, 2012Particulate polycyclic aromatic
hydrocarbons
A. Guillon et al.
Title Page
Abstract Introduction
Conclusions References
Tables Figures
◭ ◮
◭ ◮
Back Close
Full Screen / Esc
Printer-friendly Version
Interactive Discussion
Discussion
P
a
per
|
Dis
cussion
P
a
per
|
Discussion
P
a
per
|
Discussio
n
P
a
per
|
could be explained by the conditions of extraction which were softer than the ones used for the certification of this standard material. The results obtained on SRM 2975, SRM 1650b and SRM 1649a traduce the good reproducibility and repeatability of our analytical procedure. Analyses performed in accurate conditions were validated and allow the determination of the concentrations and the isotopic compositions of PAHs of
5
generated particles.
3.2 Molecular approach
3.2.1 Concentrations of PAHs
Concentrations of 31 PAHs were determined in PM2.5 sampled during wood
combus-tion experiments. Internal standard recovery yields range from 30 to 97 %. Note that the
10
lowest values corresponded to DBT-d8 recovery yield which is a low molecular weight compound and may be lost easily during evaporation steps. Because of the method of
quantification, native PAHs and internal standards were affected by the same
physico-chemical processes during the various steps of the analytical procedure. The use of internal standards allows us correcting the potential losses of native PAHs. Table 4
15
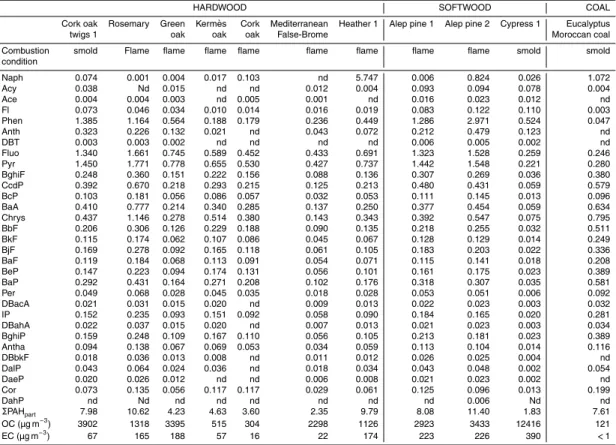
presents the concentrations of particulate-PAHs sampled in the chamber during the combustion of wood species compared to the global concentrations of organic car-bon (OC). Due to the non-availability of OC, concentrations are not reported for four experiments: cork oak twigs 2, juniper tree, heather 2 and cypress 2.
First, PAH concentrations depend on the compounds and on the wood species.
20
Particulate-PAH concentrations (ΣPAHpart) range from 1.83 to 11.40 mg g−
1
OC for Cypress 1 and alep pine 2 respectively, meaning a variation of about one order of magnitude between wood species. These values are in good agreement with PAH concentrations reported in the literature concerning controlled wood burnings for the characterization of particulate emissions (Fine et al., 2001, 2002; Schmidl et al., 2008;
25
ACPD
12, 20631–20671, 2012Particulate polycyclic aromatic
hydrocarbons
A. Guillon et al.
Title Page
Abstract Introduction
Conclusions References
Tables Figures
◭ ◮
◭ ◮
Back Close
Full Screen / Esc
Printer-friendly Version
Interactive Discussion
Discussion
P
a
per
|
Dis
cussion
P
a
per
|
Discussion
P
a
per
|
Discussio
n
P
a
per
|
Therefore, levels of PAH concentrations are significantly different from the same
wood family. For example, combustion of oak woods generate PAH levels from 3.6
to 7.98 mg g−1 of OC. It could be explained by the adaptation of the different species
of oaks against the Mediterranean climate (humidity, temperature). Concerning cork
oak burnings, the nature of wood affects the level of PAH concentrations with higher
5
concentration emissions, when the wood was cut in twigs.
In addition, the type of wood (hardwood vs. softwood) is not correlated with the lev-els of PAH concentrations. This tendency is not consistent with the previous results of
Gonc¸alves et al. (2010), who differentiate Pinus Pinaster combustion with high
concen-trations (ΣPAHpart =75.5 mg g−
1
OC) from three hardwoods emissions with low PAH
10
concentrations (ΣPAHpart<10 mg g−
1
OC). On the contrary, Fine et al. (2001, 2002)
did not significantly differentiate PAH concentrations between hardwood and softwood
combustions from North-eastern and Southern United States, confirming the observa-tions reported in this work.
Considering the concentrations, PAH repartitions for the different studied woods are
15
quite similar: fluoranthene and pyrene are the dominant compounds for all woods, es-pecially for softwoods. This tendency was already reported in the literature (Fine et al., 2001, 2002; Alves et al., 2010; Gonc¸alves et al., 2010), fluoranthene and pyrene
being considered as characteristic of PM2.5from wood combustion. Alves et al. (2010)
reported a different molecular profile for PM10 with benz(a)anthracene as the most
20
abundant PAH.
3.2.2 Molecular fingerprints of particulate-PAHs
Different tools for source apportionment may be used to differentiate emissions from
combustion of wood species. The determination of molecular fingerprints was
per-formed on all the different woods presented in Table 1. Due to the non-availability of
25
ACPD
12, 20631–20671, 2012Particulate polycyclic aromatic
hydrocarbons
A. Guillon et al.
Title Page
Abstract Introduction
Conclusions References
Tables Figures
◭ ◮
◭ ◮
Back Close
Full Screen / Esc
Printer-friendly Version
Interactive Discussion
Discussion
P
a
per
|
Dis
cussion
P
a
per
|
Discussion
P
a
per
|
Discussio
n
P
a
per
|
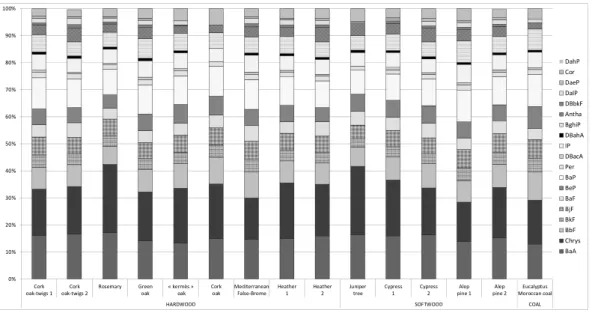
species are added in that part of the discussion. Figure 2 presents PAHs molecular
repartitions of the different woods studied here. Note that percentages of contribution
of each PAH were determined considering the total of particulate PAHs from m/z 228 to 302 (from benz(a)anthracene to dibenzoperylenes). The choice of these high molecular weight compounds is based on the fact that they are as a majority adsorbed on
particu-5
late matter (Odabasi et al., 1999; R ´e-Poppi et Santiago-Silva, 2005) and the molecular profiles reported in this work can be compared to those reported in the literature.
No significant particularities could be underlined meaning that PAH molecular pro-files are conserved for the variety of all wood species. Considering Fig. 2 only, benz(a)anthracene and chrysene represent the dominant contributions in the sum of
10
particulate-PAHs (from BaA to DahP) followed by benzo(a)pyrene. Benz(a)anthracene and chrysene contributions vary from 12.9 and 17.1 % and from 14.5 to 25.4 % re-spectively. Note that preponderance of both compounds was already reported in the literature as molecular markers of wood combustion (Marchand et al., 2004; Ravindra et al., 2008). Our results confirm the interest of chrysene measurements in source
15
assessment methodologies.
Main differences regard compounds with low concentrations such as perylene,
DBacA, DBahA, DBbkF, DalP, DaeP and DahP involving that these compounds could not be used as molecular tracers because of too low concentrations in ambient
sam-ples. Previous works reported the interest of molecular fingerprints in order to diff
eren-20
tiate PAH sources (Sun et al., 2003; Zhang et al., 2009; El Haddad et al., 2011) and some models of source apportionment are based on these measurements to determine the origins of particulate matter. In this study, we show that the use of a single molecu-lar fingerprint based on PAH concentrations could traduce the origin of Mediterranean wood burnings whatever the wood species because of the similarities of molecular
25
fingerprints of the eleven woods. Nevertheless, this methodology also does not allow
differentiating the variety of different wood species because of the conservation of such
ACPD
12, 20631–20671, 2012Particulate polycyclic aromatic
hydrocarbons
A. Guillon et al.
Title Page
Abstract Introduction
Conclusions References
Tables Figures
◭ ◮
◭ ◮
Back Close
Full Screen / Esc
Printer-friendly Version
Interactive Discussion
Discussion
P
a
per
|
Dis
cussion
P
a
per
|
Discussion
P
a
per
|
Discussio
n
P
a
per
|
cypress species, the impact of combustion conditions is not underlined as they also present similar molecular fingerprints.
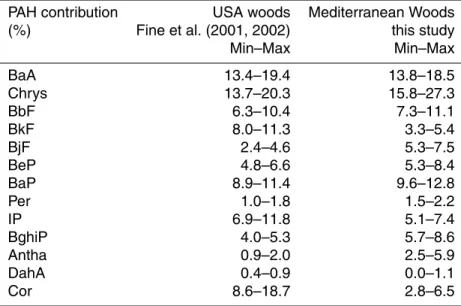
The application of the methodology for determining PAH molecular fingerprints on the results of Fine et al. (2001, 2002) by choosing the common measured compounds re-veals some similarities and some particularities for the large variety of studied species
5
(Table 5).
This molecular approach shows that some compounds may allow differentiating
com-bustion of woods from North America and Mediterranean Basin. As shown in Table 5, BkF, BjF, IP, BghiP, Antha and Cor contributions to the sum of PAH concentrations (from
BaA to Cor) are significantly different between the two sets of wood burnings. Note that
10
wood species are characteristic from the two areas and that these values are calcu-lated as a mix of both softwoods and hardwoods, meaning that whatever the type of wood, the molecular signature is conserved from a region. Such observations confirms the importance of the choice of fingerprints in source apportionment models depend-ing on the area of interest and the necessity to study a large panel of particulate-PAHs
15
characteristic from sampling sites. Nevertheless, the conservation of molecular
finger-prints does not allow differentiating different kinds of wood burnings in the same area,
showing the necessity to use other methodologies of source apportionment regarding wood species from United States of America and from the Mediterranean Basin.
3.2.3 Diagnostic ratios
20
Molecular approach of source apportionment may be based on the use of molecular fingerprints as described in the previous section but also on the use of molecular diag-nostic ratios. They are largely used in the literature for source tracking (Yang and Chen, 2004; Li et al., 2009; Yin et al., 2010). This methodology is based on the measure-ments of PAH concentrations and the determination of concentration ratios which may
25
ACPD
12, 20631–20671, 2012Particulate polycyclic aromatic
hydrocarbons
A. Guillon et al.
Title Page
Abstract Introduction
Conclusions References
Tables Figures
◭ ◮
◭ ◮
Back Close
Full Screen / Esc
Printer-friendly Version
Interactive Discussion
Discussion
P
a
per
|
Dis
cussion
P
a
per
|
Discussion
P
a
per
|
Discussio
n
P
a
per
|
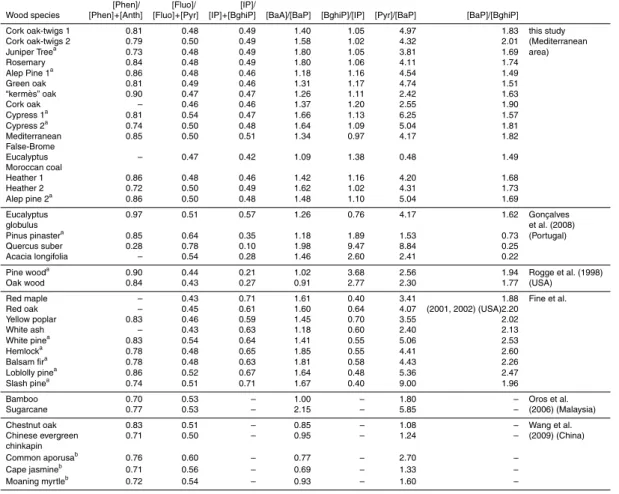
[BaP]/[BghiP] value up to 1.25 and [IP]/([IP]+[BghiP]) close to 0.62 correspond to PAHs
emitted from wood burning. Li and Kamens (1993) determined reference values
be-tween 1 and 1.5 for [BaA]/[BaP] and around 0.8 for [BghiP]/[IP]. [Phen]/([Phen]+[Anth])
value is evaluated at 0.84±0.16 by Galarneau (2008). Table 6 presents diagnostic
ra-tios determined in this work. First, some diagnostic rara-tios are very similar for the diff
er-5
ent species, such as [Phen]/([Phen]+[Anth]) and [Fluo]/([Fluo]+[Pyr]). On the contrary,
some molecular ratios allow differentiating some variety of wood species. For example,
[IP]/([IP]+[BghiP]), [BaA]/[BaP], [BghiP]/[IP] and [Pyr]/[BaP] are significantly different
for eucalyptus Moroccan Coal than for other woods. Note that eucalyptus Moroccan Coal is a coal and particulate-PAHs are not considered as wood burning signature,
10
contrary to other materials studied in this work. Moreover, [BaA]/[BaP] and [Pyr]/[BaP] could be used for the apportionment of cypress trees. Despite of a large range of variations of diagnostic ratios, no tendency is observed concerning concerning both softwood and hardwood families. Nevertheless, variations of diagnostic ratios are not
sufficient to differentiate all woods, meaning that others factors may involve variations of
15
PAH ratios as conditions of combustion, temperature, elemental carbon normalization. In the literature, several diagnostic ratios are used as reference ratios for PAH
emitted during wood burnings, as mentioned before. The different diagnostic ratios
measured in this study are consistent with these reference diagnostic ratios
ex-cept for [IP]/([IP]+[BghiP]), [BghiP]/[IP] and [Fluo]/([Fluo]+[Pyr]). Thus, concerning
20
[IP]/([IP]+[BghiP]) and [BghiP]/[IP], diagnostic ratios from this study are respectively
lower and higher than reported reference values. Nevertheless, [IP]/([IP]+[BghiP])
varies in a large range depending on the sources. More, the values reported by Ravin-dra et al. (2008) for Diesel exhaust, coal and wood combustion are in the range of those measured for Diesel exhaust (0.35–0.7) reported by Rogge et al. (1993). The
25
variation of combustion conditions in the different works and the impact of
physico-chemical processes on diagnostic ratios during the transport of particulate matter may
possibly affect the reference values explaining the gap observed in several studies
ACPD
12, 20631–20671, 2012Particulate polycyclic aromatic
hydrocarbons
A. Guillon et al.
Title Page
Abstract Introduction
Conclusions References
Tables Figures
◭ ◮
◭ ◮
Back Close
Full Screen / Esc
Printer-friendly Version
Interactive Discussion
Discussion
P
a
per
|
Dis
cussion
P
a
per
|
Discussion
P
a
per
|
Discussio
n
P
a
per
|
study but these values also correspond to gasoline exhaust diagnostic ratios reported by Dallarosa et al. (2005) confirming the limitation of this method for source
apportion-ment. Another example is the [BaA]/[BaP] ratio for which values for the different woods
studied in this work are consistent with the reference value (Li and Kamens, 1993) and with the values reported for other wood combustion studies (Table 6) but also similar to
5
the diagnostic ratios of Diesel exhaust (0.9–1.7) reported by the same study of Li and Kamens (1993). Note that diagnostic ratios are linked to the conditions of formation of
PAHs at the emission point and could be affected by the variation of environmental
con-ditions during the transport of particles (photochemistry, oxidative processes, mixing of air masses...).
10
The application of molecular approach on the sets of data from literature is difficult
but allows differentiating wood species from several areas such as North American,
Asian or European woods despite of previous noticed differences with reference
val-ues. Some diagnostic ratios were calculated by using PAH concentrations reported
in previous works of wood burnings from these different areas and are presented in
15
Table 6.
Depending on the compounds, some diagnostic ratios, such as [Fluo]/([Fluo]+[Pyr]),
[Pyr]/[BaP] and [BaP]/[BghiP], are constant in the range of 0.4–0.6, up to 1.24 and up to 1.49 respectively, whatever were the wood and the area of interest, except for the results reported by Gonc¸alves et al. (2008). For the most of the studied PAH ratios,
20
measurements are not in good agreement because of either high variations of
diag-nostic ratios or different conditions of sampling. Consequently, diagnostic ratios of this
study are significantly different despite the area of interest was similar (Mediterranean
Basin).
Moreover, [Pyr]/[BaP] is constant except for eucalyptus Moroccan coal which value
25
is lower than any reported values. This may be due to the nature of burned mate-rial (coal vs. dried wood) and this is observed considering [BaA]/[BaP], [BghiP]/[IP]
and [IP]/([IP]+[BghiP]). In the case of [Pyr]/[BaP], the trend is the same as for
ACPD
12, 20631–20671, 2012Particulate polycyclic aromatic
hydrocarbons
A. Guillon et al.
Title Page
Abstract Introduction
Conclusions References
Tables Figures
◭ ◮
◭ ◮
Back Close
Full Screen / Esc
Printer-friendly Version
Interactive Discussion
Discussion
P
a
per
|
Dis
cussion
P
a
per
|
Discussion
P
a
per
|
Discussio
n
P
a
per
|
American and European species, except for sugarcane combustion. Indeed, this plant
is a “C4 plant” including a photosynthetic pathway different from other studied woods
which are “C3 plants”. This difference may be explained by the way of PAH formation
during the combustion of both plant families.
Finally, [IP]/([IP]+[BghiP]) and [BghiP]/[IP] are significantly different between
vari-5
ous areas of interest. A large variation is observed for wood combustions in Portugal (Gonc¸alves et al., 2008) as described before. Works performed in the USA are
sig-nificantly different presenting diagnostic ratios reported by Fine et al. (2001, 2002)
and Rogge et al. (1998) in the ranges of 0.6–0.7 and 0.2–0.3 respectively. Note that combustion studies were not performed in the same conditions: Rogge et al. (1998)
10
sampled particulate matter along the chimney during wood combustion and fuelled regularly the fire with wood logs whereas Fine et al. (2001, 2002) performed the sam-pling four meters above the fire and injected cold air to cool the smoke allowing organic
vapours to condense. Our values are between 0.45 and 0.5 showing that differences in
European and American wood burnings are significant and could be useful to diff
eren-15
tiate the different varieties.
To conclude, variations of diagnostic ratios are not significant to apportion
combus-tion of various wood species. Differences observed between the different reported
stud-ies may arise from the nature of woods but also from the combustion conditions (flam-ing or smolder(flam-ing fires, time of burn(flam-ing, moisture content...), type of fireplace facilities
20
(domestic fireplace or laboratory experiments) or conditions at the beginning of fire (addition of fuel, newspapers...). Including all these considerations, it appears
some-times difficult to compare results from different works, especially because of variations
of gas-particles partitioning and PAH profiles. Nevertheless, whatever the study,
diag-nostic ratios are not significantly different for the woods from the same area involving
25
that this approach is not sufficient to clearly differentiate the origins of particulate
ACPD
12, 20631–20671, 2012Particulate polycyclic aromatic
hydrocarbons
A. Guillon et al.
Title Page
Abstract Introduction
Conclusions References
Tables Figures
◭ ◮
◭ ◮
Back Close
Full Screen / Esc
Printer-friendly Version
Interactive Discussion
Discussion
P
a
per
|
Dis
cussion
P
a
per
|
Discussion
P
a
per
|
Discussio
n
P
a
per
|
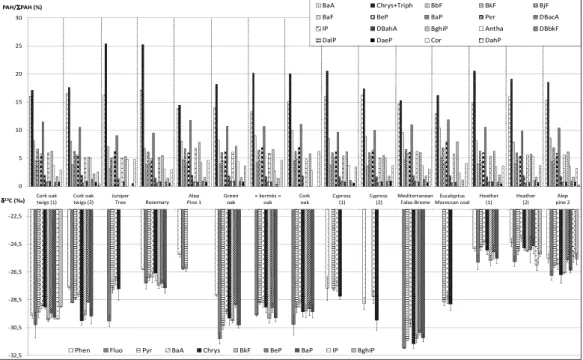
3.3 Molecular stable-carbon isotopic compositions of PAHs
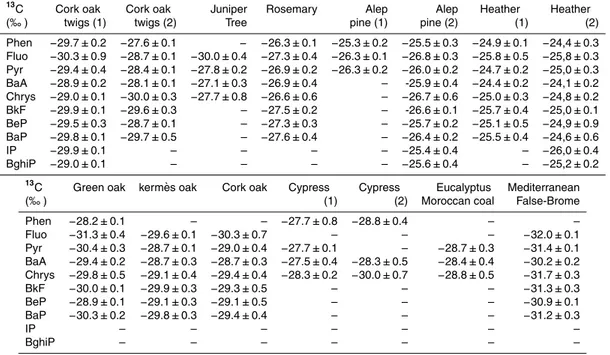
Molecular isotopic compositions of PAHs were determined for the panel of woods con-sidered in this work (Table 7). Due to the low quantities of particulate-PAHs on re-maining filters after the GC/MS analysis and the limits of quantification of GC/C/IRMS measurements, especially for high molecular weight compounds, some molecular
iso-5
topic compositions could not be determined, explaining the differences of isotopic
pro-files of wood species (Table 7 and Fig. 3). Note that uncertainties correspond to three replicates of analysis and range from 0.1 to 0.9 ‰, being in good agreement with uncer-tainties determined with standard solutions (see previous sections) and reference ma-terials (Guillon et al., 2012b). Considering all the panel of PAHs, two groups of woods
10
could be differentiated by molecular isotopic compositions. The first including rosemary,
alep pine 1 and 2 and heathers is characterised byδ13C depleted in13C with isotopic
compositions between −27.6 and −24.1 ‰. The second group composed of the
dif-ferent oaks, Mediterranean false-brome, eucalyptus Moroccan coal, juniper tree and
cypresses is characterised by isotopic compositions in the range of −32 to−27.1 ‰.
15
Whatever the PAH and the conditions of combustion, molecular isotopic signatures of
heathers are depleted in13C whereas those of Mediterranean false-brome are depleted
in 12C, meaning that isotopic measurements could differentiate these wood species
from others. No similarities are observed for the isotopic profiles and each compound
could be analysed separately in order to differentiate wood species (Fig. 3). It is also
20
clearly underlined on Fig. 3 that molecular fingerprints are not sufficient to differentiate
the panel of woods contrary to molecular isotopic compositions which are specific for each species. Regarding the small uncertainties of measurements, it is possible in this study to focus the analysis on some compounds of interest, and not on the panel of
PAHs. Indeed, molecular isotopic compositions of each compound allow differentiating
25
at least the half of wood species signature (Table 7). For example, phenanthrene
iso-topic compositions are significantly different between all woods studied in this work and
ACPD
12, 20631–20671, 2012Particulate polycyclic aromatic
hydrocarbons
A. Guillon et al.
Title Page
Abstract Introduction
Conclusions References
Tables Figures
◭ ◮
◭ ◮
Back Close
Full Screen / Esc
Printer-friendly Version
Interactive Discussion
Discussion
P
a
per
|
Dis
cussion
P
a
per
|
Discussion
P
a
per
|
Discussio
n
P
a
per
|
heathers, pines and rosemary. Regarding the results for benzo(e)pyrene, the isotopic
compositions of heathers and alep pine 2 are depleted in13C contrary to those of other
woods. As underlined with phenanthrene and benzo(e)pyrene data, isotopic
compo-sitions do not allow separating hardwoods from softwoods and the variations ofδ13C
are probably not induced by this repartition of species (Fig. 3). Nevertheless, the
un-5
certainties on these measurements of isotopic compositions allow to differentiate the
origin of particulate-PAHs between the different wood species, by combining the results
of several PAH isotopic compositions.
Several reference values of molecular isotopic compositions of particulate-PAHs
from different sources are presented in Fig. 4 and compared with the results of this
10
study. The application of the methodology of source apportionment based on isotopic measurements involves the knowledge of isotopic compositions of PAHs from various sources contributing to the particulate pollution at the site of interest. First, note that all PAH isotopic measurements reported in this work are consistent with previous re-sults reported by O’Malley et al. (1994, 1997) and Okuda et al. (2002), concerning
15
C3 plant combustion, fireplace and woodburning. The variations of isotopic signatures
of particulate-PAHs are reported in the range of −26.6 to −12.9 ‰ for vehicular
ex-hausts (O’Malley et al., 1994; Okuda et al., 2002; Peng et al., 2006). Significant
dif-ferences betweenδ13C of PAHs from woodburning emissions and vehicular exhaust
confirm the interest of this approach and the possibility of the method to diff
erenti-20
ate these sources by isotopic measurements. Most of PAH isotopic compositions
al-low differentiating wood combustions and vehicular exhaust, except phenanthrene and
indeno(1,2,3-c,d)pyrene whose isotopic compositions are almost the same for these
two kinds of origins. Nevertheless, coal combustion signatures are difficult to diff
er-entiate from woodburnings, especially for benzofluoranthenes, benzo(a)pyrene and
25
indeno(1,2,3-c,d)pyrene. The main reason is based on the fact that results from lit-erature are not consistent and the range of isotopic compositions for coal combustion
is large:δ13C between−22 and−31.2 ‰ depending on the origin of coal and the
ACPD
12, 20631–20671, 2012Particulate polycyclic aromatic
hydrocarbons
A. Guillon et al.
Title Page
Abstract Introduction
Conclusions References
Tables Figures
◭ ◮
◭ ◮
Back Close
Full Screen / Esc
Printer-friendly Version
Interactive Discussion
Discussion
P
a
per
|
Dis
cussion
P
a
per
|
Discussion
P
a
per
|
Discussio
n
P
a
per
|
Consequently, it is necessary to focus the measurement on particulate-PAHs whose isotopic compositions are specific for each source and to continue the characterization of PAH sources at the emission by studying other sources such as vehicular exhausts in European countries. Therefore, regarding the PAH molecular isotopic compositions of coal, values are similar with one of others sources (such as vehicular exhaust) and
in-5
volves that no apportionment of sources is possible when coal combustion contributes to the particulate pollution. Consequently, prior to any application of this isotopic ap-proach, a partial knowledge of potential sources involved in the pollution is often nec-essary and especially if any coal combustion is involved in the particulate pollution.
4 Conclusions
10
In this study, the methodology of source apportionment by the determination of
molec-ular isotopic compositions (δ13C) of particulate-PAHs was applied on different
sam-ples of particles arising from the combustion of ten different woods and coal from the
Mediterranean Basin. Combustions of woods were performed under controlled con-ditions in a burning chamber in order to compare nature of woods (hardwood vs.
15
softwood), wood species and conditions of burning (flaming vs. smoldering). After the validation of the full analytical procedure, concentrations of thirty-one PAHs were de-termined by GC/MS analysis and molecular isotopic compositions of ten PAHs were measured for all the panel of wood particles. Molecular and isotopic approaches were
applied on this set of samples in order to identify the relevant tools for differentiating
20
wood species. Molecular approach confirms that molecular fingerprints are constant whatever the wood species and the conditions of combustion. Comparing our results with previous works reported on particulate matter from wood burnings at the emis-sion (Rogge et al., 1998; Fine et al., 2001, 2002; Oros et al., 2006; Gonc¸alves et al.,
2008; Wang et al., 2009), some reference diagnostic ratios are constant in the different
25
areas of interest ([Fluo]/([Fluo]+[Pyr]), [Pyr]/[BaP] and [BaP]/[BghiP]) whereas some
ACPD
12, 20631–20671, 2012Particulate polycyclic aromatic
hydrocarbons
A. Guillon et al.
Title Page
Abstract Introduction
Conclusions References
Tables Figures
◭ ◮
◭ ◮
Back Close
Full Screen / Esc
Printer-friendly Version
Interactive Discussion
Discussion
P
a
per
|
Dis
cussion
P
a
per
|
Discussion
P
a
per
|
Discussio
n
P
a
per
|
(for instance [Phen]/([Phen]+[Anth]) and [BaA]/[BaP]). Nevertheless, the values of
di-agnostic ratios of wood combustion are often in the same range as those of vehicular exhausts, revealing the limitation of this methodology.
Therefore, it is preferred to use molecular isotopic compositions of particulate-PAHs
for all the panel of woods, wood species being characterised by different isotopic
sig-5
natures depending on the PAH of interest and on the conditions of combustion. The isotopic signatures of wood burnings from Mediterranean Basin are in good agreement with previous wood combustion data from the literature (O’Malley et al., 1997; Okuda
et al., 2002) and significantly different from those reported for vehicular exhaust or
fire-place soot, confirming the interest of the isotopic methodology for the apportionment
10
of the various sources of particulate matter. Our results also confirm the necessity to measure isotopic compositions of particulate-PAHs at the emission for a larger variety of sources, alike wood species in this study, but also for others origins such as vehicu-lar exhausts (Diesel and gasoline) or coal combustion. The vehicu-large variability of isotopic compositions for wood combustion particles represent the large variety of wood species
15
and of combustion conditions that may occur in the nature during opened fires largely common in this arid area.
Supplementary material related to this article is available online at: http://www.atmos-chem-phys-discuss.net/12/20631/2012/
acpd-12-20631-2012-supplement.pdf. 20
Acknowledgements. The authors wish to thank the ChArMEx Programme supported by the In-stitut National des Sciences de l’Univers (INSU) of CNRS, though the MISTRALS-ChArMEx programme and the Aquitaine Region for their financial Supports. The authors also grate-fully acknowledge Cathy Liousse (Laboratoire d’A ´eorologie, LA-Toulouse) for organizing ex-periments of wood combustion in the burning chamber of Lannemezan and the Laboratoire de 25
ACPD
12, 20631–20671, 2012Particulate polycyclic aromatic
hydrocarbons
A. Guillon et al.
Title Page
Abstract Introduction
Conclusions References
Tables Figures
◭ ◮
◭ ◮
Back Close
Full Screen / Esc
Printer-friendly Version
Interactive Discussion
Discussion
P
a
per
|
Dis
cussion
P
a
per
|
Discussion
P
a
per
|
Discussio
n
P
a
per
|
The publication of this article is financed by CNRS-INSU.
References
Alves, C. A., Gonc¸alves, C., Evtyugina, M., Pio, C. A., Mirante, F., and Puxbaum, H.: Particulate 5
organic compounds emitted from experimental wildland fires in a Mediterranean ecosystem, Atmos. Environ., 44, 2750–2759, doi:10.1016/j.atmosenv.2010.04.029, 2010.
Amoako, J., Ansa-Asare, O. D., Karikari, A. Y., and Dartey, G.: Levels of polycyclic aromatic hydrocarbons (PAHs) in the Densu River Basin of Ghana, Environ. Monit. Assess., 174, 471–480, doi:0.1007/s10661-010-1471-y, 2011.
10
Atkinson, R. and Arey, J.: Atmospheric chemistry of gas-phase polycyclic aromatic hydrocar-bons: Formation of atmospheric mutagens, Environ. Health Persp., 102 (suppl. 4), 117–126, 1994.
Ballentine, D. C., Macko, S. A., Turekian, V. C., Gilhooly, W. P., and Martincigh, B.: Com-pound specific isotope analysis of fatty acids and polycyclic aromatic hydrocarbons in 15
aerosols: Implications for biomass burning, Org. Geochem., 25, 97–104, doi:10.1016/S0146-6380(96)00110-6, 1996.
Birch, M. E. and Cary, R. A.: Elemental carbon-based method for occupational monitoring of particulate diesel exhaust: Methodology and exposure issues, Analyst, 121, 1183–1190, 1996.
20
ACPD
12, 20631–20671, 2012Particulate polycyclic aromatic
hydrocarbons
A. Guillon et al.
Title Page
Abstract Introduction
Conclusions References
Tables Figures
◭ ◮
◭ ◮
Back Close
Full Screen / Esc
Printer-friendly Version
Interactive Discussion
Discussion
P
a
per
|
Dis
cussion
P
a
per
|
Discussion
P
a
per
|
Discussio
n
P
a
per
|
Dallarosa, J. B., Teixeira, E. C., Pires, M., and Fachel, J.: Study of the profile of polycyclic aromatic hydrocarbons in atmospheric particles (PM10) using multivariate methods, Atmos. Environ., 39, 6587–6596, doi:10.1016/j.atmosenv.2005.07.034, 2005.
Desaules, A., Ammann, S., Blum, F., Br ¨andli, R. C. Bucheli, T. D., and Keller, A.: PAH and PCB in soils of Switzerland—status and critical review, J. Environ. Monitor., 10, 1265–1277, 5
doi:10.1039/b807206j, 2008.
Eiguren-Fernandez, A., Miguel, A. H., Froines, J. R., Thurairatnam, S., and Avol, E. L.: Sea-sonal and spatial variation of polycyclic aromatic hydrocarbons in vapor-phase and PM2.5 in Southern California urban and rural communities, Aerosol Sci. Tech., 38, 447–455, doi:10.1080/02786820701213511, 2004.
10
El Haddad, I., Marchand, N., Wortham, H., Piot, C., Besombes, J.-L., Cozic, J., Chauvel, C., Ar-mengaud, A., Robin, D., and Jaffrezo, J.-L.: Primary sources of PM2.5organic aerosol in an in-dustrial Mediterranean city, Marseille, Atmos. Chem. Phys., 11, 2039–2058, doi:10.5194/acp-11-2039-2011, 2011.
Fine, P. M., Cass, G. R., and Simoneit, B. R. T.: Chemical characterization of fine particle 15
emissions from fireplace combustion of woods grown in the North-eastern United States, Environ. Sci. Technol., 35, 2665–2675, doi:10.1021/es001466k, 2001.
Fine, P. M., Cass, G. R., and Simoneit, B. R. T.: Chemical characterization of fine particle emissions from the fireplace combustion of woods grown in the Southern United States, Environ. Sci. Technol., 36, 1442–1451, doi:10.1021/es0108988, 2002.
20
Fine, P. M., Cass, G. R., and Simoneit, B. R. T.: Chemical characterization of fine particle emissions from the wood stove combustion of prevalent United States tree species, Environ. Eng. Sci., 21, 705–721, doi:10.1089/ees.2004.21.705, 2004.
Galarneau, E.: Source specificity and atmospheric processing of airborne PAHs: implications for source apportionment, Atmos. Environ., 42, 8139–8149, 25
doi:10.1016/j.atmosenv.2008.07.025, 2008.
Garc´ıa-Alonso, S., P ´erez-Pastor, R. M., Sevillano-Casta ˜no, M. L., Escolano, O., and Garc´ı a-Frutos, F. J.: Influence of particle size on the quality of PAH concentration measurements in a contaminated soil, Polycycl. Aromat. Comp., 28, 67–83, doi:10.1080/10406630701815253, 2008.
30